| Issue |
A&A
Volume 661, May 2022
The Early Data Release of eROSITA and Mikhail Pavlinsky ART-XC on the SRG mission
|
|
|---|---|---|
| Article Number | A30 | |
| Number of page(s) | 11 | |
| Section | Interstellar and circumstellar matter | |
| DOI | https://doi.org/10.1051/0004-6361/202141104 | |
| Published online | 18 May 2022 | |
SN 1987A: Tracing the flux decline and spectral evolution through a comparison of SRG/eROSITA and XMM-Newton observations
1
Max-Planck-Institut für extraterrestrische Physik,
Giessenbachstrasse 1,
85748
Garching, Germany
e-mail: This email address is being protected from spambots. You need JavaScript enabled to view it.
2
Remeis Observatory and ECAP, Universität Erlangen-Nürnberg,
Sternwartstr. 7,
96049
Bamberg,
Germany
3
Université de Strasbourg, CNRS, Observatoire astronomique de Strasbourg,
UMR 7550,
67000
Strasbourg,
France
Received:
16
April
2021
Accepted:
15
July
2021
Abstract
Context. SN 1987A is the supernova closest to us observed in the past four centuries. It provides the unique opportunity of witnessing the birth and evolution of a supernova remnant. Monitoring the source in X-rays provides insights into the physics of the shock, the X-ray emitting plasma, and the interaction of the shock with the structures in the circumstellar medium. The source has been monitored by XMM-Newton EPIC-pn from 2007 to 2020. SRG/eROSITA also observed the source during its commissioning phase and first light in September and October 2019.
Aims. We investigated the spectral and flux evolution of SN 1987A in X-rays in the last 14 yr up to November 2020 using XMM-Newton and eROSITA observations.
Methods. We performed a detailed spectral analysis using a three-component plane-parallel shock model and analysed and modelled the EPIC-pn monitoring and eROSITA observations in a consistent manner.
Results. This paper reports a complete and the most recent flux evolution of SN 1987A in the soft (0.5−2 keV) and hard (3−10 keV) X-ray band. The flux in the soft band flattened around 9424 days and then displayed a turnover between 10 142 and 10 493 days, after which it showed a continued decline. At about the same time, a break in the hard-band flux time evolution slope was detected. This implies that the blast wave has now passed beyond the dense structures of the equatorial ring and is expanding farther into more tenuous circumstellar medium. The temporal evolution of the normalisations of the three shock components match the results of hydrodynamical simulations well, which predict a blue supergiant progenitor scenario. The trend in recent epochs indicates that the emission caused by the forward shock after leaving the equatorial ring and by the reverse shock in the ejecta is now becoming more dominant. The elemental abundances in the hot plasma component are significantly higher than those in the cooler component, indicating an origin in the reverse shock that propagates into the ejecta.
Key words: ISM: supernova remnants / ISM: individual objects: SN 1987A / Magellanic Clouds / radiation mechanisms: general
© C. Maitra et al. 2022
 Open Access article, published by EDP Sciences, under the terms of the Creative Commons Attribution License (https://creativecommons.org/licenses/by/4.0), which permits unrestricted use, distribution, and reproduction in any medium, provided the original work is properly cited.
Open Access funding provided by Max Planck Society.
1 Introduction
Located in the Large Magellanic Cloud (LMC) at a relatively close distance of 51.4 ± 1.2 kpc (Panagia 1999), supernova (SN) 1987A is the closest SN seen on Earth in the past four centuries. It provides the unprecedented opportunity of witnessing the birth and evolution of a SN into its remnant (McCray & Fransson 2016, and references therein). The study of SN 1987A is further intriguing because of the circumstellar ring system that surrounds it, which is composed of three co-axial rings. The rings either originated in the merging of a binary system about 20 000 yr before the explosion (Morris & Podsiadlowski 2007) or in collisions of a fast wind of the blue supergiant phase of the progenitor with material from a slow wind of the earlier red supergiant phase (Chita et al. 2008). Thirty-four years after its explosion, SN 1987A continues to be intensely monitored at all wavelengths. Monitoring the source in X-rays is particularly interesting because it provides insights into the physics of the shock-emitting plasma and its interaction with the structures in the circumstellar medium (CSM).
SN 1987A was first detected in soft X-rays with ROSAT (Beuermann et al. 1994; Hasinger et al. 1996). Its X-ray emission has increased for about 25 yr since the first detection. A steep rise in soft X-rays was detected after 2000 at ~4500 days after the explosion with the Chandra X-ray observatory (Park et al. 2005) and with XMM-Newton (Haberl et al. 2006). The increase in X-ray emission was obviously correlated with the encounter of the blast wave with the equatorial high-density ring created by the progenitor. Studies following in the years thereafter using Suzaku and XMM-Newton observations have confirmed the steep increase (Sturm et al. 2009; Maggi et al. 2012). Until 2012 (~9000 days), the X-ray emission continued to rise. Soft X-ray emission below 2 keV increased with a higher rate than the harder emission (3−10keV).
The continuous monitoring has revealed that in the years around 2012, a change in the flux rise and in the X-ray spectrum occurred. This was also complemented by continuous optical monitoring observations, which indicated the passing of the blast wave over the dense equatorial structures and the formation of hotspots outside the equatorial ring around the same time (Fransson et al. 2015; Larsson et al. 2019). In the X-ray regime, after the increase rate in flux started to slow down in 2006 (~7000 days), the X-ray light curve has significantly levelled off since 2012. A study of the evolution of the flux and the morphology in X-rays over 16 yr using Chandra was presented by Frank et al. (2016). While the soft emission below 0.8 keV increased until about 8000 days and remained constant, with a possible indication of a decrease, the X-ray light curve above 0.5 keV continued to rise, which is in particular prominent above 2 keV. In the Chandra images, a reversal of the east-west asymmetry in the X-ray emission is observed. The eastern part started to fade after ~9500 days.
Recently, new studies based on archival data of XMM-Newton taken in the past ~15yr have been published. They further confirmed the declining trend of the soft-emission component, while the harder component continued to increase (Alp et al. 2021; Sun et al. 2021). Alp et al. (2021) reported an analysis of XMM-Newton EPIC-pn and RGS data up to 2019 together with NuSTAR data, while the analysis of XMM-Newton observations (both EPIC and RGS) was also reported by Sun et al. (2021). Sun et al. (2021) modelled the XMM-Newton spectra assuming two thermal plasma emission components, one reproducing the emission from the shocked equatorial ring, and the other from the gas around the SN shocked by the blast wave. This model is similar to what was assumed by Sturm et al. (2010) and Frank et al. (2016). The XMM-Newton data, however, also show a significant excess at higher energies, which might indicate the existence of an additional high-temperature plasma component (Zhekov et al. 2010; Dewey et al. 2012; Maggi et al. 2012; Alp et al. 2021).
Spectra of SN 1987A have also been taken with grating spectrometers (XMM-Newton RGS, Chandra LETG, HETG), which allow constraining the emission components and therefore shock models thanks to the high spectral resolution (Zhekov et al. 2006, 2009; Sturm et al. 2010; Dewey et al. 2012). In particular, with Chandra HETG monitoring observations, the evolution of the spectral components and the elemental abundances was studied in the past 10 yr (Bray et al. 2020; Alp et al. 2021).
To better understand the possible components of the X-ray emission and the evolution of the SN, a hydrodynamic simulation and modelling of the resulting X-ray spectrum was performed by Dewey et al. (2012) based on plasma properties obtained from grating spectra taken with Chandra and XMM-Newton. The latest hydrodynamic simulations were presented by Orlando et al. (2020), who compared different progenitor scenarios and predicted the evolution and dynamical and radiative properties of the remnant of SN1987A.
Recent observations have also been analysed in a search for indications of non-thermal emission in the Chandra + NuSTAR spectrum. Greco et al. (2021) have analysed Chandra and NuS-TAR data and concluded that the data might indicate the presence of a pulsar wind nebula. However, the possible non-thermal emission might also be emission from particles accelerated in the shocks. The non-thermal emission component, however, was not confirmed by Alp et al. (2021) in the analysis of XMM-Newton and NuSTAR data.
In this paper, we report the recent results from the XMM-Newton monitoring of SN 1987A until the end of 2020 and the SRG/eROSITA observations of the source taken during its commissioning phase and first light. eROSITA is very similar to XMM-Newton in terms of their on-axis point spread functions (PSF) and the effective area in the 0.5−2.0 keV range. eROSITA has a larger field of view (1 degree diameter compared to 0.5 degrees) without CCD gaps, which can be read out within only 50ms. This provides the possibility of using subpixel resolution, and the field of view is characterized by a temporally more constant particle background. For the analysis of SN1987A, the main advantage with respect to XMM-Newton is the improved spectral resolution, especially with respect to the redistribution, which could be considerably suppressed and enables spectroscopic studies down to 150 eV. Section 2 presents the observational data, Sect. 3 the spectral analysis of the XMM-Newton and eROSITA observations, Sect. 4 the results, and Sects. 5 and 6 the discussion and conclusions.
2 Observational data
We have monitored SN 1987A regularly since 2007 with XMM-Newton about once a year. The most recent observations were performed in November 2020. An additional observation to allow cross-calibration studies between XMM-Newton and eROSITA was performed in September 2019, six weeks before the first-light observation of eROSITA. Results from the monitoring and older archival XMM-Newton observations of SN 1987A are presented in Haberl et al. (2006); Heng et al. (2008); Sturm et al. (2010), and Maggi et al. (2012, 2016). Maggi et al. followed the evolution of SN 1987A until December 2012. The details of all XMM-Newton observations are summarized in Table 1. Only observations with EPIC-pn in full-frame mode were used for this work. We did not use Obsid 0831810101 from 2019 November 27 because the observation was performed with EPIC-pn in large-window mode, which might introduce systematic flux differences.
SN 1987A was observed by eROSITA during the commissioning phase and during the first-light observational campaign (Predehl et al. 2021). A summary of the observations can be found in Table 2. During the commissioning observation, only the cameras of telescope modules (TMs) 3 and 4 were switched on and observed the sky, while during first light, all cameras were active.
3 Data reduction and spectral analysis
3.1 XMM-Newton
XMM-Newton /EPIC (see Strüder et al. 2001; Turner et al. 2001, for pn and MOS, respectively) data were processed using the latest XMM-Newton data analysis software SAS, version 18.0.01. The observations were inspected for high background flaring activity by extracting the high-energy light curves (7.0 keV < E < 15 keV for EPIC-pn) with a bin size of 100 s. Event extraction was performed with the SAS task evselect using the standard filtering flags (#XMMEA_EP) for EPIC-pn. We extracted the spectra from the EPIC-pn data of all observations since 2007 (Table 1) in a consistent way (common to all observations) with the same extraction regions around source (circle with 30” radius) and background (nearby circle with same radius) and using single-pixel events (PATTERN = 0), which have the best energy resolution.
To obtain the most recent picture of the spectral evolution of SN 1987A, we followed the approach described in Maggi et al. (2012, and references therein). As spectral model we used the same three-component plane-parallel shock model as Maggi et al. (2012), which was originally used by Dewey et al. (2012) for Chandra and XMM-Newton spectra with a fixed-temperature warm component (kT = 1.15 keV).
The spectra were fitted simultaneously in the energy range of 0.2−10keV with the three-temperature shock model (vpshock with NEI version 3.0.4 in XSPEC version 12.11.0k). The temperatures of the cooler and hot components were allowed to vary between epochs, while parameters such as elemental abundances (N, O, Ne, Mg, Si, S, and Fe) were fitted in common to the spectra and tied between the different shock components. The redshift was fixed to a value of 285.4km s−1, as in the previous works. The normalisations of all shock components were free for all spectra. Two more free parameters were removed by constraining the ionisation ages to cover a factor of 2  similar to Dewey et al. (2012). In order to account for the photo-electric absorption, we included two XSPEC model components phabs and vphabs. The first,
  , was fixed to the value of 6 × 1020 cm−2 (Dickey & Lockman 1990, corresponding to Galactic foreground absorption), and a second component was added to take the absorption inside the LMC into account. In the case of the second component, the metal abundances were fixed to 0.5 of the solar value (van den Heuvel et al. 1992, average metallicity in the LMC). The NH was tied between the different spectra. We also included a Gaussian component to fit the Fe Kα line in the spectra, with the line centroid energies and normalisations left free. The Fe K complex, itself a sum of several ionisation states of iron, is well reproduced by essentially only the hot component (see Fig. 2 with individual components shown). The origin of the Fe line complex in SN 1987A and its possible implications for the Fe abundance of the shocked plasma have been discussed previously in Sturm et al. (2010), Maggi et al. (2012), and Alp et al. (2021). However, we do not report these results in this work and leave it for a future detailed analysis. The errors are quoted at 90% confidence throughout the paper. The upper limits are quoted at 3σ confidence.
Details of the XMM-Newton EPIC-pn observations.
ROSITA observations of SN 1987A.
3.2 eROSITA
The data were reduced with a pipeline based on the eROSITA Standard Analysis Software System (eSASS, Brunner et al. 2022). We used data of the processing configuration c001, which determines good time intervals, corrupted events and frames, and dead times, masks bad pixels, and applies pattern recognition and energy calibration. Finally, star-tracker and gyro data were used to assign celestial coordinates to each reconstructed X-ray photon. Circular regions with a radius of 75” and 100” were used for the source and background extraction, respectively. We rebinned the spectra to a minimum of 20 counts per bin in order to allow the use of the χ2-statistic. We extracted eROSITA spectra from SN 1987A from the available TMs from the calibrated event files using srctool with standard parameters suitable for point-source extraction. The background region was selected to be consistent with that chosen for the spectral analysis of the XMM-Newton EPIC-pn spectra obtained from our monitoring program since 2007 (see Table 1). For EPIC-pn, we selected single-pixel events (PAT = 1), which provide the best energy resolution. However, given the smaller pixel size of the eROSITA CCDs, the fraction of single-pixel events is reduced, and we therefore also created spectra using all valid pixel-patterns (PAT = 15) to use maximum statistics. For the spectral analysis, we used only TM1, 2, 3, 4, and 6, which are equipped with cameras with on-chip optical blocking filters.
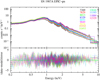 |
Fig. 1 EPIC-pn spectra from 13 monitoring observations of SN 1987A since 2007. The observation epochs (in days after the explosion) are marked in the figure, see Table 2 for details. The spectra have been rebinned for visual clarity. |
4 Results
4.1 Simultaneous fitting of EPIC-pn spectra from XMM-Newton monitoring observations
EPIC-pn spectra with their best-fit models from the 13 monitoring observations of SN 1987A from 2007 to 2020 are shown in Fig. 1. Figure 2 shows the comparison between the EPIC-pn spectra from two different epochs. In 2012, epoch 9424 days (left; where the cooler plasma component dominates), and the most recent epoch from 2020, 12 329 days (right; where the warm and hot plasma components begin to dominate the cooler component). The two epochs demonstrate that the flux and spectrum of SN 1987A have evolved significantly in the past few years. The observed fluxes in the standard 0.5−2keV and 3−10 keV band for each epoch are tabulated in Table 1. The elemental abundances of SN1987A averaged over the epochs are provided in Table 3. Spectral parameters of the three-temperature shock model from EPIC-pn epochs 2007 and 2019 are listed in Table 4. The fitted elemental abundances for SN 1987A are slightly higher than obtained from Chandra HETG/LETG observations (e.g. Zhekov et al. 2009; Bray et al. 2020). The obtained range broadly agrees with the reported values in Mattila et al. (2010); Sturm et al. (2010), and Dewey et al. (2012), however. This is further discussed in Sect. 5.
We also investigated the possible temporal evolution of the post-shock temperatures of the cooler and hot plasma components, their normalisations and the upper limit of the ionisation timescales of the warm component (left free in the fit, as described in Sect. 3.1), as shown in Figs. 3 and 4.
Furthermore, in order to investigate possible differences in the elemental abundances between the three plasma components or their evolution with time, we performed several tests. First, we decoupled the abundances of the cooler, warm, and hot plasma components separately (to avoid too many free parameters that would ensue if we were to decouple all three components at the same time). Setting the cooler, warm, and hot plasma components free resulted in improvements of Δχ2 = 242, 130 and 384 for 6 degrees of freedom, respectively, indicating that the chemical composition of the hot component is most significantly different from the cooler and warm plasma components. The abundance of N could not be constrained for the warm and hot plasma components and was coupled in all cases. The fitted elemental abundances in all three cases are listed in Table 5 and clearly show a trend of higher abundances for the warm and especially the hot gas component. Furthermore, as the relative contribution of the three plasma components with respect to the total emission evolves with time between the epochs (Fig. 4), we also fitted the elemental abundances in two groups corresponding to group 1 from 2007−2015, when the shocked plasma from the dense equatorial ring dominated, and group 2 from 2016−2020, when the warm and hot plasma components began to dominate. The results are compared to the average abundances in Table 3. The elemental abundance of N is significantly lower in the latest epoch, when the abundances of Ne and Mg increase marginally. No clear inference on the other elements can be drawn from this exercise.
Because of the long exposure that is available with EPIC-pn monitoring observations of SN 1987A for over a decade, we further tested whether a two-component shock model could be statistically ruled out in favour of the three-component model used in this work. For this purpose, we fitted all the EPIC-pn spectra simultaneously with only two VPSHOCK components. The ionisation timescales were left free for both, only the abundances were tied between the two components. The two-component fit results in a χ2 of 11860.9, to be compared with 11211.6 in case of the three-component model (used in this work). Both models have the same number of 9346 degrees of freedom due to the tied parameters in the latter case. This indicates that the three-component plane-parallel shock model used in this work is favoured by the data and further supports the findings of Dewey et al. (2012), who originally proposed the three-temperature shock model as they found a slightly better fit over a two-temperature model using the XMM-Newton RGS and Chandra HETG grating instruments. Multi-temperature component models merely approximate a continuous distribution of temperatures in the plasma (Orlando et al. 2015). However, it is clear that our X-ray data require the inclusion of this third hot component.
We also searched for an additional non-thermal emission from either a putative pulsar wind nebula or from synchrotron radiation (Greco et al. 2021). To do this, we added a power-law component with index fixed at 2.0. The addition of the component does not lead to an improvement in the delta χ2 indicating that the addition of this model is not statistically significant. The 3σ upper limit on the 3.0−10.0 keV flux contributed by the power-law component is 1.9 × 10⁻¹⁵ erg cm−2 s−1. This is three orders of magnitudes lower than the flux obtained by Greco et al. (2021) for a possible pulsar wind nebula (F(1− 10 keV) = 10−12 erg cm−2 s−1), assuming a model consisting of only two thermal-emission components and a power-law component. However, it should be noted that Greco et al. (2021) cited significant absorption of this component in the surrounding cold ejecta, with an equivalent H column density of ≳23 cm−2, and the existence of a non-thermal emission cannot be conclusively ruled out using XMM-Newton alone. Similarly, addition of a very hot thermal component with kT = 20 keV is not favoured by the spectral fit, and the upper limit to the 3.0−10.0 keV flux is 9 × 10⁻¹⁴ erg cm−2 s−1.
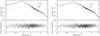 |
Fig. 2 EPIC-pn spectra from day 9424, Obsid 0690510101 (left) and day 12329, Obsid 0862920201 (right), showing the different model components: cooler (red), warm (green), and hot (black). |
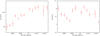 |
Fig. 3 Evolution of the post-shock temperatures kT1 of the cooler (left) and kT3 hot (right) plasma components obtained from the EPIC-pn monitoring of SN 1987A. |
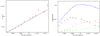 |
Fig. 4 Evolution of the upper limit of the ionisation timescale τu,2 of the warm plasma component (left) and the VPSHOCK normalisations of SN 1987A obtained from the EPIC-pn monitoring (right). Black, red, and green symbols show the norm1, norm2, and norm3 components denoting the emission measures as defined in Table 4. The blue line marks the sum of the three components. |
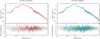 |
Fig. 5 Left: eROSITA spectra (TM3, TM4) from the commissioning observation 700016 with the best-fit model obtained from the combined fit (PAT = 15). Right: same for the first-light observation 700161. The spectra from TM1, 2, 3, 4, and 6 were fit simultaneously. |
4.2 eROSITA spectra and simultaneous fitting of EPIC-pn 2019, eROSITA Comm, and eROSITA FL spectra
The eROSITA spectra were fitted with the model used for the EPIC-pn 2019 observation, with elemental abundances, normalisations, and the ionisation timescales as free parameters, but again linked between the different eROSITA spectra. As a first exercise, we fitted the eROSITA spectra from the two observations (eROSITA Comm and eROSITA FL) separately. Only an inter-calibration constant was allowed to take a possible difference in the normalisations between the different TMs into account (which might be caused by problems in the derivation of good time intervals (GTIs) at this early stage of data analysis, for example). The best-fit spectral parameters for the two observations are given in Tables 4 and 6. The spectra from the two observations extracted using all valid-pattern events (PAT = 15) are shown in Fig. 5. Next, we also fitted all the eROSITA spectra from the two observations simultaneously and verified that the spectral fits resulted in reasonable values of spectral parameters and flux estimates between the different TMs.
The eROSITA spectra from the two observations were finally fitted jointly with the EPIC-pn spectrum from the 2019 observation, which was performed six weeks before the eROSITA FL observation. The spectra with best-fit model are shown in Fig. 6, and the best-fit parameters are also listed in Tables 4 and 6. The fluxes in the 0.5−2 keV and 3−10 keV band for each eROSITA observation and TM are summarised in Table 7. The difference in flux between the individual TMs reflects the inter-calibration constants between the different telescope modules in the two observations. Fluxes obtained from the eROSITA data and the 2019 XMM-Newton EPIC-pn data agree within 4% and 7% in the energy range of 0.5−2 keV for all-valid and single-pixel events, respectively. The corresponding values in the energy range of 3-10keV are 10% and 3%. The difference in fluxes obtained between the different TMs is ~4% and point to the level of systematics in the averaged flux value from eROSITA used to trace the flux evolution of SN 1987A in Sect. 4.3. The fluxes obtained from the eROSITA spectra using valid-pattern and single-pixel events disagree. This is caused by inconsistencies in pattern-fractions and is an eROSITA calibration issue that is currently (April 2021) under investigation. The model parameters predict a slightly lower post-shock temperature kT3, and a slightly higher upper limit of the ionisation ages than inferred from the EPIC-pn 2019 observation alone. The elemental abundances of Ne, Si, and S are also slightly higher than derived from EPIC-pn spectra. The spectral parameters obtained by the joint fit of the eROSITA and EPIC-pn spectra broadly agree with the parameters obtained from the EPIC-pn 2019 spectrum, however.
We also tested the statistical significance of the third thermal component in the three-component shock model using the eROSITA data. We fitted the seven spectra obtained from the eROSITA Comm and FL observations with only two VPSHOCK components as in the case of XMM-Newton EPIC-pn. The two-component fit results in a χ2 of 2417.6, to be compared with 2390.8 in case of the three-component model for 1941 degrees of freedom. The addition of a power-law component instead of a hot plasma component to the two-component shock model does not lead to any improvement in χ2 (2417.6 for 1935 degrees of freedom). This further supports our claim that the three-component plane-parallel shock model is favoured for the spectral modelling of SN1987A.
Elemental abundances of SN 1987A from XMM-Newton in various epochs.
Best-fit spectral parameters of SN 1987A for 2007 EPIC-pn, 2019 EPIC-pn, eROSITA Comm, eROSITA FL, eROSITA Comm+FL, and combined eROSITA +EPIC-pn 2019 observation with a three-component VPSHOCK model.
Elemental abundances of SN 1987A from XMM-Newton combining all epochs.
Elemental abundances of SN 1987A from eROSITA compared with EPIC-pn 2019 observation.
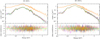 |
Fig. 6 eROSITA spectra (left: single-pixel events, right: PAT = 15) from the combined fit of the commissioning observation 700016 and first-light observation 700161 and 2019 EPIC-pn (orange) spectrum fitted simultaneously. |
Comparison of observed fluxes between the different eROSITA telescope modules using all valid patterns with the best-fit spectral model (obtained by varying the best-fit spectrum for EPIC-pn).
4.3 Flux evolution of SN 1987A
In order to trace the flux evolution of SN 1987A, the three-temperature shock model described in Sect. 3.1 was used because it provides an acceptable fit to the data. With the observed fluxes obtained from the spectral fits, the long-term X-ray flux evolution of SN 1987A in the soft (0.5−2 keV) and hard (3−10 keV) X-ray bands is shown in Fig. 7, including the archival results from ROSAT reported by Beuermann et al. (1994) and Hasinger et al. (1996). A flattening and then turnover of the soft X-ray flux is observed between days 10 142 and 10 493, followed by a steady decline. However, the hard X-ray flux continues to increase, but at a slower rate. A comparison between the flux obtained with 2019 EPIC-pn and the eROSITA observations is also marked in the figure. The error-weighted average flux obtained using only single-pixel patterns (PAT = 1) from eROSITA is systematically lower than obtained with EPIC-pn. On the other hand, the corresponding flux obtained using all valid patterns (PAT = 15) from eROSITA is slightly higher than obtained with EPIC-pn. Because the lower fraction of single-pixel events is largely compensated for by a higher fraction of double-pixel events, the eROSITA fluxes derived from all valid patterns are likely more reliable. See Tables 1 and 7 for the flux values.
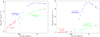 |
Fig. 7 X-ray light curve of SN 1987A in logarithmic (left) and linear scale (right). eROSITA fluxes are the error-weighted average flux derived from the simultaneous fit to the spectra of the commissioning and the first-light observation. Fluxes derived from single-pixel events are somewhat below the EPIC-pn values, while PAT15 events give higher fluxes. |
5 Discussion
This paper reports the most complete and most recent flux evolution of SN 1987A in X-rays starting from 1991 using ROSAT (1448 days after the explosion, when the source became first visible in soft X-rays) up to November 2020 (12 329 days after explosion) using XMM-Newton and eROSITA observations during its commissioning phase and first light. The XMM-Newton observations are part of a monitoring campaign since 2007 and were presented up to 2012 in Haberl et al. (2006), Heng et al. (2008), Sturm et al. (2010), and Maggi et al. (2012, Maggi et al. 2016). An additional XMM-Newton observation to allow cross-calibration studies between XMM-Newton and eROSITA was performed in September 2019. Another observation from November 2019 (not used in this work; see Sect. 2) was presented in Alp et al. (2021) and Sun et al. (2021). We used the EPIC-pn monitoring observations to trace a possible temporal evolution of the different shocked plasma components and their elemental abundances over the past 14yr. Our analysis demonstrates that a three-temperature (cooler, warm, and hot) shock model is statistically favoured over a two-temperature model, in line with the findings first reported in Zhekov et al. (2010), Dewey et al. (2012) and thereafter used in Maggi et al. (2012) and recently in Alp et al. (2021), with slightly different temperatures for the shock components, especially the cooler component. No evidence of an additional non-thermal component is found in the spectrum of SN 1987A, consistent with the analysis of the joint XMM-Newton and NuSTAR observations by Alp et al. (2021).
5.1 Clear trend of continued flux decline in the soft X-ray band and comparison of fluxes between XMM-Newton and eROSITA
The X-ray light curve of SN 1987A in the 0.5−2 keV band flattened around 9424 days (2012 EPIC-pn) and then displayed a turnover between 10 142−10493 days (2014−2015 EPIC-pn). Around the same time, a break is visible in the slope of the increasing hard-band flux (3−10 keV). Thereafter, while the soft-band flux has shown a continuous decline up to the last XMM-Newton monitoring observation in November 2020, the hard-band flux has continued to increase, but with a flatter slope. The described trend in the fluxes between the soft and the hard band implies that the blast wave has now passed beyond the dense structures of the equatorial ring and is expanding farther into a more tenuous CSM. The measured soft-band flux from 12329 days (Nov. 2020) indicates that the flux has dropped to ~6.2 × 10⁻¹² erg cm−2 s−1, which is 18% below the maximum value measured on 9424 days (2012). The recent flux evolution confirms that the flux levels off in the soft-band light curve around 9000 days, as reported in Frank et al. (2016), and clearly demonstrates the continued flux decline.
An additional aim of the 2019 EPIC-pn observation was to allow cross-calibration studies between XMM-Newton and the early eROSITA observations of SN 1987A performed in September and October 2019. The eROSITA fluxes (which are the error-weighted average flux derived from the simultaneous fit to the spectra of the commissioning and the first-light observation) agree with the 2019 EPIC-pn fluxes within 4% and 7% in the energy range of 0.5−2 keV for all-valid and single-pixel events, respectively. The corresponding values are 10% and 3% in the energy range of 3−10 keV. The discrepancy between the eROSITA fluxes obtained using the valid-pattern and singlepixel events is caused by inconsistencies in pattern fractions, as discussed in Sect. 4.2.
5.2 Origin and temporal evolution of the plasma components in SN 1987A
The physical origin of the different plasma components in SN 1987A is complicated due to the complex CSM structure and the shock interactions. The likely origin of the thermal X-ray emission includes the dense clumps of the equatorial ring, the lower-density inter-clump gas (also including the destroyed or evaporated clumps), an ionised HII region surrounding the ring, as well as reflected shock-heated gas from the equatorial ring region and the reverse shock moving into the ejecta. Previous studies that were based on X-ray data at the peak of the interaction of the blast wave with the dense equatorial ring attributed the low-temperature plasma to the interaction of the blast wave with the dense equatorial ring and the higher-temperature components to the emission from the inter-clump gas, from the surrounding HII regions as well as from the reflected shocks (Park et al. 2006; Zhekov et al. 2010; Dewey et al. 2012). However, in the recent epochs that are included in our analysis, the emission component from the reverse shock moving into the ejecta is expected to have a growing contribution to the hard X-ray emission modelled by the hot plasma component. This is corroborated by recent hydrodynamical simulations, which indicate that the X-ray emission from SN 1987A will start to be dominated by the SN ejecta heated by the reverse shock in 32−34 yr after the explosion (Orlando et al. 2015; Bray et al. 2020). In this work, we attribute the cooler, warm, and hot components of the three-temperature VPSHOCK model to trace the emission caused by the blast-wave shock transmitted into dense gas of the circumstellar ring including the inter-clump gas, the blast wave propagating in the low-density CSM/HII region, and the reverse shock evolving into the ejecta, respectively. Our motivation for the origin of the plasma components is mainly driven by the evidence of a different chemical composition of the warm and hot plasma components, especially O, Ne, Mg, and Si. This is discussed further in Sect. 5.3.
The temporal evolution of the spectral parameters of the three plasma components in SN 1987A is plotted in Figs. 3 and 4. A gradual increase in the electron temperature of the cooler component is observed up to 11193 days. This has been reported previously for the epochs 2003−2007 using Chandra observations (Park et al. 2006) and XMM-Newton RGS observations (Sturm et al. 2010). The increasing trend can be explained if regions with slightly higher temperatures contributed more to the emission measure at later epochs, for instance if the emission were dominated by the shocked dense clumps at the beginning, but was increasingly overtaken by the lower-density gas inside the circumstellar ring with time, which might constitute both the inter-clump gas and the evaporated clump material. No clear trend in the electron temperature of the hot component can be inferred.
A gradual increase in shock ionisation age is seen, as expected if the blast wave encounters gas of increasing density as it propagates into the circumstellar ring structure. It seems to increase also after 11 193 days, most likely because of the evaporation of clumps in the ring as well as the evolution of the reverse shock. A linear fit to the upper limit of the ionisation timescale from 7269 to 12 329 days leads to an average density of 3577±143 cm−3 for the cooler plasma component. This is consistent with what was found by Sturm et al. (2009) based in the first three XMM-Newton observations in Table 1. This value is also in line with the estimates obtained from early optical analysis of the ionised gas, which predicted a density of 1−3 × 104 cm−3 for the clumps and a density of 1−6 × 103 cm−3 for the inter-clump gas (Lundqvist & Fransson 1996) and from hydrodynamical simulations (Orlando et al. 2015). The obtained density range further suggests that the cooler plasma component is dominated by the inter-clump gas. However, we would like to add a note of caution that the estimate of the density is derived from the vpshock model, which assumes an adia-batic, one-dimensional plasma shock propagating into a uniform CSM, which is an oversimplified picture in the case of the dense equatorial ring.
The normalisations norm1, norm2, and norm3 of the cooler, warm, and hot components of the VPSHOCK model trace the emission caused by the blast-wave shock transmitted into the dense equatorial ring gas, the blast wave propagating in the CSM, and the reverse shock evolving into the ejecta, respectively. The contribution of norm2 increases with time, but shows indications of flattening after 11193 days. Comparison with the hydrodynam-ical simulation and synthetic light curves to predict the SNR evolution from Orlando et al. (2020) shows that the observations match the scenario of a remnant evolution for a blue supergiant progenitor well. The increasing contribution of norm3 in the recent years, while norm2 stays constant and norm1 decreases may reflect the fact that the emission caused by the forward shock is leaving the equatorial ring and the reverse shock in the ejecta is becoming more dominant. This is in support of the origin of the hot plasma component as the reverse-shock emission component.
We verified that the time evolution of the parameters is not affected by the assumption of fixing kT2 = 1.15 keV in our spectral model. In order to test this, we repeated the exercise with fixing kT2 = 1.0 keV and kT2 = 1.3 keV. A marginal increase in both kT1 and kT3 and a corresponding decrease in ru is seen with increasing kT2 from 1.0 to 1.1 to 1.3 keV. No change in the normalisation values are detected within the errors. More importantly, the pattern in the evolution of the parameters remains the same in all cases, establishing that the time evolution does not depend on the exact choice of kT2. This has also been confirmed previously by Dewey et al. (2012), who found that the exact choice of the middle temperature is somewhat arbitrary and degenerate with other parameters. We further caution that the ionisation ages are tied to each other to cover a factor of 2, and this could lead to some systematics in some parameter estimates, especially the density of the plasma components.
5.3 Elemental abundances
The elemental abundances of the different plasma components were studied by setting the abundances of the warm and hot plasma component free with respect to the cooler component. The simultaneous fit from EPIC-pn favours a higher abundance for the warm and hot components (especially the hot component and for the elements O, Ne, Mg, and Si). A time evolution of the elemental abundance was also explored by dividing the data into two groups: before the X-ray emission was dominated by the shocked plasma from the dense equatorial ring (2007-2015), and after (2016-2020). The data show evidence of a lower abundance of N at the later epoch, together with a marginal increase in the abundance of Ne and Mg. No other clear trend can be seen. However, we note that the elemental abundances determined in epoch 2016−2020 are time-averaged over the three plasma components and the contribution of the hot plasma (which is indicated to have the highest abundances) became dominant in the observation of the latest epoch 12 329 days, as seen in Fig. 4. Bray et al. (2020) obtained elemental abundances of Ne = 0.4, Mg = 0.34, Si = 0.4, S = 0.34, and Fe = 0.16 from Chandra HETG/LEG. The latest XMM-Newton study by Sun et al. (2021) yields slightly higher abundances and also indicates that the elemental abundances have decreased in the latest epochs. While the analysis of Bray et al. (2020) was limited to softer energies below 3.0keV, Sun et al. (2021) analysed the RGS and EPIC data together, but assumed a model consisting of two thermal emission components. Therefore these studies miss the emission from the hottest component, which is likely caused by the reverse shock propagating into the ejecta. This is the component for which we therefore expect higher element abundances. Future analysis including the grating spectra will be important to confirm these results.
Our analysis of the XMM-Newton EPIC and eROSITA spectra by decoupling the element abundances of the warm or hot component (Table 5) shows that the abundances for the cool and warm component are consistent with those obtained from the grating spectra when the abundances in the hot component are left free. Moreover, the abundances in the hot component are significantly higher in that case, supporting the ejecta scenario. Iron is the exception, with a low abundance. This can be expected if the reverse shock has not yet reached and heated the inner ejecta, which contains the outer layer of iron that escaped fall-back on the newly born neutron star. In this scenario, we predict that the abundance of Fe (and other heavier elements such as Si and S) in the hot component will rise in future observations.
6 Conclusions
SN 1987A has shown dramatic evolution in the X-ray spectrum and flux over the past ~15yr. The soft-band flux after 10142−10 493 days shows a continued decline and has decreased by 18% of its peak value in November 2020. The X-ray emission caused by the forward shock after traversing the equatorial ring and by the reverse shock in the ejecta is becoming more dominant, and the SNR has entered a new evolutionary phase. During its ongoing all-sky surveys, SRG/eROSITA will continue to monitor SN 1987A. This will provide crucial information about the new evolutionary phase of the supernova remnant. Changes in the emission from the forward and reverse shocks as well as in abundances and NH are expected and will be followed with SRG/eROSITA in the next years. This will be complemented by our continued monitoring of the source with EPIC-pn.
Acknowledgments
Acknowledgements. We thank the referee for a very thorough and critical reviewing of the manuscript which helped in considerably improving the clarity of the paper. This work is based on data from eROSITA, the primary instrument aboard SRG, a joint Russian-German science mission supported by the Russian Space Agency (Roskosmos), in the interests of the Russian Academy of Sciences represented by its Space Research Institute (IKI), and the Deutsches Zentrum für Luft- und Raumfahrt (DLR). The SRG spacecraft was built by Lavochkin Association (NPOL) and its subcontractors, and is operated by NPOL with support from the Max Planck Institute for Extraterrestrial Physics (MPE). The development and construction of the eROSITA X-ray instrument was led by MPE, with contributions from the Dr. Karl Remeis Observatory Bamberg & ECAP (FAU Erlangen-Nürnberg), the University of Hamburg Observatory, the Leibniz Institute for Astrophysics Potsdam (AIP), and the Institute for Astronomy and Astrophysics of the University of Tübingen, with the support of DLR and the Max Planck Society. The Argelander Institute for Astronomy of the University of Bonn and the Ludwig Maximilians Universität Munich also participated in the science preparation for eROSITA. The eROSITA data shown here were processed using the eSASS/NRTA software system developed by the German eROSITA consortium. The eROSITA data shown here were processed using the eSASS software system developed by the German eROSITA consortium. M.S. acknowledges support by the Deutsche Forschungs-gemeinschaft through the Heisenberg professor grant SA 2131/12-1.
References
- Alp, D., Larsson, J., & Fransson, C. 2021, ApJ, 916, 76 [NASA ADS] [CrossRef] [Google Scholar]
- Beuermann, K., Brandt, S., & Pietsch, W. 1994, A&A, 281, L45 [NASA ADS] [Google Scholar]
- Bray, E., Burrows, D. N., Park, S., & Ravi, A. P. 2020, ApJ, 899, 21 [NASA ADS] [CrossRef] [Google Scholar]
- Brunner, H., Liu, T., Lamer, G., et al. 2022, A&A, 661, A1 (eROSITA EDR SI) [NASA ADS] [CrossRef] [EDP Sciences] [Google Scholar]
- Chita, S. M., Langer, N., van Marle, A. J., García-Segura, G., & Heger, A. 2008, A&A, 488, L37 [NASA ADS] [CrossRef] [EDP Sciences] [Google Scholar]
- Dewey, D., Dwarkadas, V. V., Haberl, F., Sturm, R., & Canizares, C. R. 2012, ApJ, 752, 103 [NASA ADS] [CrossRef] [Google Scholar]
- Dickey, J. M., & Lockman, F. J. 1990, ARA&A, 28, 215 [Google Scholar]
- Frank, K. A., Zhekov, S. A., Park, S., et al. 2016, ApJ, 829, 40 [Google Scholar]
- Fransson, C., Larsson, J., Migotto, K., et al. 2015, ApJ, 806, L19 [NASA ADS] [CrossRef] [Google Scholar]
- Greco, E., Miceli, M., Orlando, S., et al. 2021, ApJ, 908, L45 [NASA ADS] [CrossRef] [Google Scholar]
- Haberl, F., Geppert, U., Aschenbach, B., & Hasinger, G. 2006, A&A, 460, 811 [NASA ADS] [CrossRef] [EDP Sciences] [Google Scholar]
- Hasinger, G., Aschenbach, B., & Trümper, J. 1996, A&A, 312, L9 [NASA ADS] [Google Scholar]
- Heng, K., Haberl, F., Aschenbach, B., & Hasinger, G. 2008, ApJ, 676, 361 [NASA ADS] [CrossRef] [Google Scholar]
- Larsson, J., Fransson, C., Alp, D., et al. 2019, ApJ, 886, 147 [NASA ADS] [CrossRef] [Google Scholar]
- Lundqvist, P., & Fransson, C. 1996, ApJ, 464, 924 [NASA ADS] [CrossRef] [Google Scholar]
- Maggi, P., Haberl, F., Sturm, R., & Dewey, D. 2012, A&A, 548, L3 [NASA ADS] [CrossRef] [EDP Sciences] [Google Scholar]
- Maggi, P., Haberl, F., Kavanagh, P. J., et al. 2016, A&A, 585, A162 [NASA ADS] [CrossRef] [EDP Sciences] [Google Scholar]
- Mattila, S., Lundqvist, P., Gröningsson, P., et al. 2010, ApJ, 717, 1140 [NASA ADS] [CrossRef] [Google Scholar]
- McCray, R., & Fransson, C. 2016, ARA&A, 54, 19 [NASA ADS] [CrossRef] [Google Scholar]
- Morris, T., & Podsiadlowski, P. 2007, Science, 315, 1103 [Google Scholar]
- Orlando, S., Miceli, M., Pumo, M. L., & Bocchino, F. 2015, ApJ, 810, 168 [NASA ADS] [CrossRef] [Google Scholar]
- Orlando, S., Ono, M., Nagataki, S., et al. 2020, A&A, 636, A22 [NASA ADS] [CrossRef] [EDP Sciences] [Google Scholar]
- Panagia, N. 1999, in New Views of the Magellanic Clouds, eds. Y. H. Chu, N. Suntzeff, J. Hesser, & D. Bohlender, 190, 549 [NASA ADS] [Google Scholar]
- Park, S., Zhekov, S. A., Burrows, D. N., & McCray, R. 2005, ApJ, 634, L73 [NASA ADS] [CrossRef] [Google Scholar]
- Park, S., Zhekov, S. A., Burrows, D. N., et al. 2006, ApJ, 646, 1001 [NASA ADS] [CrossRef] [Google Scholar]
- Predehl, P., Andritschke, R., Arefiev, V., et al. 2021, A&A, 647, A1 [EDP Sciences] [Google Scholar]
- Strüder, L., Briel, U., Dennerl, K., et al. 2001, A&A, 365, L18 [Google Scholar]
- Sturm, R., Haberl, F., Hasinger, G., Kenzaki, K., & Itoh, M. 2009, PASJ, 61, 895 [NASA ADS] [Google Scholar]
- Sturm, R., Haberl, F., Aschenbach, B., & Hasinger, G. 2010, A&A, 515, A5 [NASA ADS] [CrossRef] [EDP Sciences] [Google Scholar]
- Sun, L., Vink, J., Chen, Y., et al. 2021, ApJ, 916, 41 [NASA ADS] [CrossRef] [Google Scholar]
- Turner, M. J. L., Abbey, A., Arnaud, M., et al. 2001, A&A, 365, L27 [CrossRef] [EDP Sciences] [Google Scholar]
- van den Heuvel, E. P. J., Bhattacharya, D., Nomoto, K., & Rappaport, S. A. 1992, A&A, 262, 97 [Google Scholar]
- Zhekov, S. A., McCray, R., Borkowski, K. J., Burrows, D. N., & Park, S. 2006, ApJ, 645, 293 [NASA ADS] [CrossRef] [Google Scholar]
- Zhekov, S. A., McCray, R., Dewey, D., et al. 2009, ApJ, 692, 1190 [NASA ADS] [CrossRef] [Google Scholar]
- Zhekov, S. A., Park, S., McCray, R., Racusin, J. L., & Burrows, D. N. 2010, MNRAS, 407, 1157 [NASA ADS] [CrossRef] [Google Scholar]
Science Analysis Software (SAS): https://www.cosmos.esa.int/web/xmm-newton/sas
All Tables
Best-fit spectral parameters of SN 1987A for 2007 EPIC-pn, 2019 EPIC-pn, eROSITA Comm, eROSITA FL, eROSITA Comm+FL, and combined eROSITA +EPIC-pn 2019 observation with a three-component VPSHOCK model.
Elemental abundances of SN 1987A from eROSITA compared with EPIC-pn 2019 observation.
Comparison of observed fluxes between the different eROSITA telescope modules using all valid patterns with the best-fit spectral model (obtained by varying the best-fit spectrum for EPIC-pn).
All Figures
|
Fig. 1 EPIC-pn spectra from 13 monitoring observations of SN 1987A since 2007. The observation epochs (in days after the explosion) are marked in the figure, see Table 2 for details. The spectra have been rebinned for visual clarity. |
| In the text | |
|
Fig. 2 EPIC-pn spectra from day 9424, Obsid 0690510101 (left) and day 12329, Obsid 0862920201 (right), showing the different model components: cooler (red), warm (green), and hot (black). |
| In the text | |
|
Fig. 3 Evolution of the post-shock temperatures kT1 of the cooler (left) and kT3 hot (right) plasma components obtained from the EPIC-pn monitoring of SN 1987A. |
| In the text | |
|
Fig. 4 Evolution of the upper limit of the ionisation timescale τu,2 of the warm plasma component (left) and the VPSHOCK normalisations of SN 1987A obtained from the EPIC-pn monitoring (right). Black, red, and green symbols show the norm1, norm2, and norm3 components denoting the emission measures as defined in Table 4. The blue line marks the sum of the three components. |
| In the text | |
|
Fig. 5 Left: eROSITA spectra (TM3, TM4) from the commissioning observation 700016 with the best-fit model obtained from the combined fit (PAT = 15). Right: same for the first-light observation 700161. The spectra from TM1, 2, 3, 4, and 6 were fit simultaneously. |
| In the text | |
|
Fig. 6 eROSITA spectra (left: single-pixel events, right: PAT = 15) from the combined fit of the commissioning observation 700016 and first-light observation 700161 and 2019 EPIC-pn (orange) spectrum fitted simultaneously. |
| In the text | |
|
Fig. 7 X-ray light curve of SN 1987A in logarithmic (left) and linear scale (right). eROSITA fluxes are the error-weighted average flux derived from the simultaneous fit to the spectra of the commissioning and the first-light observation. Fluxes derived from single-pixel events are somewhat below the EPIC-pn values, while PAT15 events give higher fluxes. |
| In the text | |
Current usage metrics show cumulative count of Article Views (full-text article views including HTML views, PDF and ePub downloads, according to the available data) and Abstracts Views on Vision4Press platform.
Data correspond to usage on the plateform after 2015. The current usage metrics is available 48-96 hours after online publication and is updated daily on week days.
Initial download of the metrics may take a while.