Fig. 4
Download original image
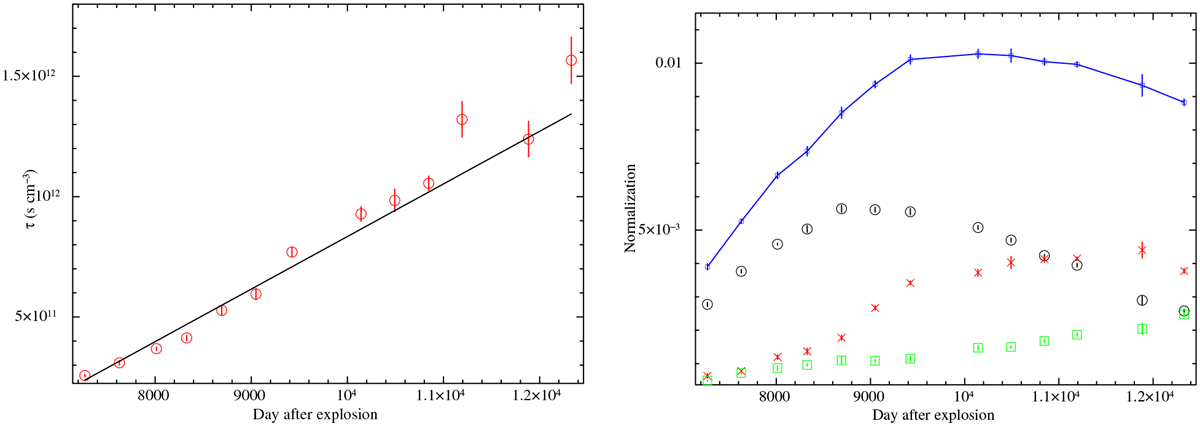
Evolution of the upper limit of the ionisation timescale τu,2 of the warm plasma component (left) and the VPSHOCK normalisations of SN 1987A obtained from the EPIC-pn monitoring (right). Black, red, and green symbols show the norm1, norm2, and norm3 components denoting the emission measures as defined in Table 4. The blue line marks the sum of the three components.
Current usage metrics show cumulative count of Article Views (full-text article views including HTML views, PDF and ePub downloads, according to the available data) and Abstracts Views on Vision4Press platform.
Data correspond to usage on the plateform after 2015. The current usage metrics is available 48-96 hours after online publication and is updated daily on week days.
Initial download of the metrics may take a while.