Fig. 1
Download original image
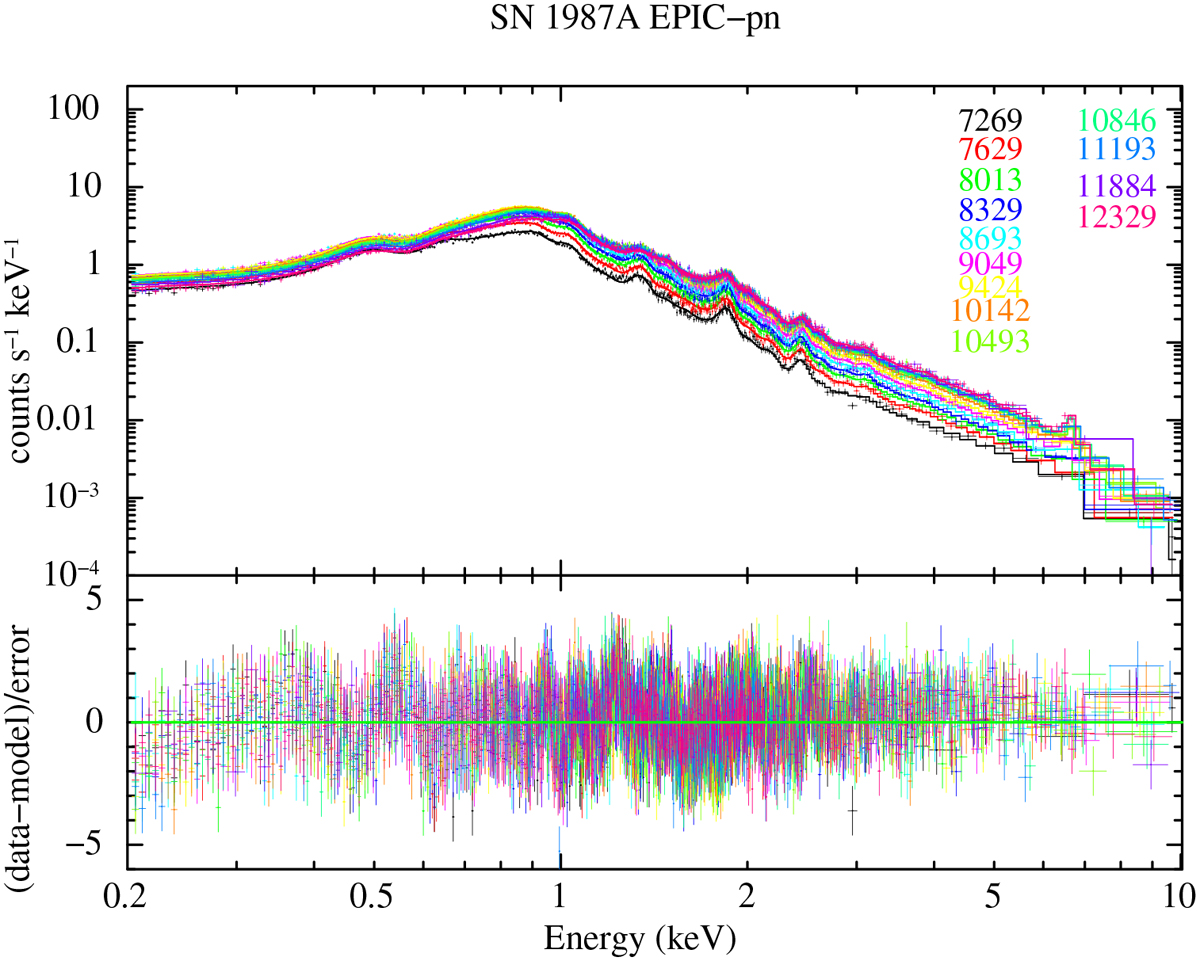
EPIC-pn spectra from 13 monitoring observations of SN 1987A since 2007. The observation epochs (in days after the explosion) are marked in the figure, see Table 2 for details. The spectra have been rebinned for visual clarity.
Current usage metrics show cumulative count of Article Views (full-text article views including HTML views, PDF and ePub downloads, according to the available data) and Abstracts Views on Vision4Press platform.
Data correspond to usage on the plateform after 2015. The current usage metrics is available 48-96 hours after online publication and is updated daily on week days.
Initial download of the metrics may take a while.