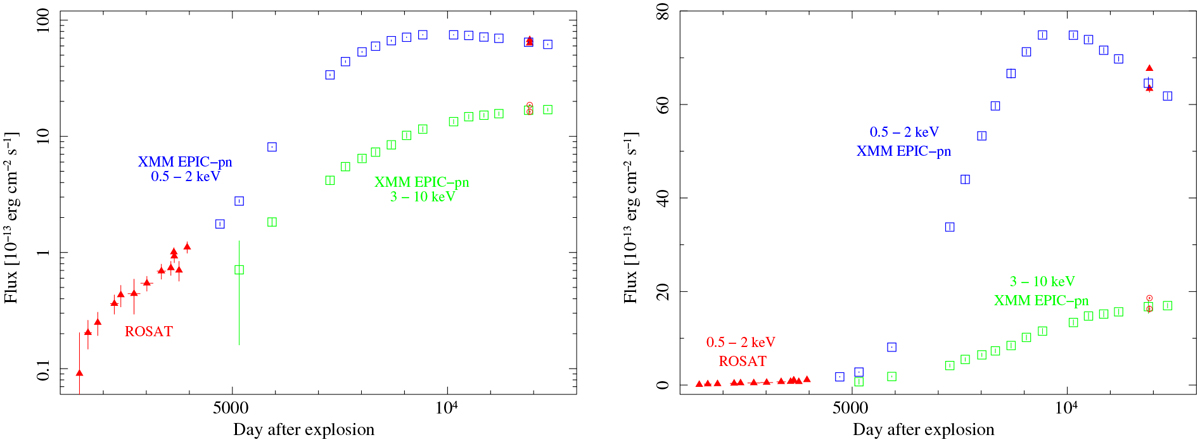
Fig. 7
Download original image
X-ray light curve of SN 1987A in logarithmic (left) and linear scale (right). eROSITA fluxes are the error-weighted average flux derived from the simultaneous fit to the spectra of the commissioning and the first-light observation. Fluxes derived from single-pixel events are somewhat below the EPIC-pn values, while PAT15 events give higher fluxes.
Current usage metrics show cumulative count of Article Views (full-text article views including HTML views, PDF and ePub downloads, according to the available data) and Abstracts Views on Vision4Press platform.
Data correspond to usage on the plateform after 2015. The current usage metrics is available 48-96 hours after online publication and is updated daily on week days.
Initial download of the metrics may take a while.