Fig. 5.
Download original image
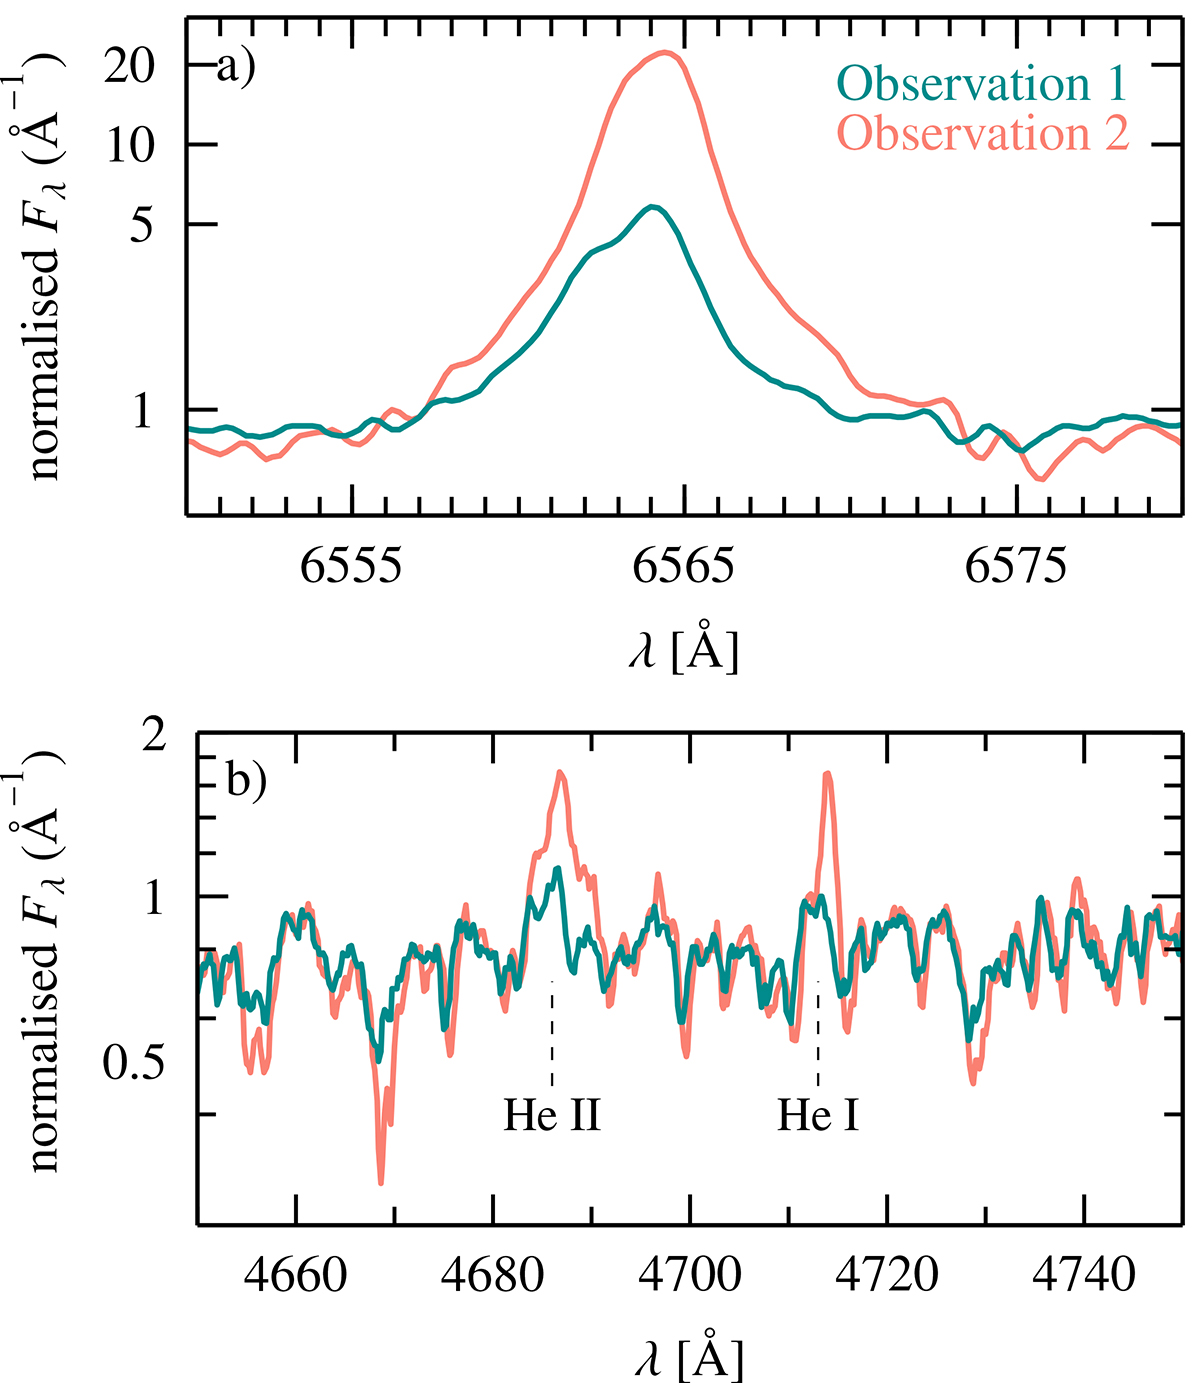
(a) Hα line as seen in both X-shooter spectra, normalised for comparison. The second observation shows a stronger and single-peaked line profile, compared to an asymmetric line profile in the first data set. The asymmetry is likely due to the contribution of He IIλ6560, also being in emission. (b) He IIλ4686 and He Iλ4713 are in emission, in both X-shooter spectra, but without as much variability. We normalised the two spectral continua relative to each other to compare the behaviour of the emission lines.
Current usage metrics show cumulative count of Article Views (full-text article views including HTML views, PDF and ePub downloads, according to the available data) and Abstracts Views on Vision4Press platform.
Data correspond to usage on the plateform after 2015. The current usage metrics is available 48-96 hours after online publication and is updated daily on week days.
Initial download of the metrics may take a while.