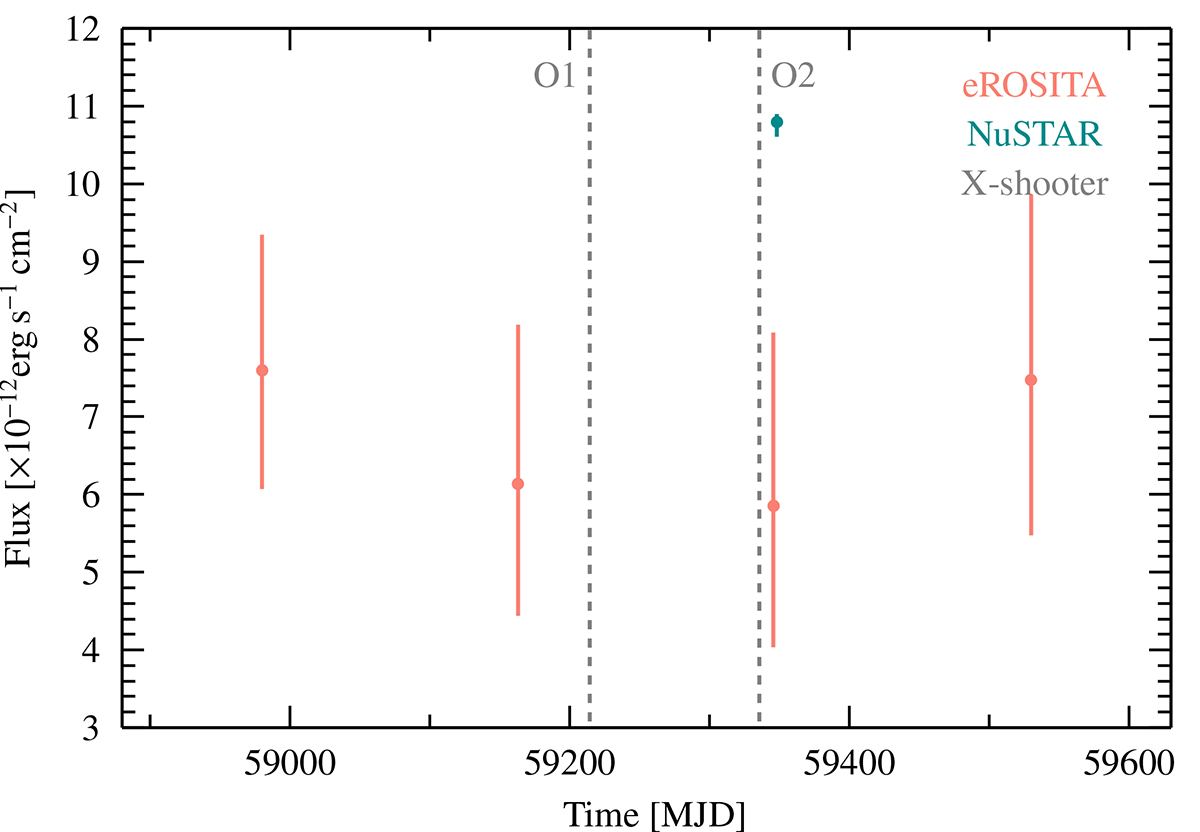
Fig. 2.
Download original image
3–10 keV X-ray flux from each observation of J085039 as a functin of time, corrected for absorption. The eROSITA fluxes are displayed at the start time of each scan. The third eROSITA observation was only four days prior to the pointed NuSTAR observation. The NuSTAR flux is brighter by a factor ∼2, which might indicate slight source-intrinsic variability, even when taking into account eROSITA’s known calibration uncertainties (Migkas et al. 2024). The observation times of the optical observations from X-shooter are marked by gray dashed lines as O1 and O2.
Current usage metrics show cumulative count of Article Views (full-text article views including HTML views, PDF and ePub downloads, according to the available data) and Abstracts Views on Vision4Press platform.
Data correspond to usage on the plateform after 2015. The current usage metrics is available 48-96 hours after online publication and is updated daily on week days.
Initial download of the metrics may take a while.