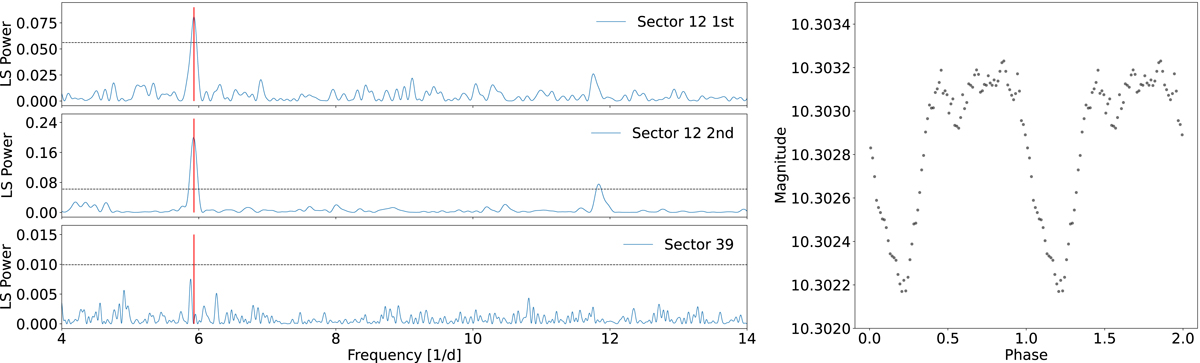
Fig. 4.
Download original image
GLS periodograms of the TESS observations of IGR J16194−2810. The frequency with the highest power is highlighted in red. These periodograms correspond to the first (top) and second (middle) portion of the Sector 12 TESS observations, and to Sector 39 observations (bottom). The horizontal dashed black lines represent 3σ detection probabilities. The right-hand panel shows the light curve folded at the 242.839 min period and binned at 80 bins/cycle.
Current usage metrics show cumulative count of Article Views (full-text article views including HTML views, PDF and ePub downloads, according to the available data) and Abstracts Views on Vision4Press platform.
Data correspond to usage on the plateform after 2015. The current usage metrics is available 48-96 hours after online publication and is updated daily on week days.
Initial download of the metrics may take a while.