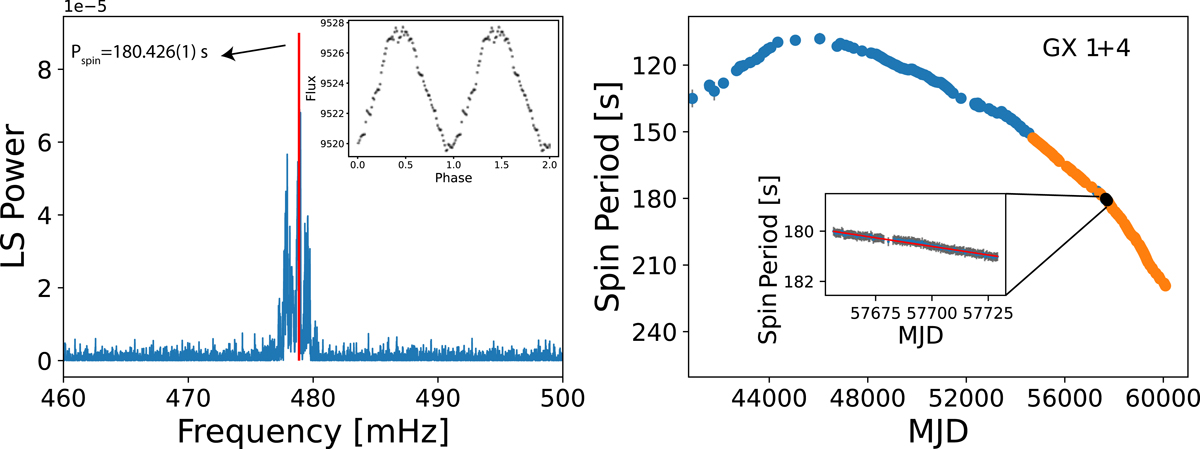
Fig. 3.
Download original image
Period change in GX 1+4. Left: GLS periodogram (blue). The frequency with the highest power is highlighted in red. This periodogram corresponds to the full K2 light curve of GX 1+4. There are other peaks around the main peak, which suggests that the period changed during the observations (see Sect. 3). The inset shows the light curve folded at the 180.426 s period and binned at 80 bins/cycle. Right: historical evolution of the spin period from measurements from various instruments, listed in Table B.1 of González-Galán et al. (2012), such as Rossi X-ray Timing Explorer (RXTE) and Compton Gamma Ray Observatory/Burst And Transient Source Experiment (CGRO/BATSE), among others (see text). Fermi/Gamma-ray Burst Monitor (GBM) measurements are shown as orange symbols, while K2 measurements are shown as black symbols. The inset shows the spin evolution during the K2 observations reported here; the red line shows a simple linear fit to the spin-down trend.
Current usage metrics show cumulative count of Article Views (full-text article views including HTML views, PDF and ePub downloads, according to the available data) and Abstracts Views on Vision4Press platform.
Data correspond to usage on the plateform after 2015. The current usage metrics is available 48-96 hours after online publication and is updated daily on week days.
Initial download of the metrics may take a while.