| Issue |
A&A
Volume 676, August 2023
|
|
|---|---|---|
| Article Number | A61 | |
| Number of page(s) | 12 | |
| Section | Cosmology (including clusters of galaxies) | |
| DOI | https://doi.org/10.1051/0004-6361/202346608 | |
| Published online | 07 August 2023 | |
A VLT/VIMOS view of two Planck multiple-cluster systems: Structure and galaxy properties
1
Université Paris-Saclay, CNRS, Institut d’Astrophysique Spatiale, Bât 120-121 Rue Jean Teillac, 91405 Orsay, France
e-mail: This email address is being protected from spambots. You need JavaScript enabled to view it.
2
University of La Laguna, 38206 Tenerife, Spain; Instituto de Astrofísica de Canarias, 38205 Tenerife, Spain
3
LIENSs – LIttoral ENvironnement et Sociétés, Bâtiment Marie Curie, Avenue Michel Crépeau, 17042 La Rochelle cedex 1 – Bâtiment ILE 2, rue Olympe de Gouges, 17000 La Rochelle, France
4
Laboratoire d’Astrophysique de Marseille, UMR7326 - CNRS-INSU, Université d’Aix-Marseille, 38 rue Frédéric Joliot-Curie, 13388 Marseille cedex 13, France
5
IRAP, Université de Toulouse, CNRS, CNES, UPS, 9 av. du Colonel Roche, BP44346, 31028 Toulouse Cedex 4, France
Received:
6
April
2023
Accepted:
6
June
2023
Abstract
We analysed spectroscopic data obtained with VLT/VIMOS for two multiple-cluster systems, PLCKG214.6+36.9 and PLCKG334.8−38.0, discovered by Planck via their thermal Sunyaev-Zel’dovich signal. Combining the optical spectroscopy for the redshift determination and photometric data from galaxy surveys (SDSS, WISE and DESI), we were able to study the structure of the two multiple-cluster systems to determine their nature and the properties of their member galaxies. We found that the two systems are mainly populated by passive galaxies and that PLCKG214.6 + 36.9 consists of a pair of clusters at redshift z = 0.445 and an isolated cluster in the background at z = 0.498, whereas the system PLCKG334.8 − 38.0 is a chance association of three independent clusters at redshifts of z = 0.367, z = 0.292, and z = 0.33. We also find evidence of remaining star formation activity in the highest redshift cluster of PLCKG214.6 + 36.9, at z = 0.498.
Key words: large-scale structure of Universe / galaxies: clusters: individual: PLCKG214.6+36.9 / galaxies: clusters: individual: PLCKG334.8−38.0 / galaxies: distances and redshifts / galaxies: stellar content
© The Authors 2023
 Open Access article, published by EDP Sciences, under the terms of the Creative Commons Attribution License (https://creativecommons.org/licenses/by/4.0), which permits unrestricted use, distribution, and reproduction in any medium, provided the original work is properly cited.
This article is published in open access under the Subscribe to Open model. This email address is being protected from spambots. You need JavaScript enabled to view it. to support open access publication.
1. Introduction
Galaxy clusters are the largest gravitationally bound structures in the Universe, often found in pairs or in multiple systems that can be identified in galaxy surveys or X-ray observations (e.g., Liivamägi et al. 2012; Chon et al. 2014; Nadathur & Hotchkiss 2014; Bag et al. 2023). These systems are of particular interest as they represent the perfect laboratories for witnessing the formation and evolution of the large-scale structure and its impact on the baryonic matter (galaxies and gas). Indeed, clusters host complex physical processes involving dark matter, gas, and galaxies, including matter infall via filaments, accretion shocks, gas mixing, as well as accretion onto and ejection of matter from galaxies, and so on.
The analysis of multiple-cluster systems offers the possibility to observe and study phenomena that are either rare or difficult to observe in isolated, dynamically relaxed clusters (see e.g., Akamatsu et al. 2017 for the cluster pair Abell 399-Abell 401; Bardelli et al. 1994 and Kull & Böhringer 1999 for the Shapley supercluster; Einasto et al. 2021 for the Corona Borealis supercluster; or Jôeveer et al. 1978 for the Perseus-Pisces supercluster). While in optical and X-ray surveys, multiple cluster systems have long been detected and published in catalogs (e.g., Einasto et al. 1997, 2001), in the (sub)millimeter surveys, it is only with the achievement of the all-sky survey by Planck (Planck Collaboration I 2011) between 30 and 857 GHz that hundreds of clusters of galaxies have been detected via the thermal Sunyaev-Zel’dovich (tSZ) effect (Sunyaev & Zeldovich 1972). These include candidate multiple cluster systems in tSZ (Planck Collaboration Int. VIII 2013; Planck Collaboration IX 2011). The tSZ signal tracing of the electron gas pressure works independently on redshift, allowing for a well-defined quasi-mass selection of clusters. In addition, its sensitivity to pressure makes tSZ a good way to detect interacting or non-relaxed clusters. By comparison, X-ray observations preferentially select clusters with a high electron density in their central regions, leading to samples of more concentrated clusters with respect to the tSZ observations. Discussions on the different populations selected by X-ray and tSZ surveys can be found in Andrade-Santos et al. (2021) or CHEX-MATE Collaboration (2021).
The sources PLCKG214.6 + 36.9 (hereafter PLCK1) and PLCKG334.8−38.0 (hereafter, PLCK2) are the first two triple-cluster systems discovered in the millimetre range as part of the first newly discovered tSZ sources in the Planck early release catalog (Planck Collaboration VIII 2011). The multiple nature of these systems was first shown thanks to snapshot observations with XMM-Newton, as part of the follow up program of Planck discovered tSZ-sources (Planck Collaboration IX 2011). Deeper and dedicated observation of PLCK1 et PLCK2 were later conducted in the context of a joint XMM-Newton/ESO observing program (PI: E. Pointecouteau)). A first analysis of the X-ray data for the PLCK1 system was performed by Planck Collaboration Int. VI (2013). It allowed for the identification of the three components (A, B and C) forming the system and to put constraints on their redshifts from the X-ray spectroscopy of the Fe-line complex. The analysis indicated a redshift of z ≃ 0.45 for the brightest component in agreement with the overall value of zPLCK1. However, a slight difference on the redshift of the component B was noted. The analysis of the deep observation of PLCK1 was revisited in Lecoq (2021) and Lecoq et al. (in prep.).
The analysis of the X-ray deep observation for the PLCK2 multiple-cluster system was also performed by Kolodzig et al. (2021). In addition to measuring the masses for each of the three members (A, B and C), Kolodzig et al. (2021) found that the system has an overall redshift of z ≃ 0.37, but the precision of the X-ray spectroscopic analysis for two members of the triplet was found to be too low to rule out a projection effect along the line of sight. We note that this was identified as one of the major sources of chance associations in the construction of the Planck cluster catalogs (Planck Collaboration XXIX. 2014).
The deeper and dedicated XMM-Newton observations of PLCK1 et PLCK2 analysed in Planck Collaboration Int. VI (2013), Kolodzig et al. (2021) and Lecoq et al. (in prep.) were completed by optical spectroscopic observations from the Very Large Telescope’s VIsible Multi-Object Spectrograph (VLT/VIMOS) (see Table 1). These optical data were destined to properly constrain the redshifts of each of the three components of the multiple systems in order to confirm or infirm their supercluster nature and to trace the distribution of matter at the system scale. The observations were also planned so that the nature and properties of the galaxies inside the systems could be investigated. In this study, we present for the detailed analysis of the spectroscopic data that allow us to draw conclusions on the nature of PLCK1 and PLCK2 sources and to deliver new results on the physical properties of their member galaxies.
Description of PLCK1 and PLCK2.
We introduce the VLT/VIMOS and ancillary data in Sect. 2. We present the reduction of the VLT/VIMOS data in Sect. 3 and their analysis in Sect. 4. The results obtained on the structures of PLCK1 and PLCK2 and the properties of their member galaxies are presented in Sect. 5. Finally, we present our conclusions in Sect. 6.
2. Data
2.1. VLT/VIMOS spectroscopic data
The PLCK1 and PLCK2 systems were observed using the VIsible Multi-Object Spectrograph (VIMOS), mounted on the Nasmyth focus B of the UT3 on the Very Large Telescope (VLT). The data have been acquired between 2012 and 2013, in Multi Object Spectroscopy (MOS) mode, using the Low-Resolution Red grism, with a spectral resolution R = 200 and a wavelength range covering from 5500 Å to 9500 Å. For each system, four overlapping fields have been observed to cover the gaps between the four quadrants of the instrument, and each field was observed four times. We note that for the fourth field of PLCK1, only three out of four observations could be used due to the lack of calibration files, which are necessary for the absolute flux calibration.
For PLCK1, all four observing fields have an overlapping region on the sky. As a result, the central region of the mosaic, namely, the central quadrant, where components A and B lie, has been observed sixteen times in total. It is in this area that the number of galaxies is the highest. The masks used for the MOS being different in each field, this strategy allowed us to observe a large number of nearby galaxies without risking to have their spectra overlapping. The observing strategy for PLCK2 is slightly different, with the fields overlapping with each other so that only some regions of the global field have been observed up to twelve times.
2.2. Ancillary photometric data
In order to improve the constraints on the redshift estimate of the components of the multiple-cluster systems and to better characterise the galaxies in the fields of view of PLCK1 and PLCK2, we made use of the NED1 database to complement our VLT observations.
The PLCK1 source is located in the north hemisphere. When available, we thus used photometric data in the five u, g, r, i, z bands of Sloan Digital Sky Survey (SDSS), namely DR16 (Ahumada et al. 2020), and the photometric data in the four AllWISE (Cutri et al. 2021) W1, W2, W3, and W4 bands. The optical photometric data will be used to estimate the stellar formation and the IR the stellar population (see Sect. 4.2).
We specifically selected the galaxies from SDSS and AllWISE, which were also present in the spectroscopic data from VLT/VIMOS in the field of PLCK1. To that end, we performed a cross-match based on the galaxy position between the SDSS and AllWISE catalogs, and the VLT/VIMOS sample. We associated the VLT/VIMOS sources with an SDSS or AllWISE galaxy when they fell in the same window of 5″ × 5″, defined in the right ascension (RA) and declination (Dec) coordinates.
We found SDSS photometric data for 83 of the PLCK1 galaxies. For 27 of them, AllWISE photometric data were also available. We note that in some photometric bands, we only had access to upper limits rather than actual flux measurements, so we did not consider those. In Table 2, we give a summary of the number of spectra and galaxies we have access to in each step of the analysis.
Number of available spectra and galaxies after each step of the analysis of the two multiple systems.
Similarly, we searched for photometric data in the direction of PLCK2 system which is located in the southern hemisphere. In this case, we used the galaxy and galaxy-group catalogs from the Dark Energy Spectroscopic Instrument (DESI) Legacy Imaging Survey DR8 (Zou et al. 2019). For this multiple-cluster system, we did not attempt to match the VLT/VIMOS spectroscopic sources with the DESI galaxies and, rather, we used the latter for a structural analysis of PLCK2 (see Sect. 5.2). We found that the DESI galaxy catalog contained photometric redshifts, stellar masses, and star formation rates for a total of 2190 galaxies in a field of ∼20′ centred around the position of PLCK2. In addition, the DESI galaxy-group catalog contained photometric redshifts as well as richness and mass estimates for 506 galaxy groups in the same field of ∼20′ around PLCK2. For three of these groups, we found a match with the position of the X-ray (A, B, C) associated with PLCK2.
3. Data reduction
The VLT/VIMOS data were processed using the ESOREFLEX pipeline (see Freudling et al. 2013 for detailed information and description about the pipeline). This pipeline extracts the spectra from the raw images and performs the flux and wavelength calibration using reference star spectra, and it estimates the spectrum of the sky at the moment of the observation.
The estimation of the sky spectrum principally aims at mitigating the atmospheric effects by removing atmospheric lines from the data. However, we noted the presence of a remaining strong OH atmospheric line at 7600 Å. As we see in the following (Sect. 4.1), this residual line needs to be taken into account in the process of estimating the redshifts of the observed galaxies. It acts as a significant contamination (and source of degeneracy) when spectral features from the galaxies were not visible within the wavelength range (as was the case for PLCK2).
Eventually, the output of the ESOREFLEX pipeline consists in a set of calibrated spectra and their associated coordinates. This sample includes multiply observed sources (up to 16 for the central quadrant of PLCK1), thus we see that multiple spectra are associated with the same source. The observation resulted in 5283 individual spectra for PLCK1 and 4141 for PLCK2.
The following steps of the data reduction thus aim at identifying the multiply observed spectra associated with the same source and computing a single averaged spectrum. To do so, we have first identified the spectra of the repeated sources based on their coordinates. Based on the visual inspection of the positions of the sources, we defined a window of 1.8″ in RA and 7.2″ in Dec, within which all the spectra were considered to be associated with the same source. Within each window, there are typically four to five individual spectra, with this number increasing to 12 spectra or more in the central region (observed 16 times). Since the possibility of having two nearby sources both falling in the same 1.8″ × 7.2″ window cannot be overlooked, we checked the overall agreement between the spectra associated with a single source, and searched for possible outliers. To do so, we computed the median spectrum, M, and the pixel-pixel dispersion D of each spectrum with respect to the median spectrum,
 (1)
(1)
where S is the considered spectrum which is compared to the median spectrum M. Spectra which are very similar in terms of their quality and associated with the right source show low dispersion values (∼1 − 10). Outlier spectra, most likely due to an association with the wrong source, exhibit very high dispersion values (> 106 − 8). We find that above a threshold D = 550 the spectrum is likely associated with the wrong source. It is hence considered for a subsequent association with another source of the sample. Finally, all the spectra associated with a multiply observed source are averaged into a single spectrum.
At the end of the complete reduction process, we obtained 922 spectra associated with individual sources for PLCK1, and 734 for PLCK2 (see Table 2).
4. Analysis
4.1. Determining redshifts and galaxy types from spectroscopic data
In order to analyse the reduced spectra and extract an estimate of the galaxy redshifts and types, we used the online tool MARZ (Hinton et al. 2016). It allows us to fit the data with either star or galaxy spectra and is based on a variety of templates which include Early Type, Star Forming or Transiting galaxy spectra, a quasar-type spectrum, and several stellar spectra (see Hinton et al. 2016 for the detailed list of spectra). For each fit a “quality operator” (QOP) is assigned, ranging from 1 (when it is impossible to state on the quality of the fit) to 4 (when the fit is labelled as “great”) and a QOP of 6 can be assigned (when the target is a star). Eventually, the MARZ code automatically assigns a template, a redshift and a QOP to a source, based on a correlation product between its spectrum and a template.
We ran MARZ on the sample of spectra for both PLCK1 (922 spectra) and PLCK2 (734 spectra) and performed a visual inspection of all the individual outputs in order to confirm the assignation of the templates, redshifts and QOP. For the multiple-cluster systems PLCK1 and PLCK2, we found 20 and 24 sources, respectively, associated with stars and discarded from the analysis. In addition and for the rest of the analysis, we discarded all the spectra for which the QOP was 1 as their nature and redshifts were not properly assessed.
It is important to note that in the case of PLCK2, with an estimated redshift z ≃ 0.35 from the X-ray analysis (Planck Collaboration IX 2011), the wavelength range of the VLT/VIMOS observation prevented us from accessing the 4000 Å spectral discontinuity (Bruzual 1983). The 4000 Å break usually serves as a great reference point for the determination of the redshift of no-emission line early type galaxies. Combined with the contamination from atmospheric OH line at 7600 Å (discussed in Sect. 3), which is precisely at the same wavelength as the Na line for an Early Type Absorption Galaxy at z = 0.29, the MARZ code had higher chances of associating observed spectra not showing emission lines to early-type galaxies at z = 0.29, with a large peak of the correlation product in this precise configuration. After visual inspection, sources presenting no other recognizable spectral features than the one at 7600 Å (i.e., no other absorption or emission line and no noticeable shape of the continuum) had their QOP systematically set to 1 and were discarded for the rest of our analysis. We rejected 20 galaxies in total from our sample for this reason.
We show in Table A.2 the outputs of the this analysis step, in terms of retained spectra, for both multiple-cluster systems PLCK1 and PLCK2. Redshifts are determined for each galaxy. For the 561 galaxies retained in the PLCK1 field (Table 2), we find that 34.8% of the redshifts are in the range of [0.44, 0.51]; 18.2% in of them are within [0.44, 0.455] (A and C); and 10.6% within [0.49, 0.506] (B), namely, the estimated cluster redshifts. For the 299 galaxies retained in the PLCK2 field (Table 2), we find that 11.1% of them are in the expected redshift range [0.345, 0.375], estimated from X-rays, and a larger fraction, 15.5%, at z = 0.29 (in the range [0.28, 0.3]) as expected from the contamination by the atmospheric line.
The templates automatically assigned by the MARZ code (see Table A.1) allow us to obtain galaxy types2 for each of the galaxies in the observed multiple-cluster systems. Among the 561 sources retained as galaxies in the PLCK1 field, we find that 46.2% of them are passive, 22.5% are transitioning, and 30.5% are star-forming galaxies (the remaining 0.8% are quasars). Restricting the redshift range to that expected from the X-ray analysis of PLCK1, namely, [0.44, 0.51], we find 84.6% passive galaxies, 7.7% transitioning, and 7.7% star-forming galaxies, indicating that the galaxy population is indeed that of clusters with quenched star formation. For the 299 galaxies of the PLCK2 field, we find 42.8% passive galaxies, 19.7% transitioning and 36.8% star-forming galaxies. When restricting to the redshift range of the components A and C, namely, [0.345, 0.375], we found 81.8% passive galaxies, 3% transitioning and 15.2% star-forming galaxies. Here again, the population is dominated by cluster-type galaxies. In the redshift range [0.28, 0.3] of component B, we found 30.4% passive galaxies, 34.8% transitioning and 34.8% star-forming galaxies. It is worth noting that the fractions are biased given that during the data reduction process we may have rejected a large number of passive galaxies z = 0.29 due to the atmospheric contamination.
4.2. Estimating galaxy properties from photometric data
Beyond the identification of the galaxy types from the MARZ code, we investigated the galaxy properties in the two multiple-cluster systems. In particular, we estimated their stellar masses, M* and star-formation rates (SFR).
None of the direct and main tracers of the star formation were accessible in our data either due to the spectral resolution or to the spectral range. Indeed, the Hα recombination line at 6563 Å and [OII] emission line at 3727 Å, identified as good proxies for the star formation (Kennicutt 1998), were not observed or blended. Furthermore the wavelength range allows to observe the [OII] forbidden line only for galaxies with z > 0.5, above the estimated redshifts of PLCK1 and PLCK2 from the X-ray analysis of Planck Collaboration IX (2011). In order to constrain the stellar properties of the galaxies, we thus resorted to an approach based on the SED fitting and using the code CIGALE (Burgarella et al. 2005; Noll et al. 2009; Boquien et al. 2019). When available, we used the photometric fluxes from SDSS and AllWISE for the SED fitting. This was the case for 83 galaxies of our VLT/VIMOS sample from the PLCK1 field, for which SDSS ugriz photometric fluxes were avalaible from SDSS-DR16. For a subset of these galaxies, AllWISE photometry in the bands W1, W2 and W3 is available (see Table 2). We eventually used this combination of data to constrain the SFR and stellar masses M* of the galaxies. As input models for CIGALE, we considered a delayed star formation history with optional exponential burst (Małek et al. 2018), a simple stellar population (SSP) from Bruzual & Charlot (2003) with an initial mass function (IMF) from Chabrier (2003), a nebular emission component, a dust attenuation law following Calzetti et al. (2000), and a dust emission following Dale et al. (2014) templates. All models are explained in details in Boquien et al. (2019). The final spectra reconstructed with the combination of these components are eventually convolved with filter responses of the selected surveys to reconstruct modeled magnitudes. Hyperparameters of the models are found with best χ2 or with Bayesian methods (Boquien et al. 2019) obtained on the observed magnitudes. The SFR and M* estimated values are obtained for the best reconstructed magnitudes.
We visually inspected the spectra, returned by the SED fitting with CIGALE, and find a good quality of fit for 72 galaxies in total, which we then used for the rest of the analysis.
5. Results
5.1. PLCK1 mutliple-cluster system
5.1.1. Structure of the system
We display, in Fig. 1 right panel, the 3D distribution of all the galaxies in the field of PLCK1. The redshifts are obtained from MARZ as explained in Sect. 4.1. The colors indicating the galaxy types based on the MARZ templates are as follows: passive in red, star-forming in blue, and transitioning in green. The spheres illustrate the cluster components (A, B, C) identified in Planck Collaboration IX (2011) with their radii (here R500) estimated from the X-ray analysis of Lecoq et al. (in prep.). Figure 1 left panel shows the 2D projection of the galaxies, with the color bar indicating the redshifts. We also show, in Fig. 2 the cumulative histogram distribution of galaxy types and redshifts, in the range of [0.4, 0.52], where the system is expected from the X-ray redshift estimate. In this histogram, the bins contain all galaxy types. We clearly see two peaks of galaxies at z ≃ 0.45 and z ≃ 0.5. Both correspond to concentrations of passive galaxies (in red). The first peak of galaxies matches the components A and C of PLCK1, forming a cluster pair that we call the “A-C pair” hereafter. The second peak, at z ≃ 0.5, matches the component B, which we call “cluster B” hereafter.
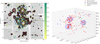 |
Fig. 1. Distribution of the galaxies in the field of PLCK1, between z = 0.4 and z = 0.52. Left: VLT/VIMOS galaxies overlaid on the XMM-Newton brown-filled contours for PLCK1. The colors of the dots correspond to the redshift of the galaxies determined with MARZ (Sect. 4.1). Right: 3D distribution of the galaxies in the field of PLCK1 in the redshift range [0.4, 0.52]. The color of the dots correspond to the galaxy types assigned with MARZ (Sect. 4.1). The blue spheres indicate the spatial extensions of the different components with radius R500 in the RA/Dec. plane and 3σ in the z axis. |
We fit the redshift distribution for the A-C pair and the cluster B and found zB = 0.498 ± 0.004 (1σ) and zA − C = 0.450 ± 0.004 (1σ). We also fit the redshift distribution for two individual cluster components A and C (see Fig. 2), which gives zA = 0.445 ± 0.002 (1σ) and zC = 0.451 ± 0.002 (1σ). The spectroscopic redshifts from the VLT/VIMOS redsfhits are perfectly compatible the redshifts determined from the re-analysis of the XMM-Newton data in Lecoq et al. (in prep., see Table 3). Assuming the cosmological parameters from Planck Collaboration VI (2020), the difference in redshift between A-C pair and B components, Δz = 0.048 ± 0.008, corresponds to a comoving distance of d = 163 ± 28 Mpc. The PLCK1 multiple-cluster system that was detected by Planck is thus the combined signal from the projection of a cluster pair and an isolated background cluster.
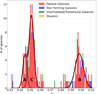 |
Fig. 2. Cumulative histogram of the spectroscopic redshifts of 561 galaxies in the field of PLCK1. The galaxy types are based on the MARZ templates used to fit the spectra (see Sect. 4.1 for details). Passive galaxies are in red, star-forming ones in blue, and transitioning galaxies are in green. The solid lines show the fits to the redshift distribution in the components A, B and C of PLCK1. |
Comparison between the redshifts derived in this work and the constraints from X-ray spectroscopy and optical photometry.
5.1.2. Galaxy properties
Based on the coordinates and redshifts of the 561 galaxies in the PLCK1 field, we determine the membership to each cluster component of the system. A cluster-member galaxy is within 3σ of the spectroscopic redshift estimate (Table 3) and within R500 distance from the centre of the cluster (R500 for each cluster component is determined in Lecoq et al., in prep.). With this definition of galaxy membership, we find that components A, B and C contain 24, 17, and 26 galaxies respectively. Among them, five in A, eight in B, and four in C have counterparts in the SDSS and AllWISE catalogs, with their SFR and M* determined following the procedure described in Sect. 4.2.
We focus on the properties of these member galaxies. We display the SFR and M* obtained from the SED fitting Sect. 4.2 in Fig. 3, where the contours represent the distribution in the PLCK1 field of the 72 galaxies with ancillary data. Figure 3 clearly exhibits a bimodal distribution of the galaxies in the SFR − M* plane.
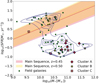 |
Fig. 3. Distribution of the 72 PLCK1 galaxies with photometric measurements from SDSS and AllWISE on the SFR/M* plane (blue contours). Member galaxies of the A (pluses), B (stars), and C (crosses) components are identified as the galaxies within R500 from the cluster centers and within 3σ in redshift. Field galaxies are shown as green dots. Colored areas represent the main sequence at z = 0.45 (A-C redshift) and z = 0.5 (B redshift). |
A first population of star-forming galaxies (main sequence galaxies hereafter) lies along the main sequence. It is compared with the computed main sequence derived from Speagle et al. (2014) at the redshift the A-C pair, z = 0.45 (crimson region, in Fig. 3), and at the redshift of component B, z = 0.5 (gold region, in Fig. 3). A second population of galaxies consists of galaxies with low star-formation rates. In this figure, the field galaxies are represented by green dots whereas the galaxy members of the three clusters A, B, and C are shown as pluses, stars, and crosses respectively. We note that most of the galaxies within R500 from the centre of PLCK1 clusters are in the low star-forming region as expected from cluster members. This is particularly the case for the galaxies of the cluster pair A-C at z = 0.45, where galaxies are fully quenched. The galaxies within R500 of the component B, at z = 0.5, show, in contrast, an almost equal number of low star-forming and main-sequence galaxies indicating the star formation is still ongoing in this cluster. As shown in Fig. 4, this result is in agreement with the studies from Spérone-Longin et al. (2021a) and Spérone-Longin et al. (2021b) carried out at millimeter wavelengths using ALMA observations of the CO(3-2) line, within the Spatially Extended ESO Distant Cluster Survey (SEEDisCS). Their work focuses on the galaxies between the center and the outskirts (up to 10 × R200) of the clusters CL1301.7-1139 and CL1411.1-1148, at redshifts of z = 0.48 and z = 0.52, respectively (similarly to the B cluster in PLCK1). Their study shows a dominant fraction of star-forming galaxies inside these systems. We notice that the most distant cluster of their study, CL1411.1-1148, seems to host only main sequence star-forming galaxies, without any transitioning or passive galaxies. The most nearby cluster of the two, CL1301.7-1139, on the contrary hosts some transitioning and passive galaxies, indicating that the process of quenching star-formation has started in this cluster. The galaxies from the B component of PLCK1, at a redshift z ∼ 0.5 comprised between those of the two SEEDisCS clusters, also hosts both passive and star-forming galaxies in the central region of the cluster, within R500. This may hint to the fact that around z ∼ 0.5, we are witnessing the beginning of the quenching of star-formation in most individual galaxy clusters. We find that all galaxies belonging to the main sequence are identified as “star-forming”. Conversely, all galaxies, except one, identified as “passive” are in a regime of low star formation.
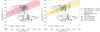 |
Fig. 4. SFR/M* planes for CL1301.7-1139 and CL1411.1-1148 (Spérone-Longin et al. 2021a,b) compared to PLCK1. Left: comparison between the stellar properties of the galaxies in PLCK1 and those in CL1301.7-1139, at z = 0.48, from Spérone-Longin et al. (2021a). The red shaded area marks the galaxy Main Sequence at z = 0.48. Right: comparison between the stellar properties of galaxies in PLCK1, and those in CL1411.1-1148, at z = 0.52, from Spérone-Longin et al. (2021b). The yellow shaded area marks the galaxy Main Sequence at z = 0.52. In both panels, the blue contours represent the photometric measurements from SDSS and AllWISE on the SFR/M* plane. Member galaxies of the A, B, and C components are displayed as pluses, stars, and crosses respectively. |
It is interesting to further investigate whether there is a link between the galaxy properties and the distribution of hot gas in terms of the spatial distribution of galaxies. To do so, we display in Fig. 5 the member galaxies of PLCK1 overlayed on the smoothed X-ray count map (purple) and the VLT/VIMOS pre-imagery (gray quadrants). We highlight the galaxy types as follows: passive (red symbols), star-forming (blue symbols), and transitioning (green symbols) from MARZ, along with those for which we computed the stellar mass and star-formation rate with CIGALE (white symbols for the main-sequence galaxies and black symbols for the low star-forming galaxies). It is worth noting that the passive galaxies are largely dominant in the A-C pair, in the cluster components, where the X-ray emissions peaks. The properties of the galaxies in the A-C pair (in terms of quenched star-formation) are similar to the case of the cluster pair A399-A401 (Bonjean et al. 2018) as well as to the statistical analysis of galaxy quenching inside clusters from Gouin et al. (2020). Finally, the galaxies laying in the main sequence (white symbols) are mainly situated in the component B which also contains low star-forming and passive galaxies.
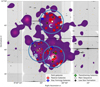 |
Fig. 5. VIMOS galaxies overlaid on the XMM-Newton purple-filled contours for PLCK1. The “+” markers correspond to the component A, the stars to component B and “X” to component C. |
5.2. PLCK2 multiple-cluster system
5.2.1. Structure of the system
As discussed in Sect. 4.1, the VLT/VIMOS spectroscopic data in the field of PLCK2 suffered from two main issues which limited our capacity to determine high quality and large number of redshifts for the components A, B and C. The wavelength range was not quite adapted to the expected redshift of the PLCK2 system and the contamination from the OH atmospheric line introduced a degeneracy with sources at z = 0.29, which translated into rejecting a large number of potentially actual galaxies.
We display, in Fig. 6 right panel, the cumulative distribution of redshifts obtained from the analysis the data in the PLCK2 field with MARZ in the range [0.25, 0.42]. As in Fig. 2, the colors indicate the galaxy types (passive in red, star-forming in blue, transitioning in green and quasars in orange) assigned to the sources in the PLCK2 field. We clearly see a large peak of star-forming and transitioning galaxies in the redshift distribution at z = 0.29. Their high relative abundance with respect to passive galaxies clearly results from the contamination by the atmospheric line. We also note that all other peaks in the distribution are constituted of a handful galaxies each, most of them passive galaxies. The largest of them shows a concentration of galaxies at z ≃ 0.37.
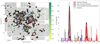 |
Fig. 6. Spatial and redshift distribution of the galaxies in the field of PLCK2, between z = 0.25 and z = 0.42. Left: VLT/VIMOS galaxies overlaid on the XMM-Newton brown-filled contours for PLCK2. The colors correspond to the redshift of the galaxies determined with MARZ (Sect. 4.1). Right: cumulative histogram of the spectroscopic redshifts of 299 galaxies in the field of PLCK2. The galaxy types are based on the MARZ templates used to fit the spectra (see Sect. 4.1 for details). Passive galaxies are in red, star-forming ones in blue, and transitioning galaxies are in green. The solid lines show the fits to the redshift distribution in the components A and B. No fit was obtained for component C. |
The galaxies in PLCK2 field and in the redshift range [0.25, 0.42] are displayed in Fig. 6 (left panel) with the VLT/VIMOS pre-imaging image (gray) and smoothed X-ray contour map (brown) displayed in the background. The blue circles represent the cluster sizes, with their radii, R500, estimated via the analysis of the XMM-Newton data by Kolodzig et al. (2021) and the color bar indicating the redshift.
We fitted the redshift distribution for the components A and B only, the peak at the expected redshift of component C being not significant. We estimated the redshift for cluster A as zA = 0.367 ± 0.003 (1σ) in perfect agreement with the redshift estimated from the X-ray analysis of Kolodzig et al. (2021) and in good agreement with the photometric redshift from DESI. For cluster B, we found zB = 0.292 ± 0.002 (1σ) in good agreement with both the X-ray and photometric redshifts (see Table 3).
Given the lack of spectroscopic redshifts to determine the redshift of component C, hence, to confirm (or initially characterize) the nature of PLCK2, we resorted to ancillary data presented in Sect. 2.2. First, we cross-matched the sources from the VLT/VIMOS analysis with the DESI galaxy catalog. Second, we matched the position of the DESI catalog of groups and clusters with the positions of the PLCK2 components. In both cases, we performed a positional matching within a region of R500 radius, from the values for A, B, and C estimated in Kolodzig et al. (2021). We illustrate the output of this cross-match in Fig. 7. The black solid circles around A, B and C components are the R500 circular areas whereas the black dashed lines represent R200. The red crosses are the positions of the three clusters from the DESI catalog that were found within R500 from PLCK2 components. The colored pluses represent the galaxies from the VLT/VIMOS analysis with z in [0.25, 0.42] and the colored dots represent the DESI galaxies. The color of the symbols represents the redshift of the galaxies (both photometric and spectroscopic). In the case of the DESI galaxies, the size of the symbol represent the specific star formation rate sSFR = SFR/M*. The cross-match of the DESI galaxies at the region of the components shows in Fig. 7 that component A contains a significant number of DESI galaxies with compatible photometric and spectroscopic redshifts for a proper identification of a galaxy overdensity at z ≃ 0.36 − 0.4. For component B, we found a concentration of DESI galaxies within the R200 region at z ≃ 0.28 − 0.30, compatible with the spectroscopic redshift estimated from the VLT/VIMOS data. We show, in Fig. 8, the comparison between the photometric and spectroscopic redshift distributions within R500 of the three components. For components A and B, we see a good match between the spectroscopic redshifts from VLT/VIMOS and the photometric redshifts from DESI. For component C, however, we find no clear evidence for a unique overdensity of galaxies at fixed redshift. This is highlighted in Fig. 8, where we see no particular overdensity of galaxies in the spectroscopic data. The DESI galaxies however seem to point at a slight overdensity of galaxies between redshifts z ∼ 0.3 and z ∼ 0.4. In addition, the peak of the X-ray emission matches the position of a low-mass galaxy group from the group catalog of DESI, at z = 0.33.
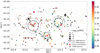 |
Fig. 7. DESI and VLT/VIMOS galaxies inside the PLCK2 field, between z = 0.25 and z = 0.42. The size of the dots correspond to the sSFR and their color to the redshift. |
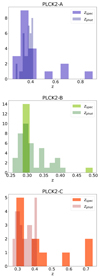 |
Fig. 8. Comparison of the spectroscopic redshifts from VLT/VIMOS and photometric redshsifts from DESI within the R200 of components A, B and C of PLCK2. |
The positional matching of the DESI clusters and the PLCK2 components indicates that only three clusters identified in the DESI survey are found within R500 from A, B, and C positions with masses and photometric redshifts compatible with the ones estimated from the X-ray analysis of Kolodzig et al. (2021, see Table 3). The ensemble of results, that we obtained from our analysis of the VLT/VIMOS spectroscopic data combined with the ancillary data and compared with the X-ray analysis, show that the multiple-cluster system PLCK2, discovered by Planck via the SZ signal, ends up being the chance association of three independent clusters A, B, and C at redshifts of zA ≃ 0.37, zB ≃ 0.27, zA ≃ 0.33 respectively.
5.2.2. Galaxy properties
Very few galaxies were identified as members of the PLCK2 components based on the cluster sizes, estimated via the analysis of the XMM-Newton data, as well as on their redshifts. In particular, we found only seven and three galaxies with spectroscopic redshifts in components A and B, respectively. No VLT/VIMOS galaxy was found in the component C within R500 despite the presence of a concentration of galaxies in the DESI data. In Fig. 9, we see that all the VLT/VIMOS galaxies in cluster A are passive (red symbols), whereas a a majority of B galaxies are star-forming (blue symbols). The latter is due to the bias introduced during the analysis of the spectra with MARZ (see Sect. 4.1).
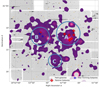 |
Fig. 9. VIMOS galaxies overlaid on the XMM-Newton purple-filled contours for PLCK2. The “+” markers correspond to the component A, the stars to component B and “X” to component C. |
The limited number of VLT/VIMOS galaxies in A and B fields within R500 from the cluster centers makes it hard to conclude firmly on the nature of galaxies in the two components. However, we can use the DESI data and particularly the provided specific star formation rates (sSFR) for each galaxy. We see in Fig. 7, the overdensities of galaxies with low and very low sSFR (i.e., passive galaxies) within the R200 of the three clusters, at redshifts matching those of the clusters. We can thus safely say that the DESI galaxies belonging to the components A and B are not main sequence galaxies but, rather, low star-forming or transitioning galaxies. This finding is in agreement with the expected properties of cluster galaxies.
6. Conclusions
In this study of the two multiple-cluster systems discovered by Planck, PLCKG214.6+36.9 and PLCK334.8−38.0, we analysed the spectroscopic data from dedicated observations with VLT/VIMOS in combination with ancillary optical and near-IR ancillary data from SDSS, AllWISE and DESI. These observations aimed at determining the nature of the multiple-cluster systems and the properties of their member galaxies.
Our analysis of the spectroscopic observation of PLCKG214.6+36.9 multiple-cluster shows that the multiple-cluster system, detected in the Planck survey via the tSZ signal, is the combined signal from the projection of a cluster pair at z = 0.445 ± 0.002 and an isolated background cluster at z = 0.498 ± 0.004. This result, hinted by the analysis of Planck Collaboration Int. VI (2013), is confirmed by an independent re-analysis of the X-ray data from XMM-Newton by Lecoq et al. (in prep.). We also show that the multiple-cluster system PLCK334.8−38.0, detected in the Planck data via the tSZ signal, is the result of a projection effect of three independent clusters: A at z = 0.367 ± 0.003, B at z = 0.292 ± 0.002, and C at z = 0.33, aligned along the line of sight, as hinted by Kolodzig et al. (2021) in their analysis the XMM-Newton observation.
For both PLCKG214.6+36.9 and PLCK334.8−38.0, we confirm from the ancillary data and from the VLT/VIMOS data that the member galaxies are dominated by passive low star-forming galaxies, classified either using SED fitting or with template classification. This is in agreement with the properties of cluster member galaxies. Furthermore, we find that the highest redshift cluster in PLCKG214.6+36.9, at z = 0.498 ± 0.004, is still the site of star-formation activity in agreement with studies carried out in the millimeter wavelength on clusters at similar redshifts (Spérone-Longin et al. 2021a,b). This cluster also contains transitioning galaxies, suggesting that we are indeed witnessing the ongoing quenching of star formation.
In the following, we call transitioning galaxies the ones identified by MARZ as intermediate, composite or transitioning.
Acknowledgments
The authors thank an anonymous referee for their useful comments. This research was supported by funding for the ByoPiC project from the European Research Council (ERC) under the European Union’s Horizon 2020 research and innovation program grant number ERC-2015-AdG 695561. The authors thank all members of the ByoPiC team (https://byopic.eu/team) for useful discussions. The authors acknowledge the use of the NASA/IPAC Extragalactic Database (NED, https://ned.ipac.caltech.edu), funded by the National Aeronautics and Space Administration and operated by the California Institute of Technology.
References
- Ahumada, R., Allende Prieto, C., Almeida, A., et al. 2020, ApJS, 249, 3 [NASA ADS] [CrossRef] [Google Scholar]
- Akamatsu, H., Fujita, Y., Akahori, T., et al. 2017, A&A, 606, A1 [NASA ADS] [CrossRef] [EDP Sciences] [Google Scholar]
- Andrade-Santos, F., Pratt, G. W., Melin, J.-B., et al. 2021, ApJ, 914, 58 [NASA ADS] [CrossRef] [Google Scholar]
- Bag, S., Liivamägi, L. J., & Einasto, M. 2023, MNRAS, 521, 4712 [NASA ADS] [CrossRef] [Google Scholar]
- Bardelli, S., Zucca, E., Vettolani, G., et al. 1994, MNRAS, 267, 665 [NASA ADS] [CrossRef] [Google Scholar]
- Bonjean, V., Aghanim, N., Salomé, P., Douspis, M., & Beelen, A. 2018, A&A, 609, A49 [NASA ADS] [CrossRef] [EDP Sciences] [Google Scholar]
- Boquien, M., Burgarella, D., Roehlly, Y., et al. 2019, A&A, 622, A103 [NASA ADS] [CrossRef] [EDP Sciences] [Google Scholar]
- Bruzual, A. G. 1983, ApJ, 273, 105 [CrossRef] [Google Scholar]
- Bruzual, G., & Charlot, S. 2003, MNRAS, 344, 1000 [NASA ADS] [CrossRef] [Google Scholar]
- Burgarella, D., Buat, V., & Iglesias-Páramo, J. 2005, MNRAS, 360, 1413 [NASA ADS] [CrossRef] [Google Scholar]
- Calzetti, D., Armus, L., Bohlin, R. C., et al. 2000, ApJ, 533, 682 [NASA ADS] [CrossRef] [Google Scholar]
- Chabrier, G. 2003, PASP, 115, 763 [Google Scholar]
- CHEX-MATE Collaboration (Arnaud, M., et al.) 2021, A&A, 650, A104 [NASA ADS] [CrossRef] [EDP Sciences] [Google Scholar]
- Chon, G., Böhringer, H., Collins, C. A., & Krause, M. 2014, A&A, 567, A144 [NASA ADS] [CrossRef] [EDP Sciences] [Google Scholar]
- Cutri, R. M., Wright, E. L., Conrow, T., et al. 2021, VizieR Online Data Catalog: II/328 [Google Scholar]
- Dale, D. A., Helou, G., Magdis, G. E., et al. 2014, ApJ, 784, 83 [Google Scholar]
- Einasto, M., Tago, E., Jaaniste, J., Einasto, J., & Andernach, H. 1997, A&AS, 123, 119 [NASA ADS] [CrossRef] [EDP Sciences] [Google Scholar]
- Einasto, M., Einasto, J., Tago, E., Müller, V., & Andernach, H. 2001, AJ, 122, 2222 [NASA ADS] [CrossRef] [Google Scholar]
- Einasto, M., Kipper, R., Tenjes, P., et al. 2021, A&A, 649, A51 [NASA ADS] [CrossRef] [EDP Sciences] [Google Scholar]
- Freudling, W., Romaniello, M., Bramich, D. M., et al. 2013, A&A, 559, A96 [NASA ADS] [CrossRef] [EDP Sciences] [Google Scholar]
- Gouin, C., Aghanim, N., Bonjean, V., & Douspis, M. 2020, A&A, 635, A195 [NASA ADS] [CrossRef] [EDP Sciences] [Google Scholar]
- Hinton, S. R., Davis, T. M., Lidman, C., Glazebrook, K., & Lewis, G. F. 2016, Astron. Comput., 15, 61 [Google Scholar]
- Jôeveer, M., Einasto, J., & Tago, E. 1978, MNRAS, 185, 357 [NASA ADS] [CrossRef] [Google Scholar]
- Kennicutt, R. C., Jr. 1998, ARA&A, 36, 189 [Google Scholar]
- Kolodzig, A., Aghanim, N., Douspis, M., Pointecouteau, E., & Lecoq, E. 2021, A&A, 653, A163 [NASA ADS] [CrossRef] [EDP Sciences] [Google Scholar]
- Kull, A., & Böhringer, H. 1999, A&A, 341, 23 [NASA ADS] [Google Scholar]
- Lecoq, E. 2021, PhD Thesis, Univ. Paris-Saclay, France [Google Scholar]
- Liivamägi, L. J., Tempel, E., & Saar, E. 2012, A&A, 539, A80 [Google Scholar]
- Małek, K., Buat, V., Roehlly, Y., et al. 2018, A&A, 620, A50 [Google Scholar]
- Nadathur, S., & Hotchkiss, S. 2014, MNRAS, 440, 1248 [NASA ADS] [CrossRef] [Google Scholar]
- Noll, S., Burgarella, D., Giovannoli, E., et al. 2009, A&A, 507, 1793 [NASA ADS] [CrossRef] [EDP Sciences] [Google Scholar]
- Planck Collaboration I. 2011, A&A, 536, A1 [NASA ADS] [CrossRef] [EDP Sciences] [Google Scholar]
- Planck Collaboration VIII. 2011, A&A, 536, A8 [NASA ADS] [CrossRef] [EDP Sciences] [Google Scholar]
- Planck Collaboration IX. 2011, A&A, 536, A9 [NASA ADS] [CrossRef] [EDP Sciences] [Google Scholar]
- Planck Collaboration XXIX. 2014, A&A, 571, A29 [NASA ADS] [CrossRef] [EDP Sciences] [Google Scholar]
- Planck Collaboration VI. 2020, A&A, 641, A6 [NASA ADS] [CrossRef] [EDP Sciences] [Google Scholar]
- Planck Collaboration Int. VI. 2013, A&A, 550, A132 [NASA ADS] [CrossRef] [EDP Sciences] [Google Scholar]
- Planck Collaboration Int. VIII. 2013, A&A, 550, A134 [NASA ADS] [CrossRef] [EDP Sciences] [Google Scholar]
- Speagle, J. S., Steinhardt, C. L., Capak, P. L., & Silverman, J. D. 2014, ApJS, 214, 15 [Google Scholar]
- Spérone-Longin, D., Jablonka, P., Combes, F., et al. 2021a, A&A, 654, A69 [NASA ADS] [CrossRef] [EDP Sciences] [Google Scholar]
- Spérone-Longin, D., Jablonka, P., Combes, F., et al. 2021b, A&A, 647, A156 [Google Scholar]
- Sunyaev, R. A., & Zeldovich, Y. B. 1972, Comm. Astrophys. Space Phys., 4, 173 [Google Scholar]
- Zou, H., Gao, J., Zhou, X., & Kong, X. 2019, ApJS, 242, 8 [Google Scholar]
Appendix A: Classification in MARZ
In Table A.1, we show the list of templates used in the MARZ tool for the classification of the sources, while Table A.2 presents the results of the template adjustment. The total number of spectra for PLCK1 and PLCK2 are given with their associated quality operator (QOP) and the indication of whether or not the spectra were considered for the analysis.
Summary of the templates available in MARZ, from Hinton et al. (2016).
Number of spectra per QOP in each multiple-cluster system.
All Tables
Number of available spectra and galaxies after each step of the analysis of the two multiple systems.
Comparison between the redshifts derived in this work and the constraints from X-ray spectroscopy and optical photometry.
All Figures
|
Fig. 1. Distribution of the galaxies in the field of PLCK1, between z = 0.4 and z = 0.52. Left: VLT/VIMOS galaxies overlaid on the XMM-Newton brown-filled contours for PLCK1. The colors of the dots correspond to the redshift of the galaxies determined with MARZ (Sect. 4.1). Right: 3D distribution of the galaxies in the field of PLCK1 in the redshift range [0.4, 0.52]. The color of the dots correspond to the galaxy types assigned with MARZ (Sect. 4.1). The blue spheres indicate the spatial extensions of the different components with radius R500 in the RA/Dec. plane and 3σ in the z axis. |
| In the text | |
|
Fig. 2. Cumulative histogram of the spectroscopic redshifts of 561 galaxies in the field of PLCK1. The galaxy types are based on the MARZ templates used to fit the spectra (see Sect. 4.1 for details). Passive galaxies are in red, star-forming ones in blue, and transitioning galaxies are in green. The solid lines show the fits to the redshift distribution in the components A, B and C of PLCK1. |
| In the text | |
|
Fig. 3. Distribution of the 72 PLCK1 galaxies with photometric measurements from SDSS and AllWISE on the SFR/M* plane (blue contours). Member galaxies of the A (pluses), B (stars), and C (crosses) components are identified as the galaxies within R500 from the cluster centers and within 3σ in redshift. Field galaxies are shown as green dots. Colored areas represent the main sequence at z = 0.45 (A-C redshift) and z = 0.5 (B redshift). |
| In the text | |
|
Fig. 4. SFR/M* planes for CL1301.7-1139 and CL1411.1-1148 (Spérone-Longin et al. 2021a,b) compared to PLCK1. Left: comparison between the stellar properties of the galaxies in PLCK1 and those in CL1301.7-1139, at z = 0.48, from Spérone-Longin et al. (2021a). The red shaded area marks the galaxy Main Sequence at z = 0.48. Right: comparison between the stellar properties of galaxies in PLCK1, and those in CL1411.1-1148, at z = 0.52, from Spérone-Longin et al. (2021b). The yellow shaded area marks the galaxy Main Sequence at z = 0.52. In both panels, the blue contours represent the photometric measurements from SDSS and AllWISE on the SFR/M* plane. Member galaxies of the A, B, and C components are displayed as pluses, stars, and crosses respectively. |
| In the text | |
|
Fig. 5. VIMOS galaxies overlaid on the XMM-Newton purple-filled contours for PLCK1. The “+” markers correspond to the component A, the stars to component B and “X” to component C. |
| In the text | |
|
Fig. 6. Spatial and redshift distribution of the galaxies in the field of PLCK2, between z = 0.25 and z = 0.42. Left: VLT/VIMOS galaxies overlaid on the XMM-Newton brown-filled contours for PLCK2. The colors correspond to the redshift of the galaxies determined with MARZ (Sect. 4.1). Right: cumulative histogram of the spectroscopic redshifts of 299 galaxies in the field of PLCK2. The galaxy types are based on the MARZ templates used to fit the spectra (see Sect. 4.1 for details). Passive galaxies are in red, star-forming ones in blue, and transitioning galaxies are in green. The solid lines show the fits to the redshift distribution in the components A and B. No fit was obtained for component C. |
| In the text | |
|
Fig. 7. DESI and VLT/VIMOS galaxies inside the PLCK2 field, between z = 0.25 and z = 0.42. The size of the dots correspond to the sSFR and their color to the redshift. |
| In the text | |
|
Fig. 8. Comparison of the spectroscopic redshifts from VLT/VIMOS and photometric redshsifts from DESI within the R200 of components A, B and C of PLCK2. |
| In the text | |
|
Fig. 9. VIMOS galaxies overlaid on the XMM-Newton purple-filled contours for PLCK2. The “+” markers correspond to the component A, the stars to component B and “X” to component C. |
| In the text | |
Current usage metrics show cumulative count of Article Views (full-text article views including HTML views, PDF and ePub downloads, according to the available data) and Abstracts Views on Vision4Press platform.
Data correspond to usage on the plateform after 2015. The current usage metrics is available 48-96 hours after online publication and is updated daily on week days.
Initial download of the metrics may take a while.