Fig. 1.
Download original image
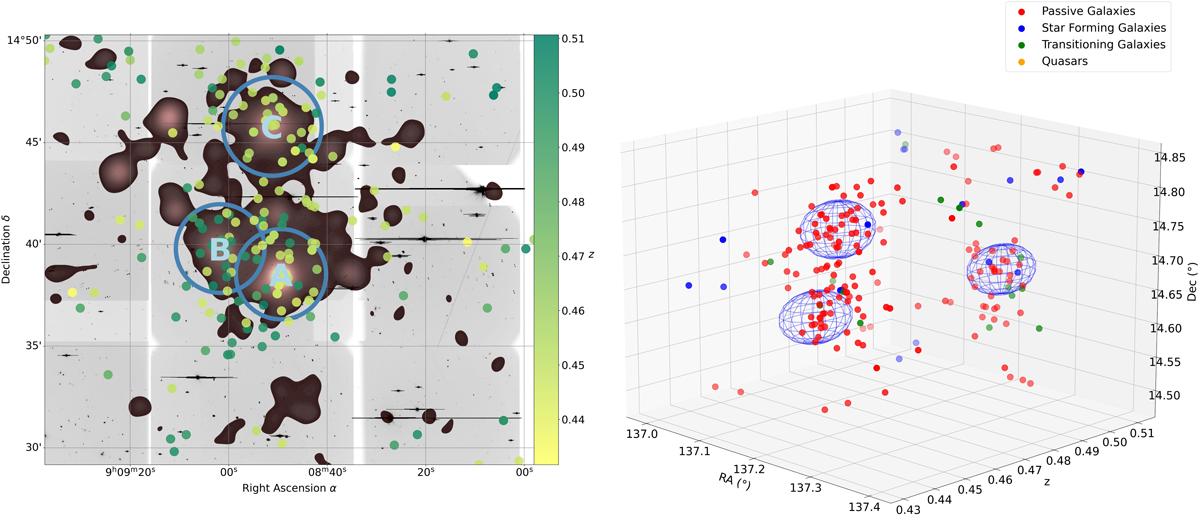
Distribution of the galaxies in the field of PLCK1, between z = 0.4 and z = 0.52. Left: VLT/VIMOS galaxies overlaid on the XMM-Newton brown-filled contours for PLCK1. The colors of the dots correspond to the redshift of the galaxies determined with MARZ (Sect. 4.1). Right: 3D distribution of the galaxies in the field of PLCK1 in the redshift range [0.4, 0.52]. The color of the dots correspond to the galaxy types assigned with MARZ (Sect. 4.1). The blue spheres indicate the spatial extensions of the different components with radius R500 in the RA/Dec. plane and 3σ in the z axis.
Current usage metrics show cumulative count of Article Views (full-text article views including HTML views, PDF and ePub downloads, according to the available data) and Abstracts Views on Vision4Press platform.
Data correspond to usage on the plateform after 2015. The current usage metrics is available 48-96 hours after online publication and is updated daily on week days.
Initial download of the metrics may take a while.