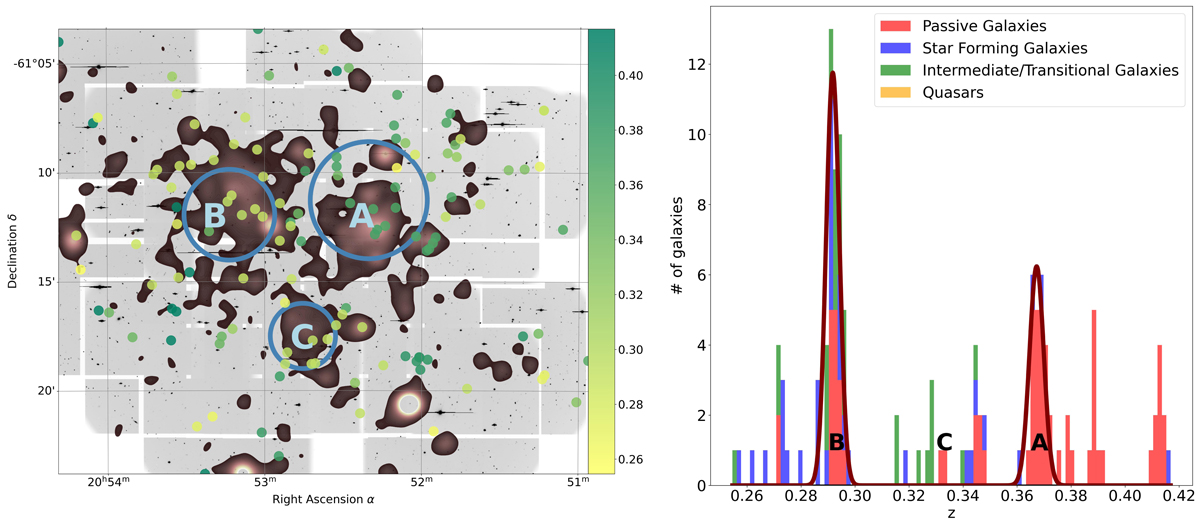
Fig. 6.
Download original image
Spatial and redshift distribution of the galaxies in the field of PLCK2, between z = 0.25 and z = 0.42. Left: VLT/VIMOS galaxies overlaid on the XMM-Newton brown-filled contours for PLCK2. The colors correspond to the redshift of the galaxies determined with MARZ (Sect. 4.1). Right: cumulative histogram of the spectroscopic redshifts of 299 galaxies in the field of PLCK2. The galaxy types are based on the MARZ templates used to fit the spectra (see Sect. 4.1 for details). Passive galaxies are in red, star-forming ones in blue, and transitioning galaxies are in green. The solid lines show the fits to the redshift distribution in the components A and B. No fit was obtained for component C.
Current usage metrics show cumulative count of Article Views (full-text article views including HTML views, PDF and ePub downloads, according to the available data) and Abstracts Views on Vision4Press platform.
Data correspond to usage on the plateform after 2015. The current usage metrics is available 48-96 hours after online publication and is updated daily on week days.
Initial download of the metrics may take a while.