| Issue |
A&A
Volume 676, August 2023
|
|
|---|---|---|
| Article Number | A9 | |
| Number of page(s) | 9 | |
| Section | Extragalactic astronomy | |
| DOI | https://doi.org/10.1051/0004-6361/202245599 | |
| Published online | 26 July 2023 | |
A γ-ray-emitting NLS1 galaxy, SDSS J095909.51+460014.3, identified by multi-wavelength contemporaneous brightening
1
Department of Physics and Astronomy, College of Physics, Guizhou University, Guiyang 550025, PR China
e-mail: This email address is being protected from spambots. You need JavaScript enabled to view it.
2
Institute of Deep Space Sciences, Deep Space Exploration Laboratory, Hefei 230026, PR China
e-mail: This email address is being protected from spambots. You need JavaScript enabled to view it.
3
Deep Space Exploration Laboratory/Department of Astronomy, University of Science and Technology of China, Hefei 230026, PR China
4
School of Astronomy and Space Science, University of Science and Technology of China, Hefei 230026, PR China
5
CAS Key laboratory for Research in Galaxies and Cosmology, Department of Astronomy, University of Science and Technology of China, Hefei 230026, PR China
6
Technion Israel Institute of Technology, Department of Physics, Haifa 3200003, Israel
Received:
1
December
2022
Accepted:
26
May
2023
Abstract
We report on the identification of a new γ-ray-emitting narrow-line Seyfert 1 galaxy (γ-NLS1), SDSS J095909.51+460014.3 (z = 0.399), by establishing an association with a γ-ray source 4FGL 0959.6+4606, although its low-energy counterpart was suggested to be a radio galaxy (RG) 2MASX J09591976+4603515. Wide-field Infrared Survey Explorer long-term light curves of these two sources reveal diverse infrared variability patterns. Brightenings of 2.5 mag are detected for the former source, while flux decays of 0.5 mag are found for the other one. More importantly, the time that the infrared flux of the NLS1 rises is coincident with the time of flux increase of 4FGL 0959.6+4606. At the same time, no infrared activity of the RG has been observed. A specific analysis of 15-month data from Large Area Telescope aboard Fermi, aimed at the high γ-ray flux state, yields a significant source (TS = 43). The corresponding γ-ray localisation analysis suggests that only the NLS1 falls into the uncertainty area, further supporting the updated association relationship. A broadband spectral energy distribution of SDSS J095909.51+460014.3 has been drawn and well described by the classic single-zone homogeneous leptonic jet model. Its jet properties were investigated and found to be comparable with the known γ-NLS1s.
Key words: galaxies: active / galaxies: jets
© The Authors 2023
 Open Access article, published by EDP Sciences, under the terms of the Creative Commons Attribution License (https://creativecommons.org/licenses/by/4.0), which permits unrestricted use, distribution, and reproduction in any medium, provided the original work is properly cited.
This article is published in open access under the Subscribe to Open model. This email address is being protected from spambots. You need JavaScript enabled to view it. to support open access publication.
1. Introduction
In the extragalactic γ-ray sky, active galactic nuclei (AGNs) with strong jets powered by accretion of materials onto supermassive black holes (SMBHs) act as the dominate population (Madejski & Sikora 2016). Most of these sources are blazars, including flat-spectrum radio quasars (FSRQs) and BL Lacertae objects (BL Lacs). Their relativistic jets are closely aligned with our line of sight, and hence the Doppler-boosted, highly variable jet emissions are overwhelming (Blandford & Rees 1978; Ulrich et al. 1997; Blandford et al. 2019). The jet emissions are featured as a universal two-bump structure in log νFν–log ν plot, in which one is due to synchrotron emission while the other one enters into the γ-ray domain. In the leptonic scenarios, the latter is explained as inverse Compton (IC) scattering of soft photons, either inside (synchrotron self-Compton, or SSC, Maraschi et al. 1992) and/or outside of the jet (external Compton, or EC, Dermer & Schlickeiser 1993; Sikora et al. 1994; Błażejowski et al. 2000). On the other hand, hadronic scenarios are adopted to describe blazar γ-ray flares temporally coincident with the cospatial neutrino detection (e.g. IceCube Collaboration 2018; Franckowiak et al. 2020; Liao et al. 2022).
In addition to blazars, observations from Large Area Telescope aboard Fermi (Fermi-LAT) reveal that radio-loud narrow-line Seyfert 1 (RLNLS1) is a new subclass of γ-ray-emitting AGNs (Abdo et al. 2009a,b). NLS1s are characterised by an optical spectrum with narrow permitted lines (i.e. the full width at half maximum, FWHM, of Hβ line less than 2000 km s−1), weak [O III] line emission (i.e. [O III]/Hβ < 3), and strong optical Fe II emission (Pogge 2000). Prominent soft X-ray excesses are also exhibited (Wang et al. 1996; Boller et al. 1996). Only a small fraction of NLS1s harbour strong jets (i.e. radio loudness ℛ = f5 GHz/fB > 10; Kellermann et al. 1989; Komossa et al. 2006). Evidence of the presence of relativistic jets in RLNLS1s has been noticed, including compact morphology, flat or inverted spectral slopes, a very high brightness temperature, and significant variability (Zhou et al. 2003, 2007; Yuan et al. 2008). Detections of γ-ray emissions of RLNLS1s then provide decisive proof that their central engines resemble those of blazars. However, compared with blazars, RLNLS1s tend to possess accretion systems with relatively under-massive SMBHs in a high Eddington ratio (Boroson 2002; but also see Decarli et al. 2008; Baldi et al. 2016). Meanwhile, host galaxies of NLS1s are suggested to be in an early phase of galaxy evolution (Ohta et al. 2007). However, blazars are usually hosted in giant elliptical galaxies (Laor 2000; Sikora et al. 2007; see also Morganti et al. 2011). The diverse properties of the accretion and the host environments between RLNLS1s and blazars make γ-ray-emitting RLNLS1s (i.e. γ-NLS1s) valuable targets, shedding light on the formation and evolution of relativistic jets under extreme physical conditions as well as the coupling of jets and accretion flows.
Among several thousand extragalactic γ-ray sources (Ajello et al. 2020), there is only a handful of γ-NLS1s (Abdo et al. 2009a,b; D’Ammando et al. 2012; D’Ammando et al. 2015a; Yao et al. 2015, 2019; Yang et al. 2018; Paliya et al. 2018; Rakshit et al. 2021). These sources have attracted a lot of attention and triggered extensive multi-wavelength studies (e.g. Jiang et al. 2012; Gu et al. 2015; Foschini et al. 2015; Berton et al. 2019). Considering the relatively limited angular resolution of Fermi-LAT (Atwood et al. 2009), multi-band-correlated activities are needed to pin down the association between the γ-ray source and the low-energy counterpart. In such a case, the number is even smaller.
A γ-ray source named as 4FGL 0959.6+4606 is included in the third data release of the fourth Fermiγ-ray catalogue (4FGL-DR3; Abdollahi et al. 2022). 2MASX J09591976+4603515 (hereinafter candidate A), an edge-on radio galaxy (RG, z = 0.148, Peña-Herazo et al. 2021), is listed as its low-energy counterpart. Candidate A is known as an infrared source (Skrutskie et al. 2006). Its infrared colours observed by Wide-field Infrared Survey Explorer (WISE, Wright et al. 2010) are similar to those of blazars, and hence it is believed to be a potential γ-ray emitter (D’Abrusco et al. 2012). RGs are also known as prominent extragalactic γ-ray emitters (Abdo et al. 2010a,b). Though their Doppler boost effect is mild due to the large jet inclination angles, there are several dozens of such sources detected by Fermi-LAT (Abdollahi et al. 2022). Adopting the faint images of the Radio Sky at Twenty Centimeters (FIRST) 1.4 GHz (Helfand et al. 2015) and Sloan Digital Sky Survey Data Release 16 (SDSS DR16; Ahumada et al. 2020) g-band measurements, its radio loudness ℛ is yielded as ∼20. However, such a relatively low radio loudness value does not imply a weak jet, since optical emissions of nearby RGs are typically dominated by the host galaxy components rather than the accretion disc emissions. Interestingly, it is noted that a RLNLS1, SDSS J095909.51+460014.3 (hereinafter candidate B, z = 0.399, Rakshit et al. 2017) also falls into the γ-ray localisation uncertainty area. For candidate B, ℛ is estimated to be as high as ∼1000, which is rather rare among NLS1s. Since the latter is not detected in WISE W3 and W4 bands, the colour comparison with blazars is unavailable. In this paper, considering the ambiguous association relationship, we performed thorough investigations on 4FGL 0959.6+4606 as well as its two potential counterparts, especially in the temporal perspective, attempting to straighten out the tangle. Here, we adopt a ΛCDM cosmology with Ωm = 0.32, ΩΛ = 0.68, and a Hubble constant of H0 = 67 km−1 s−1 Mpc−1 (Planck Collaboration XVI 2014).
2. Data reduction and analysis
2.1. Fermi-LAT data
The first 13.8 yr (i.e. 4 August 2008 to 4 June 2022) Fermi-LAT Pass 8 data (evclass = 128 and evtype = 3) were collected, with energy ranged from 100 MeV to 500 GeV. The Fermitools software (version 2.0.8), along with Fermitools-data (version 0.18), were adopted. In order to filter the photon data, the zenith angle cut (i.e. < 90°) as well as the quality-filter cuts (i.e. DATA_QUAL > 0 && LAT_CONFIG == 1) were applied in the gtselect and gtmktime tasks. The gtlike task with Unbinned likelihood approach was used to extract γ-ray flux and spectrum. Test statistic (TS = 2Δlog ζ, Mattox et al. 1996), where ζ represents maximum likelihood values of different models with and without the target source, was used to qualify the significance of γ-ray detection. During the likelihood analysis, diffuse γ-ray emission templates (i.e. gll_iem_v07.fits and iso_P8R3_SOURCE_V3_v1.txt) together with 4FGL-DR3 sources (Abdollahi et al. 2022) within 15° of 4FGL 0959.6+4606 were considered. Parameters of the inner region background sources, a 10° radius region of interest (ROI), as well as normalisations of the two diffuse templates were left free, while others were fixed in the 4FGL-DR3 values. We checked whether there are new γ-ray sources based on the subsequently generated residual TS maps. If so, the likelihood fitting was then re-performed adopting the updated background model. When extracting a γ-ray light curve, weak background sources (i.e. TS < 10) were removed from the analysis model.
2.2. Swift data
There is one visit with an exposure time of 1.9 ks from the Neil Gehrels Swift Observatory (Gehrels et al. 2004) on candidate B on 8 May 2017. The data were analysed by the FTOOLS software (version 6.28). For photon-counting mode data from X-ray telescope (XRT) on Swift, firstly, event cleaning xrtpipeline procedure with standard quality cuts was performed. Only 12 net photons of the target have been detected. Nevertheless, the signal-to-noise ratio (S/N) for detecting the X-ray source is given as 3.4 by the ximage task. No significant excess beyond the background at the position of candidate A is found. The spectrum of the source was extracted from a circular region with a radius of 12 pixels, that of background from a circular blank region with a larger radius (50 pixels). The xrtmkarf task was adopted to create the ancillary response files with the most recent calibration database. Considering the limited statistics, the data were not binned, and we froze the absorption column density to the Galactic value (i.e. 3.6 × 1020 cm−2, HI4PI Collaboration 2016). Meanwhile, the photon index was set as a routine value (i.e. Γx = 1.5, where Γx is photon index of the power-law function). An unabsorbed 0.3−10.0 keV flux of  erg cm−2 s−1 (𝒞-Statistic/d.o.f., 9.6/11; Cash 1979) is yielded. In addition, there is a snapshot in the uw2 band by Ultraviolet/Optical Telescope (UVOT) on Swift, from which the magnitude was extracted by the aperture photometry (i.e. the uvotsource task). During the extraction, a 5″ circular aperture was selected for the target, while a larger source-free region was selected for the background.
2.3. WISE data
The multi-photometric monitoring data were collected in W1 and W2 bands (centred at 3.4, 4.6 μm in the observational frame) from WISE (Wright et al. 2010) and the Near-Earth Object WISE Reactivation mission (NEOWISE-R; Mainzer et al. 2014; WISE Team 2020). We removed the bad data points with poor image quality (‘qi_fact’ < 1), a small separation from the South Atlantic Anomaly (‘SAA’ < 5), and that were in the moon mask areas (‘moon mask’ = 1) (Sheng et al. 2017, 2020). The data in each epoch was binned (nearly half a year) using a weighted mean value to probe the long-term variability of the target; the corresponding uncertainty was calculated by the propagation of measurement errors.
2.4. Radio data
We further cross-matched the archive of the Very Large Array Sky Survey (VLASS; Lacy et al. 2020) and the FIRST (Helfand et al. 2015) with optical positions of the two objects, candidate A and candidate B. The VLASS and FIRST frequencies, angular resolutions, radio-integrated and peak flux densities, and background noise are listed in Table 1. The VLASS fluxes were obtained by modelling the source with a Gaussian fit on the image plane using the Common Astronomy Software Applications.
VLASS and FIRST frequencies, angular resolutions, radio integrated and peak flux densities, and background noise.
3. Result
3.1. γ-ray and infrared behaviour
Analysis of the entire 13.8 yr Fermi-LAT data confirms that there is a significant (TS = 89) γ-ray source in this direction. The corresponding power-law spectrum index is given as Γγ = 2.61 ± 0.14, consistent with the values listed in The fourth catalog 4FGL-DR3 (Abdollahi et al. 2022). The optimised γ-ray location is at RA 149.866° and Dec 46.011°, with a 95% confidence-level (C.L.) error radius of 4.6′. Because of the proximity (roughly 4′), both low-energy sources remain within the γ-ray localisation error radius.
Since the spatial resolution of W1 and W2 bands of WISE is about 6″, the two separated infrared light curves of the counterparts provide crucial information regarding their temporal properties. As shown in Fig. 1, the variability amplitude of candidate A is about ≲0.5 mag; however, long-term variability with a brightening of ∼2.5 mag is seen in candidate B. Meanwhile, it is worth noting that the time epochs corresponding to the high flux states of the two sources are different. For candidate A, which departed from the high flux state at the beginning of the WISE observations around MJD 55500, a long flux decline until MJD 57500 is detected. From that point, its infrared fluxes remain quiescent. For the RLNLS1, at the start of the WISE observations (i.e. < MJD 57500), no significant variations are detected. However, a distinct flux increase then follows, peaking on MJD 58063. Other activities were also detected around MJD 59000.
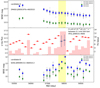 |
Fig. 1. γ-ray, half-year, time-bin light curve of 4FGL J0959.6+4606 and infrared light curves of candidate A and candidate B. Blue circles represent the γ-ray fluxes, while the red triangles are upper limits. Red bars are the corresponding TS values. The yellow region marks the epoch corresponding to high flux state of 4FGL J0959.6+4606, identified by a further monthly time-bin light curve, see Fig. 2. |
We extracted a half-year bin γ-ray light curve to compare with those in infrared bands (see Fig. 1). Although the statistic is limited, two bins with TS values larger than ten stand out. There is no corresponding infrared activity of candidate A matching the γ-ray brightening. However, the epoch of γ-ray flux increase coincides with the time of high flux state of infrared emission of candidate B, which is supported by the public yearly bin γ-ray light curve provided in the 4FGL-DR3 catalogue (Abdollahi et al. 2022). In addition, temporal properties of strong nearby γ-ray background sources were investigated, from which no similar behaviour to that of 4FGL 0959.6+4606 is found. Therefore, the brightening is likely intrinsic rather than artificially caused by the background sources.
A monthly bin γ-ray light curve, focusing on the data later than MJD 57500, was also extracted to search for potential short-term variation as well as to determine the time range of the high flux state. Two time bins with relatively large TS values appear, located at MJD 58000 and 59388, respectively. Interestingly, there are a few time bins with TS values ≥5 clustered around the former. Therefore, an individual analysis, selecting a time range of 15 months of Fermi-LAT data, was performed (see Fig. 2). The analysis yields a significant (TS = 43) γ-ray source, from which an optimised γ-ray location at RA 149.875° and Dec 45.938°, along with a 95% C.L. error radius of 6.6′, are derived. A corresponding TS map was generated, where localisation results of data from different time epochs are shown together (see Fig. 3). In this case, the angular separation between the γ-ray location and candidate A is 7.8′, while the value for candidate B is 5.3′. Therefore, only the RLNLS1 falls into the γ-ray localisation error radius. All the evidence suggests that candidate B is the low-energy counterpart of the γ-ray source. The photon flux of the γ-ray source is given as (1.40 ± 0.40)×10−8 ph cm−2 s−1 and the Γγ is constrained as 2.74 ± 0.21. Adopting a redshift of 0.399, a corresponding apparent luminosity of (3.1 ± 0.7)×1045 erg s−1 is obtained. For the other monthly time bin at MJD 59388, a further ten-day time-bin light curve was extracted. In the time range between MJD 59369 and 59399, a γ-ray source (TS = 30) with a relatively hard spectrum (Γγ = 1.90 ± 0.26) is found, indicative of possible variability on a timescale of dozens of days. However, due to the limited statistics, in this case, both low-energy sources are embraced within the γ-ray localisation uncertainty area. Moreover, no simultaneous infrared observations at this epoch are available.
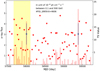 |
Fig. 2. Monthly time-bin γ-ray light curve of 4FGL J0959.6+4606, focusing on the epoch of > MJD 57500. The yellow region, with a time length of 15-month in total, represents the high γ-ray flux state. |
To further investigate the validness of the γ-ray brightening, a 15-month time-bin light curve was also extracted (see Fig. 4), in which the seventh bin corresponds to the high flux state mentioned in Figs. 2 and 3. TS values are lower than 10 (i.e. < 2σ) for the first six time bins in the light curve. However, the TS value of the seventh bin reaches 43 (i.e. 5.9σ). After the trial factor correction, the detection significance holds at 5.5σ, suggesting that the brightening is unlikely due to fluctuation of the background emissions. We also looked into the significance of the flux enhancement. Since the detection sensitivity of Fermi-LAT is strongly dependent on the length of the exposure time, and the target maintains the low flux state at the beginning, an analysis of the entire 7.5 years of data, corresponding to the first six time bins in the light curve, was carried out. The analysis yields a marginal detection (i.e. TS = 24), with a photon flux of (3.84 ± 0.64) × 10−9 ph cm−2 s−1. A quantity defined as  was used to qualify the significance of variation between two different flux states. Hence, the significance is calculated as 2.5σ, indicating that probability of the γ-ray flux enhancement is roughly 99%. On the other hand, the amplitude of infrared variability is large (Δmag > 2.5 mag), and the corresponding measurement uncertainties are relatively small (typically less than 0.1 mag) compared with that in γ rays. More importantly, the two infrared light curves exhibit the similar variability trends, suggesting that infrared brightening is not caused by random fluctuation.
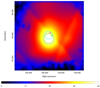 |
Fig. 3. Smoothed γ-ray residual (i.e. 4FGL 0959.6+4606 is not included in the analysis model file) TS map with a scale of 1.5° ×1.5° and 0.03° per pixel, extracted from the 15-month Fermi-LAT data. The green and cyan circles correspond to the 95% C.L. γ-ray localisation uncertainty region of the 15-month period and entire data set, respectively. The green and pink X-shaped markers are radio positions of candidate B and candidate A, respectively. |
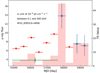 |
Fig. 4. 15-month time-bin γ-ray light curve of 4FGL J0959.6+4606. Blue circles represent the γ-ray fluxes, while the red triangles are upper limits. Red bars are the corresponding TS values. The seventh bin corresponds to the yellow region in Fig. 2. The green star is the γ-ray flux from the first 7.5 years of data. |
Besides the long-term variability, the single WISE snapshots, typically a dozen exposures within two days, allow us to investigate intra-day variability. Assuming a Gaussian noise mode of WISE measurements (Wright et al. 2010), a χ2 test was adopted, of which the null hypothesis corresponds to a constant flux level (Mao & Yi 2021). The value of the constant flux was optimised for each epoch to find a minimum reduced χ2 value. If such a value is still too large that the null hypothesis is rejected, the variability is decided to be significant. In addition to the estimated PSF photometry errors, systematic errors that were derived from the dispersion of the detections of the standard stars (i.e. ∼0.03 mag, Jiang et al. 2012) were also considered. No signs of significant infrared short-term variability (i.e. < 3σ) of candidate A are found. For candidate B, significant short-term variability (i.e. > 5σ) both in the W1 and W2 bands around MJD 57334 and 58063 is detected. We note that the latter is the time of maximum infrared flux value. Variability timescales in the source frame are thus estimated as τsource = Δt × ln2/ln(F1/F2)/(1 + z), which suggests doubling timescales of ≃9 h and 17 h, respectively.
3.2. Re-analysis of the SDSS spectrum
The optical spectrum of candidate B observed on MJD 54525 was derived from the SDSS archive, and its median S/N is about 8. The analysis was carried out with the help of PyQSOFit software1 (Guo et al. 2018). After shifting the spectrum to its rest frame and considering the Galactic extinction (Schlafly & Finkbeiner 2011), firstly, it was simultaneously fitted with a global AGN power-law continuum and stellar contribution of the host galaxy, while emission lines excluding the Fe II multiplets (Boroson & Green 1992; Vestergaard & Wilkes 2001) were masked. The galaxy emission was described by the summation of independent component analysis templates (Lu et al. 2006). Then, a simultaneous fitting of the Hβ emission line region (i.e. 4385−5500 Å) was carried out, in which the local continuum, the Fe II multiplets, together with the Hβ and the [O III] doublet emission lines were considered (see Fig. 5). However, the strength of the Fe II multiplets cannot be well constrained due to the relatively low S/N. The He IIλ4687 Å line also falls into this region, but it is not distinct from the continuum emission. Monte Carlo (MC) simulations were performed to estimate the measurement uncertainties. Each data point was treated as a Gaussian probability distribution, of which the mean and standard deviation were set as the measured value of the data point and its error. We conducted a thousand MC samplings for each Gaussian distribution and the generated artificial data points constructed mock spectra. By repeatedly fitting the mock spectra, distributions of the parameters were obtained. The measurement uncertainties were calculated based on the 68% range (centred on the median) of the distributions (Shen et al. 2011). A single Lorentzian profile gives an acceptable description of the Hβ line, of which the FWHM is suggested as (1424 ± 180) km s−1. A two-Gaussian model does not offer significant improvement of the fitting. In addition, the flux ratio of total [O III] to total Hβ is estimated as 0.7. Therefore, candidate B is confirmed as an NLS1, which is consistent with the results of Rakshit et al. (2017). Using the empirical virial BH mass relation (Shen et al. 2008) and the estimated continuum luminosity λLλ (5100 Å) = (6.45 ± 2.76) × 1043 erg s−1, we obtain a constraint of log(MBH/M⊙)≳6.8, in the case of a disc-like geometry of the broad line region (BLR). Moreover, the Eddington ratio Lbol/Ledd ≲ 0.6 can be inferred using the bolometric luminosity correction Lbol ∼ (8.1 ± 0.4)L5100 Å (Runnoe et al. 2012).
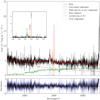 |
Fig. 5. SDSS spectrum of candidate B. The red line corresponds to the combination of all components. The green, brown, blue, and orange lines represent the descriptions of host galaxy, power-law continuum, Lorentzian profile of Hβ, as well as the [O III] doublet, respectively. |
3.3. Radio properties
We measured the spectral index between 1.4 and 3.0 GHz by fitting the spectrum with a power law using the following definition:
 (1)
(1)
where S1 is the flux density at 1.4 GHz from FIRST and S2 is the average flux density at 3.0 GHz of the two epochs VLASS observations. Candidate A has a steep spectral slope with α = −0.72, and candidate B has a flat spectral slope with α = 0.15. The two sources show a point-source morphology in the VLASS and FIRST surveys. The ratio of peak-integrated-flux density of candidate A is smaller than that of candidate B, which indicates that the former is more compact.
3.4. Implications of a broadband SED of the RLNLS1
The broadband Spectrum Energy Distribution (SED) of candidate B has been drawn based on the multi-wavelength observations, especially focusing on the simultaneous brightening of the γ-ray and infrared emissions. The high flux state SED includes the 15-month γ-ray spectrum between MJD 57651 and 58104, Swift observations at MJD 57881, as well as WISE detections at MJD 58063 (see Fig. 6). Non-simultaneous data including archival Galaxy Evolution Explorer (GALEX, Seibert et al. 2012), SDSS (Ahumada et al. 2020), and WISE final catalog release (ALLWISE, WISE Team 2019) photometric data, as well as the VLASS (Lacy et al. 2020) and FIRST (Helfand et al. 2015) radio data, are also plotted. Considering it shares a similar redshift with PKS 1502+036, data of the latter from Abdo et al. (2009b) are drawn for comparison. A remarkable feature of the SED of candidate B is a violent variation in the infrared band, which means that the jet emission is overwhelming, even in the UV domain. The shape of the SED in optical-UV bands of candidate B is similar to that of PKS 1502+036, suggesting that the peak frequencies of their synchrotron bump are likely ≲1014 Hz. Therefore, candidate B is classified as a low-synchrotron-peaked source (LSP; Padovani & Giommi 1995; Abdo et al. 2010c). For the high-energy bump, both of the sources exhibit soft γ-ray spectra, though PKS 1502+036 is more luminous than candidate B.
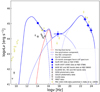 |
Fig. 6. SED in high flux state of SDSS J095909.51+460014.3 along with the theoretical descriptions. Archival SED data of PKS 1502+036 (Abdo et al. 2009b) were also plotted for comparison. Un-simultaneous data were coloured in grey. The red line represents the description of the big blue bump, with Ld = 8 × 1044 erg s−1 (∼0.4 Ledd) and MBH = 6.8 × 10⁶ M⊙. |
The intra-day infrared variability allows us to put a Doppler factor (i.e. δ) constraint on the jet. It should be large enough to avoid severe attenuation on γ rays from soft photons via the γγ process. The corresponding opacity (Dondi & Ghisellini 1995) is given as
 (2)
(2)
where σT is the Thomson scattering cross-section, R′ is the absorption length, x′=hν′/mec2 and  correspond to the dimensionless energy of the γ rays and target soft photon in the comoving frame, and
  is the differential number density per energy of the latter. The target photons from the jet itself could be responsible for the absorption. Hence, the radius of the jet dissipation region, constrained as
  , where τsource is set as 17-h, is equal to the absorption length. The most energetic photon associated with the source is about 4 GeV. Adopting the observed luminosity of soft photons at a few kilo-electronvolts of 2 × 1044 erg s−1, a constraint of δ ≳ 3 is given. Alternatively, the lack of information about the external absorption photons at several tens of electronvolts prevents us from setting a reliable constraint.
The high flux state SED is described by the classic single-zone homogeneous leptonic model including the synchrotron and IC processes, in which the synchrotron self-absorption process and the Klein–Nishina effect in the IC scattering are considered. A relativistic compact blob, embedded in the magnetic field and the external photon field, is responsible for the jet emission. Relativistic transformations of luminosity and frequency between the observational frame and the jet frame are  and ν = δν′/(1 + z), respectively. The emitting electrons are assumed to follow a broken power-law distribution:
 (3)
(3)
where p1, 2 are indexes of the broken power-law particle distribution, and γbr, γmin, and γmax correspond to the break, the minimum, and the maximum energies of the electrons, respectively. Since the accretion system of NLS1s is radiatively efficient, EC processes are proved to be crucial to describe the γ-ray emission of the RLNLS1s (Abdo et al. 2009a,b). Distance (i.e. Ddiss) between the jet dissipation region and the central SMBH is needed to determine the origin of the external soft photon field (Madejski & Sikora 2016). Assuming a simple conical jet geometry, the distance is in proportion with the radius of the jet blob  (Tavecchio et al. 2010), which can be constrained based on the WISE short-term variability. Taking a routine δ value (i.e. 15, Liodakis et al. 2017), the distance is suggested as
  pc. Meanwhile, the radius of BLR could be constrained to ∼0.02 pc based on the measured Lλ(5100 Å) (Bentz et al. 2013). Therefore, in EC processes, infrared emissions from the dust torus with temperatures of 1200 K (Błażejowski et al. 2000) are considered as the soft photon field, of which the energy density in the rest frame was set as 3 × 10⁻⁴ erg cm−3 (Ghisellini et al. 2012). In relation to the broad emission line revealed by the SDSS spectrum, the contribution of the accretion-disc emission (Shakura & Sunyaev 1973) is also considered. The accretion disc extends from 3 Rs to 2000 Rs, where Rs is the Schwarzschild radius. It produces a total luminosity of Ld = ηṀc2, in which Ṁ is the accretion rate and η is the accretion efficiency. The efficiency is set to 0.057 for a low angular momentum black hole (Frank et al. 2002). The accretion disc emission is characterised by a multi-temperature radial profile (Frank et al. 2002), with a local temperature T at a certain radius Rdisk given by
![Mathematical equation: $$ \begin{aligned} T^{4} = \frac{3R_{\rm s}L_{\rm d}}{16\pi \eta \sigma _{\rm SB}R_{\rm disk}^{3}}\left[1-\left(\frac{3R_{\rm s}}{R_{\rm disk}}\right)^{1/2}\right], \end{aligned} $$](/articles/aa/full_html/2023/08/aa45599-22/aa45599-22-eq12.gif) (4)
(4)
where σSB is the Stefan-Boltzmann constant.
The theoretical description provides a good explanation of the high-flux SED shown in Fig. 6. Corresponding input parameters are listed in Table 2. Data points around the SED bump peaks are important for constraining the modeling, however, sub-millimetre, far-infrared data and a reliable X-ray spectrum are unavailable here. Meanwhile, the disc model cannot be well constrained from the high-flux SED, such that the contribution of the jet is overwhelming in the UV domain. Nevertheless, the disc model manages to provide an acceptable description of the archival GALEX data when the jet emission was in the quiescent state. Similar to the known γ-NLS1s (e.g. Abdo et al. 2009b), γ-ray emission of candidate B is mainly from the EC processes. Furthermore, the input parameters here are consistent with that used in those sources (e.g. D’Ammando et al. 2012; D’Ammando et al. 2013; Yang et al. 2018; Rakshit et al. 2021; Gokus et al. 2021), such as B ∼ 1 Gauss, δ ∼ 15, and γbr ∼ 500. Interestingly, the γbr values of γ-NLS1s as those of FSRQs, are generally lower than those of BL Lacs (e.g. Chen 2018). In fact, the majority of γ-NLS1s are LSPs (Abdollahi et al. 2022). In addition to the leptonic scenarios, hadronic scenarios could also play an important role in γ-NLS1s, and hence they are possible neutrino emitters (Ahlers & Halzen 2015). Recently, a cospatial incoming IceCube neutrino event is temporally coincident with a minor γ-ray flare of 1H 0323+342 (Franckowiak et al. 2020). Hadronic processes have been taken into account to describe the SED of PKS 1502+036 (Wang et al. 2023). We looked into the IceCube alert data archive2, and unfortunately no known neutrino event in the direction of candidate B has been found. Moreover, no evidence of hadronic processes in the electromagnetic data, for example, an orphan γ-ray flare (e.g. Böttcher et al. 2013), has been found either. Future multi-messenger studies are needed to probe its potential as a neutrino source.
4. Discussion and summary
Since γ-NLS1s shed light on jets launching from extreme environments, efforts to enlarge their number have been made. The majority of them are found by detections of new γ-ray sources towards the RLNLS1s (e.g. Abdo et al. 2009b). Re-analysing optical spectra of known γ-ray sources to identify their NLS1 nature is another approach (e.g. Yao et al. 2015). In particular, infrared spectroscopic observations are needed for high-redshift ones (i.e. z ≳ 0.8) since the Hβ line is not embraced by the optical spectral coverage (Yao et al. 2019; Rakshit et al. 2021). Here, another approach is adopted. We endeavoured to pin down an association relationship between a known γ-ray source and a RLNLS1 so that a new γ-NLS1 can be identified. In fact, due to the proximity of candidate A to candidate B and the weak, spectrally soft γ-ray signal, the identification is impossible without the help of infrared and γ-ray temporal information. Considering candidate B as an LSP and the relatively soft γ-ray spectrum, energy regimes of these emissions are located on the right side of the synchrotron and IC SED bump peaks, respectively, and hence they are likely from the same population of emitting electrons in the leptonic scenario. The common origin makes contemporaneous brightening of the infrared and γ-ray emissions reasonable. A similar phenomenon has been reported for a high-redshift FSRQ (Liao et al. 2019). On the other hand, γ-ray variability behaviour of radio galaxies is diverse. No significant variations on a timescale of months are commonly observed3. However, occasionally, flare-like phenomena for some individuals have been reported. For instance, a multi-frequency campaign of 3C 111 reveals simultaneous flux increases in the millimetre, optical, and X-ray fluxes when its γ-ray emission is bright (Grandi et al. 2012). Multi-wavelength monitoring of 3C 120 detects correlated radio and γ-ray activities (Tanaka et al. 2015). Therefore, if candidate A is the low-energy counterpart, it is reasonable to assume that its γ-ray flux is proportional to the infrared flux. However, the γ-ray flux increase accompanie by its quiescent infrared emissions does not support this assumption. There is no categorised γ-ray source in 3FGL that is built by the first four years of Fermi-LAT data when the infrared flux of candidate A is in a high-flux state. The failure of a γ-ray detection then puts a severe limit on its expected flux level. Such an expectation at MJD > 57000 is even lower due to its infrared flux decay. In the epoch of 15 months when the infrared flux of candidate B is brightening, the γ-ray contribution of candidate A is likely negligible. In conclusion, the RLNLS1 is preferred as the counterpart of 4FGL J0959.6+4606. Upcoming additional optical sky surveyors in time domain, such as the Wide Field Survey Telescope (Lou et al. 2016) and the Large Synoptic Survey Telescope (Ivezić et al. 2019), will be crucial to the investigation of multi-wavelength temporal properties of AGN jets.
It is interesting to compare candidate B with the known highly beamed γ-NLS1s. Firstly, γ-NLS1s tend to exhibit soft γ-ray spectra (i.e. Γγ ≳ 2.5, Abdollahi et al. 2022), which is consistent with that of candidate B. To compare the γ-ray luminosity, since a reliable estimation of candidate B is only derived in the high-flux state (i.e. in a 15-month period), energy flux of the time bin with the highest flux level in archival yearly bin light curve (Abdollahi et al. 2022) for each known γ-NLS1 has been adopted. As shown in Fig. 7, candidate B lies at the low-luminosity region of the distribution. It is not surprising because candidate B is one of the few sources with z ≤ 0.4. In the temporal perspective, detections of γ-ray flares are in common for these sources (e.g. D’Ammando et al. 2016; Yang et al. 2018; Gokus et al. 2021). In an extreme case, the variability amplitude of PMN J0948+0022 can reach up to more than one order of magnitude (D’Ammando et al. 2015b). Moreover, simultaneous broadband activities of γ-NLS1s have also been observed (e.g. D’Ammando et al. 2015b), suggesting that their central engine resembles that of blazars. The relatively low luminosity compared with FSRQs is likely due to the relatively lower black hole masses (Chen & Bai 2011).
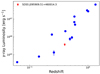 |
Fig. 7. Comparison between SDSS J095909.51+460014.3 and other γ-NLS1s. K-corrections for the luminosities have been applied. Luminosity of the target is based on the analysis of the 15-month Fermi-LAT data. For other sources, each luminosity value is calculated from energy flux of the time bin with the highest flux level in archival yearly bin light curve (Abdollahi et al. 2022). |
Nearby γ-NLS1s are valuable targets for investigations on the host galaxy environments where the strong relativistic jets are launched. Based on the Hubble Space Telescope observations of 1H 0323+342, its host galaxy is suggested as a one-armed spiral galaxy (Zhou et al. 2007). Alternatively, a ring structure likely due to a galaxy merger has been identified by Nordic optical telescope observations (Antón et al. 2008; León Tavares et al. 2014). The host galaxy of FBQS J1644+2619 is decomposed with the combination of a pseudobulge, a disc and a ring component indicative of a late-type galaxy (Olguín-Iglesias et al. 2017), while a bulge component with a large Sérsic index (n = 3.7), typical for a elliptical galaxy, is found (D’Ammando et al. 2017). In addition, studies on PKS 2004−447 as well as SDSS J211853.33−073214.3 reveal pseudobulges (Kotilainen et al. 2016; Paliya et al. 2020). In view of the controversy, an investigation of host galaxy morphology of candidate B is helpful. Discrepancies in BH masses from different estimation approaches has been noticed (Baldi et al. 2016; Berton et al. 2021). If sources with small inclination angles such as the γ-NLS1s possess a flattened BLR, the BH masses induced by the emission line widths can be seriously underestimated. A reliable measurement of the bulge luminosity of candidate B would set an independent constraint and is crucial to understanding its nature. Future optical spectropolarimetry observations will also help to distinguish these two scenarios.
In summary, we have performed thorough investigations of the γ-ray source 4FGL 0959.6+4606, as well as its two potential low-energy counterparts. They both fall into the γ-ray localisation uncertainty area corresponding to the entire 13.8 years of Fermi-LAT data. Re-analysis of the SDSS spectrum of candidate B confirms that it is an NLS1. Infrared flux descents of 0.5 mag of candidate A are detected, while brightenings of 2.5 mag are observed for candidate B. γ-ray light curves of 4FGL 0959.6+4606 reveal a flux enhancement in an epoch of 15 months. No infrared activities of candidate A are found. However, a temporally coincident infrared brightening of candidate B appears. An individual analysis of the Fermi-LAT data, representative of the high-flux γ-ray state, yields a significant γ-ray source (TS = 43). At this time, only candidate B is embraced by the γ-ray localisation uncertainty area. The association relationship between candidate B and 4FGL 0959.6+4606 is supported with respect to both temporal and spatial evidences. Therefore, we conclude that candidate B is likely a γ-NLS1. In addition to the γ-ray and infrared data, multi-wavelength data are collected and analysed to construct a broadband SED of the RLNLS1 for the high-flux state. The single-zone homogeneous leptonic jet modelling provides an acceptable description of the SED. The jet properties of candidate B are found to be comparable with those of known γ-NLS1s. Future high resolution imaging observations will reveal its host galaxy morphology and revisit its BH mass estimation.
Acknowledgments
We appreciate the instructive suggestions from the anonymous referee. This research has made use of data obtained from the High Energy Astrophysics Science Archive Research Center (HEASARC), provided by NASA’s Goddard Space Flight Center. This research makes use of data products from the Wide-field Infrared Survey Explorer, which is a joint project of the University of California, Los Angeles, and the Jet Propulsion Laboratory/California Institute of Technology, funded by the National Aeronautics and Space Administration. This research also makes use of data products from NEOWISE-R, which is a project of the Jet Propulsion Laboratory/California Institute of Technology, funded by the Planetary Science Division of the National Aeronautics and Space Administration. This work was supported in part by the NSFC under grants 11703093, U2031120, 12103048, 11833007 and 12233008, as well as the Project funded by China Postdoctoral Science Foundation: 2020M682013. This work was also supported in part by the Special Natural Science Fund of Guizhou University (grant no. 201911A) and the First-class Physics Promotion Programme (2019) of Guizhou University. S.C. acknowledges support by the Israel Science Foundation (grant no. 1008/18) and a Center of Excellence of the Israel Science Foundation (grant no. 2752/19).
References
- Abdo, A. A., Ackermann, M., Ajello, M., et al. 2009a, ApJ, 699, 976 [CrossRef] [Google Scholar]
- Abdo, A. A., Ackermann, M., Ajello, M., et al. 2009b, ApJ, 707, L142 [NASA ADS] [CrossRef] [Google Scholar]
- Abdo, A. A., Ackermann, M., Ajello, M., et al. 2010a, Science, 328, 725 [NASA ADS] [CrossRef] [Google Scholar]
- Abdo, A. A., Ackermann, M., Ajello, M., et al. 2010b, ApJ, 720, 912 [NASA ADS] [CrossRef] [Google Scholar]
- Abdo, A. A., Ackermann, M., Agudo, I., et al. 2010c, ApJ, 716, 30 [NASA ADS] [CrossRef] [Google Scholar]
- Abdollahi, S., Acero, F., Baldini, L., et al. 2022, ApJS, 260, 53 [NASA ADS] [CrossRef] [Google Scholar]
- Ahlers, M., & Halzen, F. 2015, Rep. Progr. Phys., 78, 126901 [CrossRef] [Google Scholar]
- Ahumada, R., Prieto, C. A., Almeida, A., et al. 2020, ApJS, 249, 3 [Google Scholar]
- Ajello, M., Angioni, R., Axelsson, M., et al. 2020, ApJ, 892, 105 [NASA ADS] [CrossRef] [Google Scholar]
- Antón, S., Browne, I. W. A., & Marchã, M. J. 2008, A&A, 490, 583 [NASA ADS] [CrossRef] [EDP Sciences] [Google Scholar]
- Atwood, W. B., Abdo, A. A., Ackermann, M., et al. 2009, ApJ, 697, 1071 [CrossRef] [Google Scholar]
- Baldi, R. D., Capetti, A., Robinson, A., Laor, A., & Behar, E. 2016, MNRAS, 458, L69 [NASA ADS] [CrossRef] [Google Scholar]
- Bentz, M. C., Denney, K. D., Grier, C. J., et al. 2013, ApJ, 767, 149 [Google Scholar]
- Berton, M., Braito, V., Mathur, S., et al. 2019, A&A, 632, A120 [NASA ADS] [CrossRef] [EDP Sciences] [Google Scholar]
- Berton, M., Peluso, G., Marziani, P., et al. 2021, A&A, 654, A125 [NASA ADS] [CrossRef] [EDP Sciences] [Google Scholar]
- Blandford, R. D., & Rees, M. J. 1978, in BL Lac Objects, ed. A. M. Wolfe, 328 [Google Scholar]
- Blandford, R., Meier, D., & Readhead, A. 2019, ARA&A, 57, 467 [NASA ADS] [CrossRef] [Google Scholar]
- Błażejowski, M., Sikora, M., Moderski, R., & Madejski, G. M. 2000, ApJ, 545, 107 [Google Scholar]
- Boller, T., Brandt, W. N., & Fink, H. 1996, A&A, 305, 53 [NASA ADS] [Google Scholar]
- Boroson, T. A. 2002, ApJ, 565, 78 [NASA ADS] [CrossRef] [Google Scholar]
- Boroson, T. A., & Green, R. F. 1992, ApJS, 80, 109 [Google Scholar]
- Böttcher, M., Reimer, A., Sweeney, K., & Prakash, A. 2013, ApJ, 768, 54 [Google Scholar]
- Cash, W. 1979, ApJ, 228, 939 [Google Scholar]
- Chen, L. 2018, ApJS, 235, 39 [NASA ADS] [CrossRef] [Google Scholar]
- Chen, L., & Bai, J. M. 2011, ApJ, 735, 108 [NASA ADS] [CrossRef] [Google Scholar]
- D’Abrusco, R., Massaro, F., Ajello, M., et al. 2012, ApJ, 748, 68 [CrossRef] [Google Scholar]
- D’Ammando, F., Orienti, M., Finke, J., et al. 2012, MNRAS, 426, 317 [Google Scholar]
- D’Ammando, F., Orienti, M., Doi, A., et al. 2013, MNRAS, 433, 952 [CrossRef] [Google Scholar]
- D’Ammando, F., Orienti, M., Larsson, J., & Giroletti, M. 2015a, MNRAS, 452, 520 [CrossRef] [Google Scholar]
- D’Ammando, F., Orienti, M., Finke, J., et al. 2015b, MNRAS, 446, 2456 [Google Scholar]
- D’Ammando, F., Orienti, M., Finke, J., et al. 2016, MNRAS, 463, 4469 [Google Scholar]
- D’Ammando, F., Acosta-Pulido, J. A., Capetti, A., et al. 2017, MNRAS, 469, L11 [CrossRef] [Google Scholar]
- Decarli, R., Dotti, M., Fontana, M., & Haardt, F. 2008, MNRAS, 386, L15 [NASA ADS] [Google Scholar]
- Dermer, C. D., & Schlickeiser, R. 1993, ApJ, 416, 458 [Google Scholar]
- Dondi, L., & Ghisellini, G. 1995, MNRAS, 273, 583 [NASA ADS] [Google Scholar]
- Foschini, L., Berton, M., Caccianiga, A., et al. 2015, A&A, 575, A13 [NASA ADS] [CrossRef] [EDP Sciences] [Google Scholar]
- Franckowiak, A., Garrappa, S., Paliya, V., et al. 2020, ApJ, 893, 162 [Google Scholar]
- Frank, J., King, A., & Raine, D. J. 2002, Accretion Power in Astrophysics, 3rd edn. (Cambridge: Cambridge University Press) [Google Scholar]
- Gehrels, N., Chincarini, G., Giommi, P., et al. 2004, ApJ, 611, 1005 [Google Scholar]
- Ghisellini, G., Tavecchio, F., Foschini, L., et al. 2012, MNRAS, 425, 1371 [NASA ADS] [CrossRef] [Google Scholar]
- Gokus, A., Paliya, V. S., Wagner, S. M., et al. 2021, A&A, 649, A77 [NASA ADS] [CrossRef] [EDP Sciences] [Google Scholar]
- Grandi, P., Torresi, E., & Stanghellini, C. 2012, ApJ, 751, L3 [NASA ADS] [CrossRef] [Google Scholar]
- Gu, M., Chen, Y., Komossa, S., et al. 2015, ApJS, 221, 3 [NASA ADS] [CrossRef] [Google Scholar]
- Guo, H., Shen, Y., & Wang, S. 2018, Astrophysics Source Code Library [record ascl:1809.008] [Google Scholar]
- Helfand, D. J., White, R. L., & Becker, R. H. 2015, ApJ, 801, 26 [NASA ADS] [CrossRef] [Google Scholar]
- HI4PI Collaboration (Ben Bekhti, N., et al.) 2016, A&A, 594, A116 [NASA ADS] [CrossRef] [EDP Sciences] [Google Scholar]
- IceCube Collaboration (Aartsen, M. G., et al.) 2018, Science, 361, eaat1378 [NASA ADS] [Google Scholar]
- Ivezić, Ž., Kahn, S. M., Tyson, J. A., et al. 2019, ApJ, 873, 111 [Google Scholar]
- Jiang, N., Zhou, H.-Y., Ho, L. C., et al. 2012, ApJ, 759, L31 [NASA ADS] [CrossRef] [Google Scholar]
- Kellermann, K. I., Sramek, R., Schmidt, M., Shaffer, D. B., & Green, R. 1989, AJ, 98, 1195 [Google Scholar]
- Komossa, S., Voges, W., Xu, D., et al. 2006, AJ, 132, 531 [NASA ADS] [CrossRef] [Google Scholar]
- Kotilainen, J. K., León-Tavares, J., Olguín-Iglesias, A., et al. 2016, ApJ, 832, 157 [CrossRef] [Google Scholar]
- Lacy, M., Baum, S. A., Chandler, C. J., et al. 2020, PASP, 132, 035001 [Google Scholar]
- Laor, A. 2000, ApJ, 543, L111 [NASA ADS] [CrossRef] [Google Scholar]
- León Tavares, J., Kotilainen, J., Chavushyan, V., et al. 2014, ApJ, 795, 58 [Google Scholar]
- Liao, N.-H., Dou, L.-M., Jiang, N., et al. 2019, ApJ, 879, L9 [NASA ADS] [CrossRef] [Google Scholar]
- Liao, N.-H., Sheng, Z.-F., Jiang, N., et al. 2022, ApJ, 932, L25 [NASA ADS] [CrossRef] [Google Scholar]
- Liodakis, I., Marchili, N., Angelakis, E., et al. 2017, MNRAS, 466, 4625 [NASA ADS] [CrossRef] [Google Scholar]
- Lou, Z., Liang, M., Yao, D., et al. 2016, Proc. SPIE, 10154, 101542A [NASA ADS] [CrossRef] [Google Scholar]
- Lu, H., Zhou, H., Wang, J., et al. 2006, AJ, 131, 790 [Google Scholar]
- Madejski, G. G., & Sikora, M. 2016, ARA&A, 54, 725 [NASA ADS] [CrossRef] [Google Scholar]
- Mainzer, A., Bauer, J., Cutri, R. M., et al. 2014, ApJ, 792, 30 [Google Scholar]
- Mao, L., & Yi, T. 2021, ApJS, 255, 10 [NASA ADS] [CrossRef] [Google Scholar]
- Maraschi, L., Ghisellini, G., & Celotti, A. 1992, ApJ, 397, L5 [CrossRef] [Google Scholar]
- Mattox, J. R., Bertsch, D. L., Chiang, J., et al. 1996, ApJ, 461, 396 [Google Scholar]
- Morganti, R., Holt, J., Tadhunter, C., et al. 2011, A&A, 535, A97 [NASA ADS] [CrossRef] [EDP Sciences] [Google Scholar]
- Ohta, K., Aoki, K., Kawaguchi, T., & Kiuchi, G. 2007, ApJS, 169, 1 [NASA ADS] [CrossRef] [Google Scholar]
- Olguín-Iglesias, A., Kotilainen, J. K., León Tavares, J., Chavushyan, V., & Añorve, C. 2017, MNRAS, 467, 3712 [NASA ADS] [Google Scholar]
- Padovani, P., & Giommi, P. 1995, ApJ, 444, 567 [NASA ADS] [CrossRef] [Google Scholar]
- Paliya, V. S., Ajello, M., Rakshit, S., et al. 2018, ApJ, 853, L2 [NASA ADS] [CrossRef] [Google Scholar]
- Paliya, V. S., Pérez, E., García-Benito, R., et al. 2020, ApJ, 892, 133 [CrossRef] [Google Scholar]
- Peña-Herazo, H. A., Paggi, A., García-Pérez, A., et al. 2021, AJ, 162, 177 [CrossRef] [Google Scholar]
- Planck Collaboration XVI. 2014, A&A, 571, A16 [NASA ADS] [CrossRef] [EDP Sciences] [Google Scholar]
- Pogge, R. W. 2000, New Astron. Rev., 44, 381 [CrossRef] [Google Scholar]
- Rakshit, S., Stalin, C. S., Chand, H., & Zhang, X.-G. 2017, ApJS, 229, 39 [Google Scholar]
- Rakshit, S., Schramm, M., Stalin, C. S., et al. 2021, MNRAS, 504, L22 [NASA ADS] [CrossRef] [Google Scholar]
- Runnoe, J. C., Brotherton, M. S., & Shang, Z. 2012, MNRAS, 422, 478 [Google Scholar]
- Schlafly, E. F., & Finkbeiner, D. P. 2011, ApJ, 737, 103 [Google Scholar]
- Seibert, M., Wyder, T., Neill, J., et al. 2012, Am. Astron. Soc. Meet. Abstr., 219, 340.01 [Google Scholar]
- Shakura, N. I., & Sunyaev, R. A. 1973, A&A, 24, 337 [NASA ADS] [Google Scholar]
- Shen, Y., Greene, J. E., Strauss, M. A., Richards, G. T., & Schneider, D. P. 2008, ApJ, 680, 169 [Google Scholar]
- Shen, Y., Richards, G. T., Strauss, M. A., et al. 2011, ApJS, 194, 45 [Google Scholar]
- Sheng, Z., Wang, T., Jiang, N., et al. 2017, ApJ, 846, L7 [NASA ADS] [CrossRef] [Google Scholar]
- Sheng, Z., Wang, T., Jiang, N., et al. 2020, ApJ, 889, 46 [NASA ADS] [CrossRef] [Google Scholar]
- Sikora, M., Begelman, M. C., & Rees, M. J. 1994, ApJ, 421, 153 [Google Scholar]
- Sikora, M., Stawarz, Ł., & Lasota, J.-P. 2007, ApJ, 658, 815 [NASA ADS] [CrossRef] [Google Scholar]
- Skrutskie, M. F., Cutri, R. M., Stiening, R., et al. 2006, AJ, 131, 1163 [NASA ADS] [CrossRef] [Google Scholar]
- Tanaka, Y. T., Doi, A., Inoue, Y., et al. 2015, ApJ, 799, L18 [NASA ADS] [CrossRef] [Google Scholar]
- Tavecchio, F., Ghisellini, G., Bonnoli, G., & Ghirlanda, G. 2010, MNRAS, 405, L94 [NASA ADS] [CrossRef] [Google Scholar]
- Ulrich, M.-H., Maraschi, L., & Urry, C. M. 1997, ARA&A, 35, 445 [NASA ADS] [CrossRef] [Google Scholar]
- Vestergaard, M., & Wilkes, B. J. 2001, ApJS, 134, 1 [Google Scholar]
- Wang, T., Brinkmann, W., & Bergeron, J. 1996, A&A, 309, 81 [NASA ADS] [Google Scholar]
- Wang, Z.-J., Wang, Z.-R., Liu, R.-Y., & Wang, J. 2023, ApJ, 942, 51 [NASA ADS] [CrossRef] [Google Scholar]
- WISE Team 2019, AllWISE Source Catalog [Google Scholar]
- WISE Team 2020, NEOWISE 2-Band Post-Cryo Single Exposure (L1b) Source Table [Google Scholar]
- Wright, E. L., Eisenhardt, P. R. M., Mainzer, A. K., et al. 2010, AJ, 140, 1868 [Google Scholar]
- Yang, H., Yuan, W., Yao, S., et al. 2018, MNRAS, 477, 5127 [NASA ADS] [CrossRef] [Google Scholar]
- Yao, S., Yuan, W., Zhou, H., et al. 2015, MNRAS, 454, L16 [NASA ADS] [CrossRef] [Google Scholar]
- Yao, S., Komossa, S., Liu, W.-J., et al. 2019, MNRAS, 487, L40 [NASA ADS] [CrossRef] [Google Scholar]
- Yuan, W., Zhou, H. Y., Komossa, S., et al. 2008, ApJ, 685, 801 [NASA ADS] [CrossRef] [Google Scholar]
- Zhou, H.-Y., Wang, T.-G., Dong, X.-B., Zhou, Y.-Y., & Li, C. 2003, ApJ, 584, 147 [NASA ADS] [CrossRef] [Google Scholar]
- Zhou, H., Wang, T., Yuan, W., et al. 2007, ApJ, 658, L13 [NASA ADS] [CrossRef] [Google Scholar]
All Tables
VLASS and FIRST frequencies, angular resolutions, radio integrated and peak flux densities, and background noise.
All Figures
|
Fig. 1. γ-ray, half-year, time-bin light curve of 4FGL J0959.6+4606 and infrared light curves of candidate A and candidate B. Blue circles represent the γ-ray fluxes, while the red triangles are upper limits. Red bars are the corresponding TS values. The yellow region marks the epoch corresponding to high flux state of 4FGL J0959.6+4606, identified by a further monthly time-bin light curve, see Fig. 2. |
| In the text | |
|
Fig. 2. Monthly time-bin γ-ray light curve of 4FGL J0959.6+4606, focusing on the epoch of > MJD 57500. The yellow region, with a time length of 15-month in total, represents the high γ-ray flux state. |
| In the text | |
|
Fig. 3. Smoothed γ-ray residual (i.e. 4FGL 0959.6+4606 is not included in the analysis model file) TS map with a scale of 1.5° ×1.5° and 0.03° per pixel, extracted from the 15-month Fermi-LAT data. The green and cyan circles correspond to the 95% C.L. γ-ray localisation uncertainty region of the 15-month period and entire data set, respectively. The green and pink X-shaped markers are radio positions of candidate B and candidate A, respectively. |
| In the text | |
|
Fig. 4. 15-month time-bin γ-ray light curve of 4FGL J0959.6+4606. Blue circles represent the γ-ray fluxes, while the red triangles are upper limits. Red bars are the corresponding TS values. The seventh bin corresponds to the yellow region in Fig. 2. The green star is the γ-ray flux from the first 7.5 years of data. |
| In the text | |
|
Fig. 5. SDSS spectrum of candidate B. The red line corresponds to the combination of all components. The green, brown, blue, and orange lines represent the descriptions of host galaxy, power-law continuum, Lorentzian profile of Hβ, as well as the [O III] doublet, respectively. |
| In the text | |
|
Fig. 6. SED in high flux state of SDSS J095909.51+460014.3 along with the theoretical descriptions. Archival SED data of PKS 1502+036 (Abdo et al. 2009b) were also plotted for comparison. Un-simultaneous data were coloured in grey. The red line represents the description of the big blue bump, with Ld = 8 × 1044 erg s−1 (∼0.4 Ledd) and MBH = 6.8 × 10⁶ M⊙. |
| In the text | |
|
Fig. 7. Comparison between SDSS J095909.51+460014.3 and other γ-NLS1s. K-corrections for the luminosities have been applied. Luminosity of the target is based on the analysis of the 15-month Fermi-LAT data. For other sources, each luminosity value is calculated from energy flux of the time bin with the highest flux level in archival yearly bin light curve (Abdollahi et al. 2022). |
| In the text | |
Current usage metrics show cumulative count of Article Views (full-text article views including HTML views, PDF and ePub downloads, according to the available data) and Abstracts Views on Vision4Press platform.
Data correspond to usage on the plateform after 2015. The current usage metrics is available 48-96 hours after online publication and is updated daily on week days.
Initial download of the metrics may take a while.