Open Access
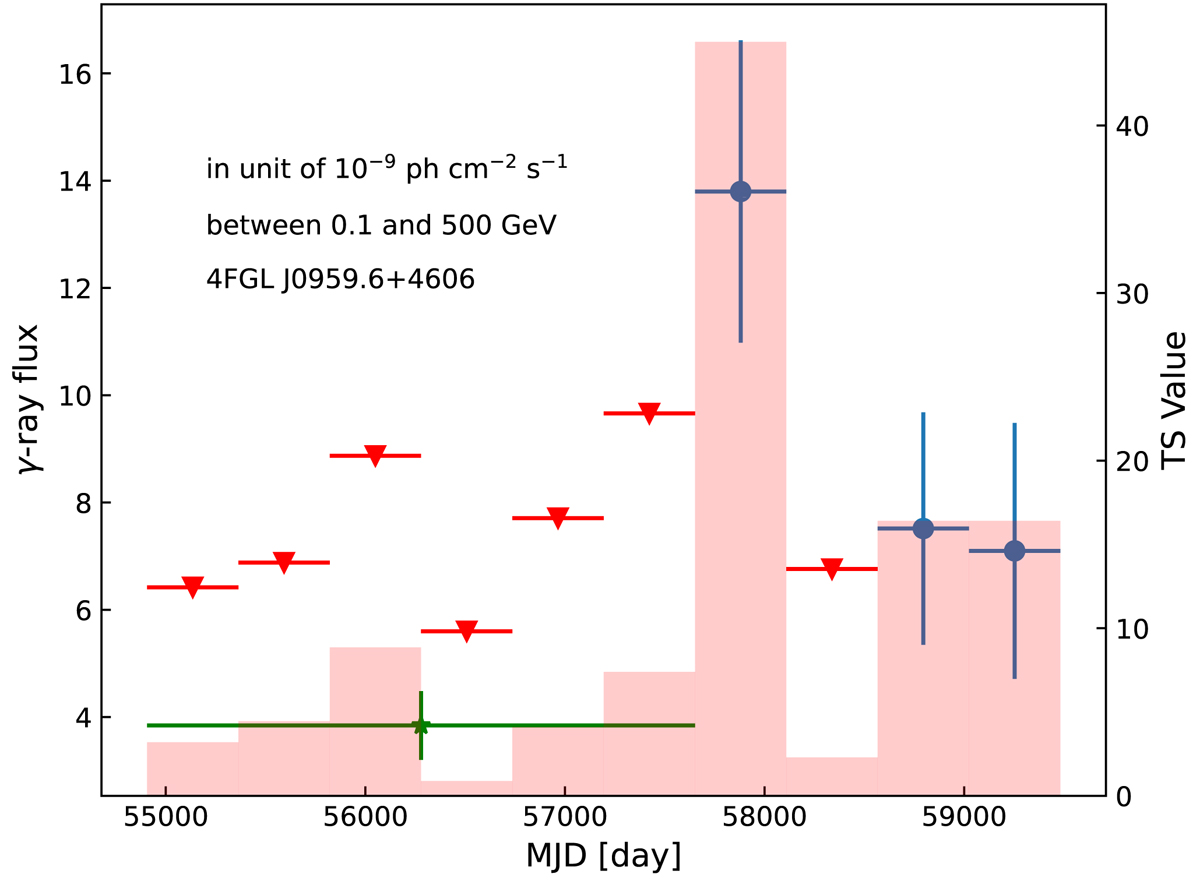
Fig. 4.
Download original image
15-month time-bin γ-ray light curve of 4FGL J0959.6+4606. Blue circles represent the γ-ray fluxes, while the red triangles are upper limits. Red bars are the corresponding TS values. The seventh bin corresponds to the yellow region in Fig. 2. The green star is the γ-ray flux from the first 7.5 years of data.
Current usage metrics show cumulative count of Article Views (full-text article views including HTML views, PDF and ePub downloads, according to the available data) and Abstracts Views on Vision4Press platform.
Data correspond to usage on the plateform after 2015. The current usage metrics is available 48-96 hours after online publication and is updated daily on week days.
Initial download of the metrics may take a while.