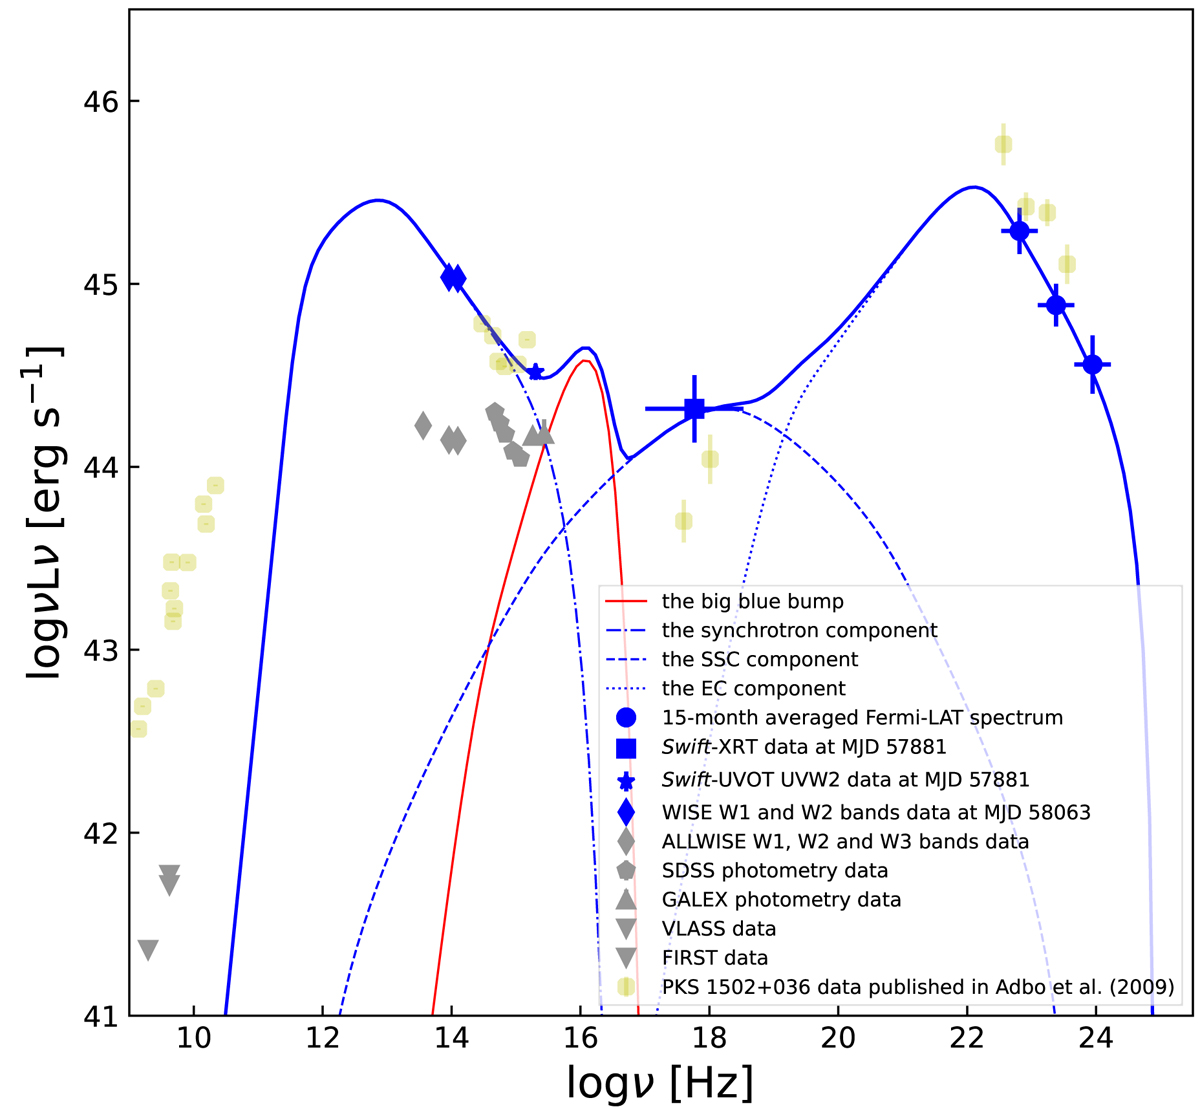
Fig. 6.
Download original image
SED in high flux state of SDSS J095909.51+460014.3 along with the theoretical descriptions. Archival SED data of PKS 1502+036 (Abdo et al. 2009b) were also plotted for comparison. Un-simultaneous data were coloured in grey. The red line represents the description of the big blue bump, with Ld = 8 × 1044 erg s−1 (∼0.4 Ledd) and MBH = 6.8 × 10⁶ M⊙.
Current usage metrics show cumulative count of Article Views (full-text article views including HTML views, PDF and ePub downloads, according to the available data) and Abstracts Views on Vision4Press platform.
Data correspond to usage on the plateform after 2015. The current usage metrics is available 48-96 hours after online publication and is updated daily on week days.
Initial download of the metrics may take a while.