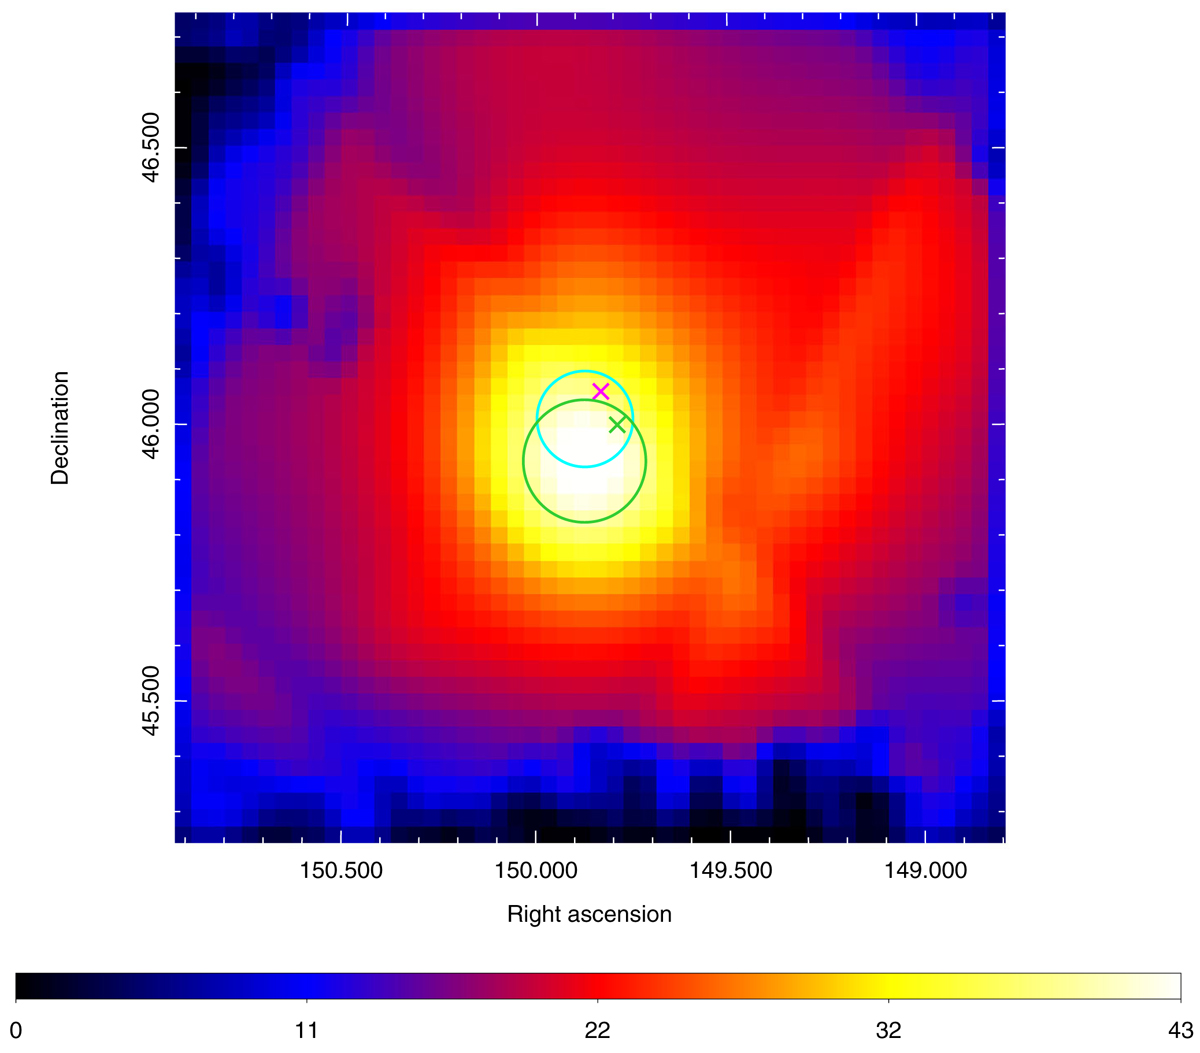
Fig. 3.
Download original image
Smoothed γ-ray residual (i.e. 4FGL 0959.6+4606 is not included in the analysis model file) TS map with a scale of 1.5° ×1.5° and 0.03° per pixel, extracted from the 15-month Fermi-LAT data. The green and cyan circles correspond to the 95% C.L. γ-ray localisation uncertainty region of the 15-month period and entire data set, respectively. The green and pink X-shaped markers are radio positions of candidate B and candidate A, respectively.
Current usage metrics show cumulative count of Article Views (full-text article views including HTML views, PDF and ePub downloads, according to the available data) and Abstracts Views on Vision4Press platform.
Data correspond to usage on the plateform after 2015. The current usage metrics is available 48-96 hours after online publication and is updated daily on week days.
Initial download of the metrics may take a while.