Open Access
Fig. 2.
Download original image
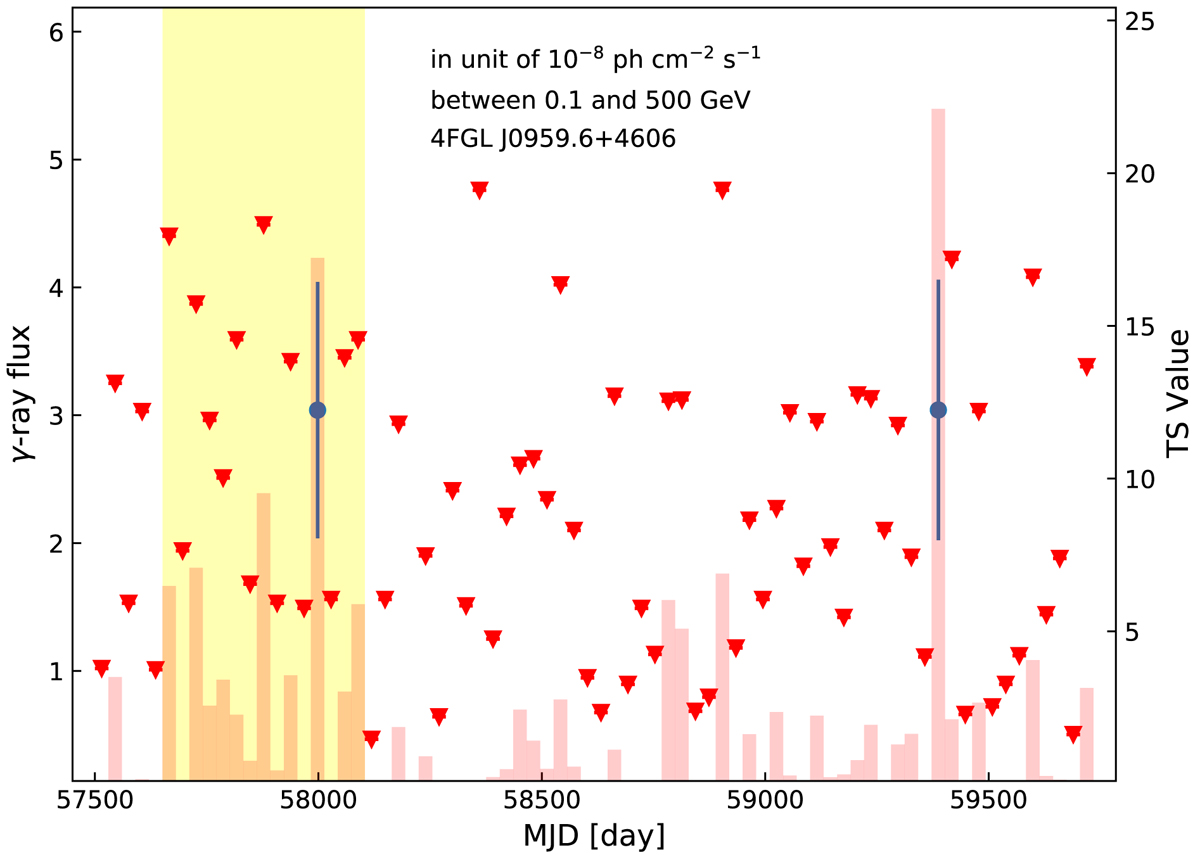
Monthly time-bin γ-ray light curve of 4FGL J0959.6+4606, focusing on the epoch of > MJD 57500. The yellow region, with a time length of 15-month in total, represents the high γ-ray flux state.
Current usage metrics show cumulative count of Article Views (full-text article views including HTML views, PDF and ePub downloads, according to the available data) and Abstracts Views on Vision4Press platform.
Data correspond to usage on the plateform after 2015. The current usage metrics is available 48-96 hours after online publication and is updated daily on week days.
Initial download of the metrics may take a while.