| Issue |
A&A
Volume 676, August 2023
|
|
|---|---|---|
| Article Number | A35 | |
| Number of page(s) | 20 | |
| Section | Extragalactic astronomy | |
| DOI | https://doi.org/10.1051/0004-6361/202245173 | |
| Published online | 02 August 2023 | |
Star formation in a massive spiral galaxy with a radio-AGN
1
Université de la Côte d’Azur, Observatoire de la Côte d’Azur, CNRS, Laboratoire Lagrange, Bd de l’Observatoire, CS 34229, 06304 Nice cedex 4, France
e-mail: This email address is being protected from spambots. You need JavaScript enabled to view it.
2
Inter-University Centre for Astronomy and Astrophysics, Post Bag 4, Pune 411007, India
3
University of Tsukuba, Center for Computational Sciences, Tennodai 1-1-1, 305-0006 Tsukuba, Ibaraki, Japan
4
Research School of Astronomy and Astrophysics, The Australian National University, Canberra, ACT 2611, Australia
5
Max-Planck Institut für Astronomie, Königstuhl 17, 69117 Heidelberg, Germany
6
Observatoire de Paris, LERMA, Collège de France, CNRS, PSL University, Sorbonne University, Paris, France
7
Jet Propulsion Laboratory, California Institute of Technology, 4800 Oak Grove Dr., Pasadena, CA 91109, USA
8
Department of Astronomy, California Institute of Technology, 1216 E California Blvd., Pasadena, CA 91125, USA
9
Department of Physics & Electronics, CHRIST (Deemed to be University), Hosur Road, Bengaluru 560029, India
Received:
10
October
2022
Accepted:
17
February
2023
Abstract
We present an analysis of new VLT/MUSE optical imaging spectroscopic data of 2MASX J23453268–0449256 (J2345–0449), a nearby (z = 0.0755) massive (Mstellar = 4 × 10¹¹ M⊙) spiral galaxy. This is a particularly interesting source for a study of active galactic nucleus (AGN) feedback since it hosts two pairs of bright, giant radio jets and a massive, luminous X-ray halo, but it has no massive bulge. The galaxy has a 24 kpc wide ring of molecular gas, and a source-averaged star formation rate that is factors 30 to 70 lower than expected from the Kennicutt-Schmidt law. With MUSE, we have analyzed the stellar continuum and bright optical line emission and have constrained the spatially resolved past and present star formation on scales of approximately 1 kpc. More than 93% of the stellar mass formed ≥10 Gyrs ago including in the disk. Optical emission from the AGN is very faint and contributes 2% of the continuum around the nucleus at most. Most line emission is predominantly excited by shocks and old stellar populations except in 13 young star-forming regions that formed ≤11 Myrs ago, of which only seven are associated with the molecular ring (the others are at larger radii). They avoid a region of high electron densities aligned with the radio source, and form stars at efficiencies that are comparable to those in normal spiral galaxies. We discuss the implications of our findings for the regulation of star formation in galaxies through AGN feedback in the absence of competing mechanisms related to the presence of a massive stellar bulge, such as morphological quenching.
Key words: galaxies: evolution / galaxies: jets / galaxies: active
© The Authors 2023
 Open Access article, published by EDP Sciences, under the terms of the Creative Commons Attribution License (https://creativecommons.org/licenses/by/4.0), which permits unrestricted use, distribution, and reproduction in any medium, provided the original work is properly cited.
This article is published in open access under the Subscribe to Open model. This email address is being protected from spambots. You need JavaScript enabled to view it. to support open access publication.
1. Introduction
Most leading cosmological simulations of galaxy evolution postulate that feedback from active galactic nuclei (AGN) plays an important role in regulating the gas cooling, fragmentation, and ensuing star formation in massive galaxies (e.g., Croton et al. 2006; Dubois et al. 2014; Weinberger et al. 2017; Torrey et al. 2020; Wright & Lagos 2020; Donnari et al. 2021). Even a small fraction (a few tenths of a percent) of the accretion energy onto a supermassive black hole would be sufficient to unbind most of the interstellar gas of a massive galaxy (e.g., Silk & Rees 1998).
However, the mechanisms regulating this energy deposition are not well understood. While many observations confirm the presence of outflows in AGN host galaxies (Morganti et al. 2005, 2015; Hardcastle et al. 2007; Nesvadba et al. 2008, 2017; Mahony et al. 2013; Nyland et al. 2013; Liu et al. 2013; Menci et al. 2019; Harrison et al. 2014; Fiore et al. 2017; Komossa et al. 2018; Zovaro et al. 2019; Santoro et al. 2020), the physical link between this energy injection and star formation – the core component of the AGN feedback hypothesis – is much more difficult to establish. Many galaxies with strong AGN-driven outflows do not exhibit the concomitant signatures of a star formation deficit compared to galaxies that do not host AGN, with the exception of a small number of nearby radio galaxies (Ogle et al. 2010; Nesvadba et al. 2010; Alatalo et al. 2015; Lanz et al. 2016). These have star formation rates that fall 1–2 orders of magnitude short of those found in normal star-forming galaxies at similar gas-mass surface densities, potentially indicating an unusually low star formation efficiency (e.g., Nesvadba et al. 2010; Ogle et al. 2010; Alatalo et al. 2015; Lanz et al. 2016). Meanwhile, recent results of relativistic hydrodydnamic simulations suggest that turbulence injected by radio jets into surrounding gas disks may indeed lower the efficiency with which stars form (Mandal et al. 2021), when adopting the theoretical framework of turbulence-regulated star formation of Federrath & Klessen (2012).
The fraction of nuclear radio sources rapidly increases with stellar mass. Sabater et al. (2019) find that low-power radio sources become near-ubiquitous in galaxies with stellar masses Mstellar ≥ 1011 M⊙; however, the great majority of these radio sources are much less powerful than those in the well-studied powerful targets on which observations have so far focused. Moreover, in this mass range, AGN feedback is not the only mechanism that has been proposed to explain the quenching of star formation (e.g., Saintonge et al. 2012). The great majority of these galaxies are also of an early morphological type, dominated by massive bulges, where high stellar mass surface densities (Dekel & Burkert 2014; Romeo & Fathi 2016) and stellar spheroidal morphology itself may limit the rates at which stars form. As argued by Martig et al. (2009) and Gensior et al. (2020), the steep gravitational potential gradient in massive bulges may increase the shear of gas falling toward the center, increase gas turbulence and lower the star formation rate. This makes it difficult to relate a deficit in star formation uniquely to the energy injection of a radio AGN.
One way to overcome this difficulty is by studying the relationship between radio jets, gas turbulence, and star formation in galaxies that have bright radio jets, but no massive bulge. Such galaxies are however very rare. For example, Singh et al. (2015) found only four such galaxies in a sample of nearly 200 000 galaxies with the NRAO VLA Sky Survey (NVSS) and the Faint Images of the Radio Sky at Twenty-cm (FIRST) radio counterparts.
A specific fortuitous target for such a study is the nearby (z = 0.0755) spiral galaxy 2MASX J23453268–0449256 (J2345–0449 hereafter). J2345–0449 is a massive galaxy first mentioned in the literature by Machalski et al. (2007) with a stellar mass of Mstellar = 4 × 10¹¹ M⊙ (Walker et al. 2015; Nesvadba et al. 2021) and 2 × 10¹⁰ M⊙ of cold molecular gas (Dabhade et al. 2020; Nesvadba et al. 2021). It is one of the most massive spiral galaxies in the nearby universe (Posti et al. 2019; Ogle et al. 2019), with an unusually low-mass bulge for this mass range, contributing < 15% of the total stellar mass (Bagchi et al. 2014). Also highly unusual for a late-type spiral galaxy are its mega-parsec-scale radio jets with a total power of P1.4 GHz = 2.5 × 1024 W Hz−1. These were first described by Bagchi et al. (2014), who identified two pairs of lobes with sizes of 390 kpc and 1.6 Mpc, respectively, which are indicative of repeated jet activity over a long timescale. J2345–0449 also has a luminous, massive (Mirakhor et al. 2021, MX = 8.25 × 10¹¹ M⊙) halo of hot X-ray emitting gas extending out to 80 kpc (Walker et al. 2015) with an oblate morphology potentially due to jet-inflated cavities (Walker et al. 2015). Mirakhor et al. (2021) estimated that the baryon fraction in this halo is near the cosmic baryon density, significantly higher than in other galaxies of a similar mass, which are mainly early-type galaxies. Spiral galaxies of an equal mass also have high baryon fractions; however, most of their baryons are in stellar mass, not in the X-ray halo (Posti et al. 2019).
The combined absences of a massive bulge, significant radiative nuclear activity, and of a massive nearby neighbor (Bagchi et al. 2014) make J2345−0449 an excellent target to study the interplay between radio jets and surrounding gas, because competing mechanisms related to stellar mass, radiative AGN feedback, and environment are not present. Moreover, the presence of a 16″ wide, spatially well-resolved molecular ring associated with the stellar disk makes this galaxy an excellent target to study the spatially resolved interaction of radio jets, molecular gas, and star formation. We have therefore started a detailed multiwavelength follow-up of J2345−0449 with a global analysis of the molecular gas and star formation properties (Nesvadba et al. 2021). We placed constraints on the unobscured and obscured star formation using low-resolution photometric data obtained with the Galaxy Evolution Explorer (GALEX) in the UV and the Wide-field Infrared Survey Explorer (WISE) at 22 μm. However, we had no arcsecond-resolution data to constrain, for example, the star formation history and the local star formation rate densities. To provide such constraints, we used the Multi-Unit Spectroscopic Explorer (MUSE) of the Very Large Telescope (VLT). Here we present a detailed analysis of optical imaging spectroscopy as well as a detailed description of the gas-heating processes and other optical spectroscopic properties of the bulge and disk in this outstanding source. We also advance the proposition that regions of high electron density and reduced star formation in J2345–0449 represent regions where the jets significantly interact with the interstellar medium (ISM).
The paper is organized as follows: First, in Sect. 2, we present the observations and data reduction, before describing our analysis of the stellar continuum and providing an upper limit on the bolometric luminosity of the AGN in Sect. 3. We discuss the emission-line diagnostics in Sect. 4, as well as our estimates of the electron densities and optical extinction. In Sect. 5 we investigate the past and present star formation in J2345−0449, and demonstrate that most stars were formed at least 10 Gyrs ago. We also estimate the current global star formation rate of the galaxy and investigate the properties of individual star forming regions in more detail in Sect. 6. We subsequently extract the kinematic properties of the warm ionized gas in Sect. 7, and use KINEMETRY to show that the gas velocities are dominated by disk rotation. We also investigate the expected signatures of a jet-driven outflow rising from a rotating disk by performing the same analysis for a simulated velocity map. In Sect. 8 we interpret our findings in light of jet-driven AGN feedback and the regulation of star formation in galaxies. Finally, Sect. 9 summarizes our main results.
Throughout the paper we use the flat ΛCDM cosmology from Planck Collaboration VI (2020) with H0 = 67.4 km s−1 Mpc−1, ΩM = 0.315, and ΩΛ = 1 − ΩM. At z = 0.0755, DL is 354.6 Mpc, and one arcsecond corresponds to 1.49 kpc.
2. Observations and data reduction
2.1. VLT/MUSE observations and data reduction
Observations were carried out on June 10, 2021, with the Multi-Unit Spectroscopic Explorer (MUSE) in Service Mode at ESO’s VLT. The program ID is 105.B-0299 (PI Nesvadba). MUSE is an imaging spectrograph with a field-of-view of 1′ × 1′ operating in the optical at wavelengths between 4650 and 9300 Å with a spectral resolving power, R ∼ 2600 at 7000 Å. We used the MUSE/WFM mode with the extended wavelength range and with the adaptive optics as a seeing enhancer. Due to the shutdown of the VLT in 2020 caused by the COVID-19 pandemic, these observations were carried over into period 107. Observing conditions were good and stable. In total we observed the source with four exposures with individual observing times of 600 s on-source, with a total on-source observing time of 2400 s.
Data reduction was done following the prescription given in the MUSE Pipeline User Manual1. ESO makes MUSE raw data and static calibration data available in the archive. We chose the ESO Recipe Execution Tool Esorex, a command-line tool to process the data. The data reduction is organized into two stages. The first stage includes the basic data reduction steps such as the subtraction of bias and dark frames, and flat-fielding, wavelength calibration, and the illumination correction. These steps are done for each individual integral-field unit.
In the second stage, data are converted into physical quantities using the flux calibration and astrometric solution. Finally, the data taken with each exposure and each individual integral-field unit are transformed into a single data cube. The flux scale was set by observing the spectrophotometric standard LTT_7987 right after the science observations. The size of the seeing disk was measured from the size of a foreground star in the field-of-view of MUSE and is FWHM = 1.1″. The spectrum is given in units of 10−20 erg s−1 cm−2 Å−1 for each spectral bin.
2.2. Ancillary data sets
We also used ALMA CO(1–0) observations obtained in ALMA Cycle 7 through program 2019.1.01492.S (PI Nesvadba). The reduction and analysis of these data were previously described by Nesvadba et al. (2021), and we refer the reader to this work for details on the data acquisition, reduction, and analysis. The ALMA and MUSE data do not share the same astrometry, and in particular data sets obtained with the VLT have absolute astrometric uncertainties of about 1″. To register both images within the same coordinate frame, we assumed that the AGN, which can be seen in the 115 GHz continuum observed with ALMA, falls into the center of the bulge of J2345−0449 observed with MUSE.
Moreover, we used low-frequency radio imaging obtained with the Giant Metrewave Radio Telescope (GMRT) obtained at 323 MHz (PI Bagchi). A full analysis of these data will be presented elsewhere (Bagchi et al., in prep.), here we mainly use them to provide an overview of the global radio morphology of this source. Figure 1 shows that radio emission is found mostly along a direction that is nearly north-south (PA = 17°, measured from the north toward the east), with a total extent of 19.9′ on the sky, corresponding to 1.78 Mpc, slightly larger than what has previously been found by Bagchi et al. (2014). The beam size of these data is 10.4″ × 7.2″, along PA = 45.2°.
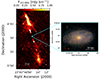 |
Fig. 1. J2345–0449 on mega-parsec and kilo-parsec scales. Left: radio-continuum image of J2345–0449 observed with the GMRT at 323 MHz, and showing the relative position and size of the radio source and host galaxy, which we now probe with MUSE. The local rms noise is 0.1 mJy bm−1. Right: SDSS three-color image showing the g, r, and i-bands, with the MUSE Hα contours shown in orange. Small circles in the lower left corner indicate the size of the seeing disk in each channel of the rgb image. The orange circle shows the size of the seeing disk of the Hα image. |
3. Stellar and AGN continuum emission
We used the publicly available software package Starlight2 (Fernandes et al. 2005) to fit and subsequently subtract the continuum emission from our data cube. Starlight fits the observed spectral energy distributions (SEDs) of galaxies with a linear combination of synthetic SEDs obtained with stellar population synthesis codes, in our case that of Bruzual & Charlot (2003). Using the “Base.BC03.S” set of 150 SEDs provided by the Starlight package is adequate in our case. These spectra cover an age range between 1 Myr and 18 Gyrs, more than the age of the Universe (to account for potential systematic effects), and are calculated for solar metallicity. Extinction was modeled with a Galactic extinction law with RV = 3.1 (Cardelli et al. 1989). The range in velocity dispersion was restricted to vd = 0 − 500 km s−1, somewhat larger than the rotation velocity of 371 ± 26 km s−1 previously measured by Bagchi et al. (2014) from a longslit spectrum taken along the major axis of the galaxy.
We fit the spectra extracted from box apertures with sizes of 3 × 3 pixels, corresponding to 0.6″ × 0.6″, using only wavelengths between 4279 and 7050 Å, that are neither strongly affected by either bright emission lines in our target, nor prominent telluric atmospheric features. We also masked the region around the Na D absorption lines, which may show a combination of stellar and interstellar absorption. The spectral region between 5353 and 5587 Å is affected by the Laser Guide Star, and was also masked in our analysis. We restrict the fitting to pixels with a Hα flux greater than 2 × 10⁻²⁰ erg s−1 cm−2, otherwise, the fitting doesn’t converge. Overall, we find that the stellar continuum in J2345−0449 is well fitted with this approach. χ2 values are typically between 0.7 and 0.9, and fit residuals are less than 15% of the observed flux. We detect stellar continuum emission over 28.3″ along the major axis of the galaxy, corresponding to 42 kpc. The total stellar mass is Mstellar = 3.8 × 10¹¹ M⊙, comparable to the 3.6 × 10¹¹ M⊙ previously found by Nesvadba et al. (2021), the 2.3 × 10¹¹ found by Dabhade et al. (2020) and the 4.6 × 10¹¹ M⊙ initially found by Walker et al. (2015).
J2345−0449 does not show a strong nuclear point source that would indicate a bright optical AGN; therefore, fitting the optical continuum with a combination of purely stellar models can certainly be justified. Nonetheless, we did a separate analysis to quantify the potential contamination from the AGN by adding a number of power law spectra as a function of frequency, ν, Fν ∝ ν−α, to the set of synthetic SEDs, using a number of different slopes, α. These did not improve the χ2 of our fits. At most 2% of the continuum flux extracted from within one PSF from the nucleus of J2345−0449 could potentially come from the AGN, and even less in the integrated spectrum, before systematic offsets between modeled and observed spectrum become significant.
We can use this estimate to constrain the luminosity of the AGN. The integrated continuum luminosity at 5100 Å within a 1.4″ aperture around the nucleus is λL5100 = 1.8 × 1041 erg s−1. Following Netzer (2019), we adopt a bolometric correction of kbol, 5100 = 56.4, which suggests Lbol, AGN < 1 × 1043 erg s−1. If instead we use the central [OIII]5007 luminosity, LOIII = 9.5 × 1039 erg s−1 (Table 1), and the bolometric correction from Heckman et al. (2004), kbol, OIII = 3500, we find Lbol, AGN < 3.3 × 1043 erg s−1. Both values should be considered upper limits because the fluxes are dominated by the stellar populations around the nucleus, given that this is the dominant gas heating source in the nuclear regions of J2345−0449 as indicated by the emission-line diagnostics (Sect. 4). The power of the radio jet, estimated to Ekin, jet = 2 × 1044 erg s−1 by Walker et al. (2015), following Cavagnolo et al. (2010), and Ekin, jet = 1.7 × 1044 erg s−1 by Bagchi et al. (2014), with a different approach, exceeds the bolometric luminosity by at least a factor 7. The radio jet is therefore clearly the energetically dominant mode of AGN activity in this case.
Emission line properties near the nucleus, in the inner disk, that we define as the part of the disk that is associated with the molecular ring, and in the outer disk, i.e., beyond the molecular gas.
4. Emission-line diagnostics
4.1. Methodology
To analyze the spatially resolved emission-line properties of J2345−0449 we extracted spectra from 3 × 3 pixel apertures (corresponding to 0.6″ × 0.6″), which is less than the size of the seeing disk. We extracted spectra from all apertures where Hα was detected at ≥3σ. Before fitting the line emission we subtracted the stellar continuum, using the STARLIGHT fits. We then fit the bright emission lines with Gaussian profiles, finding that a single component was sufficient to approximate the emission lines in most of the galaxy. The mean and dispersion of the Gaussian profiles were used to derive the local velocity and line width in each spatial pixel. Line widths and amplitudes were used to extract the velocity-integrated line flux at each position.
4.2. Excitation diagnostics
The bright optical emission lines provide us with a rich set of observational constraints that inform us about the gas properties and ionization mechanism. To make the best use of these constraints, we use two approaches in the following. As a first criterion, we use the standard Baldwin et al. (1981) diagnostics to infer whether (and where) the gas in J2345−0449 is ionized by star formation, AGN photoionization, or shocks, using the line ratios of [NII]λ6583 with Hα, and of [OIII]λ5007 with Hβ. Diffuse [OI]λ6300 line emission is too weak to be fitted robustly throughout the disk. We do not use the [SII]λλ6716,6731/Hα ratio as a diagnostics, because the [SII]λλ6716,6731 line fluxes are not well reproduced by population synthesis models (Kewley et al. 2019). Figure 2 shows two typical spectra that we use in our analysis.
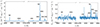 |
Fig. 2. Two examples of spectra used for this analysis, extracted from 0.6″ × 0.6″ apertures within a star forming region (left), and in the outskirts of the disk (right), within the rest-frame of the galaxy. |
However, emission-line ratios produced by shocks are not always easy to distinguish from those arising from gas heating from old stellar populations – both fall into the LINER region of the classical BPT diagrams. Since stellar populations with ages ≥10 Gyrs dominate in J2345−0449 (Sect. 5), we also adopt the criterion of Cid Fernandes et al. (2011) who found that for Hα equivalent widths < 3 Å, line excitation by evolved stellar populations cannot be ruled out. They therefore constructed another diagnostic diagram based on the Hα equivalent width and [NII]/Hα ratio to distinguish between HII regions, shocks, and evolved stellar populations as photoionizing source.
In Fig. 3 we show the results obtained with both approaches. In the top panel, we show for each spatial pixel in J2345−0449 where the line emission falls with respect to the classical BPT diagram, and which regions in the galaxy are dominated by which type of emission. Most of the galaxy can be classified as a LINER, or falls into the region where the classification is more ambiguous, and likely a mix of LINER emission and photoionization from young stars. Comparison with the Hα map (Fig. 4) shows that only young star-forming regions fall onto the star formation branch in the BPT diagram.
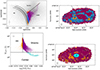 |
Fig. 3. Diagnostic diagrams. Top: Optical diagnostic diagram for our target showing the [OIII]/Hβ versus [NII]/Hα line ratios, following Veilleux & Osterbrock (1987) and Kewley et al. (2019). Left: Light gray areas show the large sample of nearby galaxies of Brinchmann et al. (2004) taken from the SDSS. Orange, purple and red data points indicate gas in each spatial pixel of J2345−0449 that is photoionized by star formation, shocks, and AGN photons, respectively. Blue points mark regions that fall into the regime where star formation and shocks likely coexist. Typical measurement uncertainties are shown in the as cross in the lower left corner. Right: Spatial distribution of these areas in J2345−0449. Contours show the Hα morphology. The circle in the lower left corner indicates the size of the PSF. The black dashed lines show the radio-jets aperture angle. Bottom: Diagnostic diagram using the [NII]/Hα line ratios and Hα equivalent widths (Cid Fernandes et al. 2011, WHAN diagram). Left: Orange, purple, and cyan data points indicate emission photoionized predominantly by HII regions, shocks, and evolved stellar populations, respectively. The cross in the upper left corner represents typical measurement uncertainties. Right: Map of J2345−0449 indicating where the different ionizing sources identified with the WHAN diagram dominate. Contours show the Hα morphology. The size of the PSF is shown as circle in the lower left corner. |
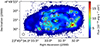 |
Fig. 4. Hα map of our target. Red contours indicate individual star forming regions identified by the BPT diagram (Fig. 3) and/or identified by an Hα luminosity greater than 13 × 1038 erg s−1. The position of the molecular ring previously observed with ALMA in CO(1–0) is shown as black contours. The small black circle in the lower left corner shows the FWHM size of the PSF. |
The lower panel of Fig. 3 shows that large parts of the diffuse LINER-like emission in the disk of J2345−0449 are indeed heated by shocks, and not old stellar populations, because the Hα equivalent widths exceed the limit of 3 Å. The regions identified as being dominated by star formation agree overall with those found with the BPT diagram (Fig. 3), but are somewhat more extended, and include some of the intermediate regions as well. The only region formally identified as dominated by heating from old stellar populations is near the nucleus, that is to say, closest to the AGN. In order to have a global measure of the line emission in the central 1.4″ (corresponding to 2 kpc at z = 0.0775), we extracted an integrated spectrum from this region, shown in Fig. 5, where we find an equivalent width of  Å and a [NII]/Hα ratio of 1.4. Although this falls formally within the region where the gas can be photoionized by the old stellar population, a contribution from a weak AGN cannot be ruled out, provided that it does not produce EWHα > 3 Å (see also Sect. 3). Agostino et al. (2021) recently proposed a decrease in the threshold of [NII]/Hα ratio in the WHAN diagram. Had we adopted this value, which corresponds to a line ratio in the ambiguous region of the BPT diagram, we would have classified larger parts of the “ambiguous” regions as star-forming. However, this does not add additional information to our maps, since both the BPT and the WHAN diagram use the same indicator. As we further discuss in Sect. 5.2, classifying all ambiguous pixels as star forming would also violate the global constraints on the star formation rate measured in the UV, IR, and optical with HST.
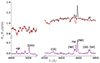 |
Fig. 5. Rest-frame integrated spectrum measured in a 1.4″ aperture centered on the nucleus. The black line shows the measured flux density normalized to the flux at λ = 6270 Å. The best-fit model of the stellar continuum obtained with STARLIGHT is plotted in red. The purple line below shows the continuum-subtracted emission-line spectrum. |
Emission-line properties extracted from the central region can be found in Table 1, where we also list the emission-line properties extracted from the inner disk associated with the CO line emission, and the outer disk.
4.3. Electron densities
The electron density can be deduced from the relative intensities of two emission lines in a doublet with a small energy gap between the upper levels, and the same lower energy level. At electron densities near the critical values for collisional de-excitation, the electron density impacts the collisional deexcitation rates from the two upper levels and therefore the relative intensities of the two lines. We use the [SII] λ6716/6731 line ratio to measure the electron density (Dopita & Sutherland 2004).
The result is shown in Fig. 6, and was obtained by extracting spectra from 1.4″ apertures (corresponding to 2 kpc). The line ratios of [SII]λλ6716,6731 are generally between R6716, 6731 = 0.8 and 1.44, where the latter represents the highest physically plausible value. Higher and lower values found in some pixels in the faint outer regions of the disk are likely due to low signal-to-noise ratios and were discarded. Figure 6 shows that the electron densities in J2345–0449 are not uniform across the source. In most of the disk, values are between R6716, 6731 = 1.3 and 1.4, consistent with low electron densities of a few 10 cm−3, as commonly found in spiral galaxies. However, along a broad band extending north-south from the nucleus and out to about 7.5″ west (corresponding to 11.2 kpc), the line ratios are significantly lower, around R6716, 6731 = 0.8 − 1.1. These values correspond to much higher electron densities of about 350 to 1250 cm−3, and are consistent with those typically found in strong outflows driven by star formation and active galactic nuclei (e.g., Osterbrock 1989; Heckman et al. 1990; Dopita & Sutherland 2003; Puech et al. 2006; Nesvadba et al. 2006, 2008; Kakkad et al. 2018; Davies et al. 2020; Santoro et al. 2020). It has previously been proposed (e.g., Heckman et al. 1990; Davies et al. 2020) that [SII]λλ6716,6731 is mainly emitted by gas that is partially ionized and partially neutral. In that case, the intrinsic densities may be higher (by factors ∼3, Heckman et al. 1990) than those estimated here. Irrespective of this systematic uncertainty, the result shows that there is a strong difference in electron densities between the region intercepted by the radio jet and the remaining disk.
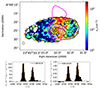 |
Fig. 6. Electron density, ne, measured from the flux ratio of [SII]λ6716/[SII]λ6731. Top: electron density map. Black contours show the Hα flux, pink contours the radio emission observed with FIRST. Bottom: Integrated [SII]λλ6716,6731 spectra of J2345–0449 extracted from regions with electron densities, ne, below (left panel) and above 600 cm−3 (right panel). Data are shown as black histograms, Gaussian fits as orange lines. The line ratio, r, and its uncertainties is listed above each spectrum. |
The appearance of the regions of enhanced electron densities in Fig. 6 is irregular, reflecting intrinsic variations of the gas properties in this region. To illustrate that the differences in line ratios from which these electron densities were measured are indeed significant, we show in the lower panel of Fig. 6 the integrated line profiles of the [SII]λλ6716,6731 doublet extracted from regions with electron densities above and below a fiducial value of ne = 600 cm−3, that provides a good distinction between the two regions.
4.4. Extinction in the gas and stellar continuum
MUSE provides us with two means to estimate extinction in our galaxy, comparing the observed line ratio of Hα to Hβ with the theoretically expected Balmer decrement of the two lines, and from the reddening of the stellar continuum. For the first estimate, we follow the prescription in Osterbrock & Ferland (2006) for a Galactic extinction law, i.e., setting R = AV/E(B − V) = 3.1. The mean electron density of the galaxy is ne = 200 cm−3 (see Sect. 4.3), so for a temperature T = 104K, we adopt  (Dopita & Sutherland 2004) for the intrinsic Balmer decrement. For the second estimate, we simply use the output of the STARLIGHT fits to the stellar continuum.
Figure 7 shows the dust extinction obtained with the two methods. Extinctions measured with STARLIGHT are between AV, stellar = 0.5 and 1.1 mag, those measured from the Balmer decrement are somewhat higher, between AV, Balmer = 0.9 and 2.5 mag. Such a discrepancy is not unusual, and typically attributed to different spatial distributions of gas and stellar populations (e.g., Calzetti et al. 2000).
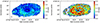 |
Fig. 7. Dust extinction, AV, given in magnitudes, and measured (left) from the stellar continuum, and (right) from the measured Hα/Hβ line ratios and Balmer decrements. In both panels, the highest values are found in the southern part of the inner disk, that is also associated with the CO(1–0) line emission. Black contours in the left panel show the molecular ring, and in the right panel the principal features in the Hα map. |
Qualitatively, however, both show the same trends, in particular, enhanced extinction in regions associated with the molecular ring, shown as black contours in the left panel of Fig. 7. The CO(1–0) morphology of the gas is irregular and filamentary (Nesvadba et al. 2021), which may further explain the higher extinctions measured from the line emission, if the warm ionized gas is associated with the same clouds as the molecular gas seen in CO. In this case, we may see relatively more stellar continuum emission than line emission along lines of sight with lower obscuration. Moreover, we see in both tracers that extinction is systematically stronger in the southern than in the northern ring, which we interpret as evidence that the southern side of the galaxy is pointing toward us.
4.5. H2 column densities and gas mass surface density
J2345–0449 has a total molecular gas mass of 2 × 10¹⁰ M⊙ (Dabhade et al. 2020; Nesvadba et al. 2021), which is unusually high for a galaxy in the nearby Universe, so even extinctions between AV = 1 − 2.5 mag seem rather moderate. Moreover, as already discussed by Nesvadba et al. (2021), given the unusually low star formation rates associated with the molecular gas in this case, and line broadening due to interactions with the radio source, it cannot be ruled out that at least parts of the gas are optically thin.
Given the similar morphologies, it is safe to assume that the extinction seen with MUSE arises from the same molecular gas and dust clouds also seen with ALMA in CO(1–0). We therefore use the extinction measured here to obtain an alternative estimate of the column density of molecular gas (equivalent to the molecular gas mass surface density) that was previously derived from the CO(1–0) line emission by Nesvadba et al. (2021).
For typical gas-to-dust ratios of about 100–150, the V-band extinction, AV, given in magnitudes, scales linearly with the column density of molecular gas, NH, given in cm−2. The factor of proportionality is usually derived empirically, and ranges between NH = 1.8 − 2.2 × 10²¹AV cm−2 mag−1, as measured along different lines of sight in the Milky Way (e.g., Güver & Özel 2009; Gratier et al. 2021). NH is the sum of the contributions of atomic and molecular Hydrogen, NH = NHI ± 2NH2. In the following we assume that all Hydrogen is in molecular form. For a range of AV = 1 − 2.5 mag suggested by Fig. 7, and taking into account the systematic uncertainty in column densities, we find gas-mass surface densities of 24 − 72 M⊙ pc−2. This is somewhat lower, but nonetheless comparable to the average gas-mass surface density of ΣH2 = 78 M⊙ pc−2 found by Nesvadba et al. (2021), and does not suggest that a dominant fraction of the molecular gas in J2345−0449 is optically thin.
5. Current and past star formation
5.1. Star formation history
One of the main purposes of analysing the stellar continuum with STARLIGHT (Fernandes et al. 2005) is to investigate the star formation history in each spatial pixel. STARLIGHT fits stellar absorption-line spectra with a linear combination of simple stellar populations of different age, thereby reconstructing the main star formation events at each location within the galaxy. We adopt a Galactic extinction law. The main results are shown in Table 2 and Fig. 8, where we show the mass surface densities of stellar populations formed within different age ranges.
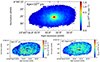 |
Fig. 8. Mass surface densities of stellar populations in different age ranges. We can note the different units in each panel. Old stellar populations formed ≥10 Gyrs are by far the dominant mass component, contributing ≥93% to the stellar mass throughout the disk and bulge. The distributions of young and intermediate-age stellar populations are shown in the two lower panels. |
Masses of stellar populations with different ages.
We are most interested in identifying the main periods of star formation and quiescence in this galaxy. Therefore we simply distinguish between young (t≤ few 107 − 8 yrs), intermediate-age (109 < t < 1010 yrs), and old stellar populations (t > 1010 yrs).
Old stellar populations, formed more than 10 Gyrs ago, are by far the dominant stellar component in J2345–0449. Throughout the galaxy, more than 93% of the stellar mass, corresponding to Mstellar = 3.6 × 10¹¹ M⊙, was formed during this period. This population has a regular morphology for a disk galaxy, with a dense central bulge with Σstellar = (5 − 16)×103 M⊙ pc−2 within a central radius of 1.5 kpc, surrounded by an exponentially declining disk with typical molecular gas mass surface densities of Σstellar = 2000 to 100 M⊙ pc−2 at radii between 3 and 18 kpc from the nucleus.
Intermediate-age stellar populations formed a few Gyrs ago contribute about 5% to the total stellar mass in J2345–0449, and 80% of the stellar mass are found in the inner 14 kpc of the disk. More recent star formation (< 109 yrs) is also found predominantly in the inner disk, associated with the molecular ring, but amounts only to less than 2% of the total stellar mass in the galaxy.
In Fig. 9 we also show the cumulative stellar masses as a function of age in three distinct regions of J2345 − 0449. The diagram shows clearly that most star formation happened very early on, followed by a small number of weaker star formation events at later times, each contributing less than 1% to the stellar mass of the galaxy.
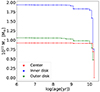 |
Fig. 9. Cumulative stellar mass as a function of age in the center, the inner, and outer disk, respectively. The inner disk corresponds to the radii covered by the molecular ring. All regions are also shown on Fig. 4. |
5.2. Current star formation rates in the disk and bulge
There are a number of methods available today to estimate the rates at which stars form, based on several spectral features. For J2345−0449, star formation rates have previously been estimated from GALEX UV data (Walker et al. 2015), WISE 22 μm imaging (Dabhade et al. 2020), and a combination of both (Nesvadba et al. 2021). Taken together, these estimates suggest an integrated star formation rate (SFR) in J2345−0449, of between 0.9 and 2.95 M⊙ yr−1. Bagchi et al. (2014) also estimated low star formation rate surface densities of few 10−4 M⊙ pc−2 in parts of the galaxy from an optical longslit spectrum. In an analysis of HST photometry they find SFR = 2.5 M⊙ yr−1 (Bagchi et al., in prep.)
The MUSE data cube provides us with two additional methods to estimate the rate of recent star formation, namely, the extinction-corrected Hα flux, which is particularly sensitive to star formation in the past ∼10 Myr (Leitherer et al. 1999), and the results of the stellar continuum fitting with STARLIGHT, which inform us about the total stellar mass formed within the past few 10–100 Myrs.
Each estimate is associated with systematic and measurement uncertainties, so we may not expect to obtain strictly the same results with all methods, but they do provide us with a robust set of constraints about the most likely range of the obscured and un-obscured, on-going and recent past star formation in J2345−0449. In the following, we will use SFR = 2.95 M⊙ yr−1 measured by Dabhade et al. (2020) with WISE at 22 μm as a reference value, since the infrared emission, being comparably unaffected by dust emission, should provide us with the most robust global estimate of star formation in this galaxy. The much lower GALEX estimate of 1.1 M⊙ yr−1 (Walker et al. 2015) indicates that we do not miss significant amounts of star formation by dust.
The Hα line flux gives a measure of the number of ionizing photons in HII regions around young, massive stars, and therefore provides us with an estimate of the on-going star formation in galaxies. In J2345−0449, however, not all Hα emission arises from gas photoionized by star formation, as can be seen from the emission-line diagnostics in Sect. 4, which showed that shocks and old stellar populations are major ionizing sources for the Hα emission in this galaxy.
To estimate the star formation rate from the Hα luminosity, we follow Calzetti et al. (2007) by setting SFR = 5.5 × 10−42LHα, which is based on the same assumptions previously used by Dabhade et al. (2020) to estimate a star formation rate from the 22 μm flux measured with WISE. In this relationship, SFR is measured in M⊙ yr−1, and the Hα luminosity, LHα, in erg s−1. These estimates are valid for a Kroupa stellar initial mass function (IMF), and agree to within 10% with the estimates derived from a Chabrier IMF (Chabrier 2003).
Summing over all pixels where the line ratios clearly fall into the star-forming region of the BPT diagram in Fig. 3 (orange dots), we find an integrated Hα line flux of FHα = 1.6 × 10⁻¹⁴ erg s−1 cm−2, corrected for extinction, which corresponds to a star formation rate of SFR = 1.3 M⊙ yr−1. This corresponds to the pure starburst region in the Kewley et al. (2006) models. If we also include the emission in the composite region between LINER and star formation in that diagram (dark blue dots), the total line flux is FHα, max = 1 × 10⁻¹³ erg s−1, and the total star formation rate SFRmax = 8.3 M⊙ yr−1, significantly more than the previous measurements obtained in the UV and infrared (Walker et al. 2015; Dabhade et al. 2020; Nesvadba et al. 2021). This discrepancy can be easily explained with the contamination of the Hα emission with gas heated by other sources than young stars. In Fig. 3 we argued that large parts of the disk are heated either predominantly by shocks, or by a mixture of shocks and star formation, which provides a good explanation for the excess Hα flux.
Alternatively, we can also apply a luminosity cut to the Hα map shown in Fig. 4, excluding the inner 2 kpc around the nucleus. This corresponds to the empirical and somewhat heuristic assumption that bright compact regions in the Hα map and extended features following spiral arms are typically associated with star forming regions. If we include all such regions with Hα surface brightness of FHα ≥ 1.75 × 10⁻¹⁶ erg s−1 cm−2 arcsec−2 in such a calculation, which corresponds to ℒHα ≥ 1.35 #x00D7; 1040 erg s−1 kpc−2 and is shown as contours in Fig. 4, we obtain a total star formation rate of SFR = 1.9 M⊙ yr−1. Had we adopted a value of FHα ≥ 1.25 × 10⁻¹⁶ erg s−1 cm−2 arcsec−2 instead, which would also include the emission along the spiral arm west of the nucleus and the diffuse emission in the east, the total (extinction-corrected) star formation rate would be 5.6 M⊙ yr−1, significantly more than measured previously. Again, contamination with diffuse emission from other sources is likely the cause for that, and is becoming increasingly important with decreasing Hα surface brightness due to star formation. In the following, we consider Hα fluxes in regions that fall into the star-forming regions of Fig. 3 and have FHα ≥ 1.75 × 10⁻¹⁶ erg s−1 cm−2 arcsec−2 in Fig. 4 as photoionized solely by star formation, and fainter regions with an ambiguous ionizing source as providing upper limits.
6. Individual star-forming regions
In the following we analyze the properties of the brightest individual star-forming regions in more detail. The Hα map shown in Fig. 4 indicates widespread diffuse emission in J2345−0449 broadly following the spiral arms, and interspersed with 13 bright star-forming regions that are labeled individually in Fig. 4. To avoid including spurious, isolated pixels, we further imposed that the regions are extended as suggested by the SciPy task erosion. The brightest of these regions correspond to areas in the BPT diagram in Fig. 3 that are dominated by star formation. Given their characteristic morphology in the Hα map, we also include somewhat fainter regions which fall into the intermediate part of the BPT diagram between star formation and LINER emission. They are identified by their characteristic morphology in Fig. 4, and comparably high Hα surface brightness ≳1.75 × 10⁻¹⁶ erg s−1 cm−2 arcsec−2, although their line emission seems to have a considerable component of gas not heated by star formation, which moves them outside of the range in the diagram that is covered by star-forming regions. We have already shown in Sect. 5.2 that this does not violate the global constraints on star formation in J2345−0449 derived from the dust emission. Individual properties of each star-forming region are given in Fig. 3, together with their uncertainties.
Star-forming regions are found at radii between 4 and 22 kpc from the nucleus. Most are not spatially resolved in our data. Regions (b) and (h), which are resolved, have sizes of rc = 1.3 and 1.9 kpc, respectively, corrected for the size of the PSF. The circularized radius, rc, is the radius of a hypothetical circular region with the same surface that we measured by summing over the areas of all spatial pixels within that region.
Star formation rates in individual regions are typically between 0.03 and 0.1 M⊙ yr−1. Two regions have star formation rates above this range. Namely, region (b) has SFR = 0.5 M⊙ yr−1, and region (h) has SFR = 0.9 M⊙ yr−1, respectively.
All star formation rates were corrected for extinction, and are therefore not biased by the presence or absence of molecular gas along the same line of sight, as long as the optical Balmer lines are not entirely obscured. The relatively low global star formation rate estimated from WISE of SFR = 2.95 M⊙ yr−1 indicates that this is not the case.
Not all star-forming regions are associated with the molecular ring previously described by Nesvadba et al. (2021), as can be seen from Fig. 4. Three of the regions with a high star formation rate, (a), (j), and (h), actually fall just outside the ring, whose outlines are shown as black contours in Fig. 4.
We also estimated upper limits on the ages of each star forming region from their Hα equivalent width, using the relationships in STARLIGHT99 (Leitherer et al. 1999). We consider these values upper limits because of the presence of underlying stellar light from the disk component. Overall, we find very young ages of 6–9 Myrs, with one of the fainter regions, (d), having an age of about 11 Myrs. These young ages imply that the radio jet (for which Walker et al. 2015, and Nesvadba et al. 2021 estimated an age between 10 and 250 Myr) was already active at the time of the onset of star formation.
7. Kinematics of the warm ionized gas
7.1. Maps of relative velocities and line widths
The resulting maps of relative velocities and line widths are shown in Fig. 10. Line widths have been corrected for the instrumental broadening of MUSE of FWHM = 120 km s−1 (corresponding to Gaussian line widths σ = 51 km s−1). The lowest values reached in the eastern part of the disk are unresolved with the MUSE data.
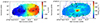 |
Fig. 10. Kinematics maps extracted from Hα. Left: relative velocities and right: gaussian line widths, σ. All velocities are given relative to a redshift z = 0.0755. Colorbars show velocities and widths in km s−1. |
The velocity map is dominated by an increase in gas velocities from east to west, ranging from −360 to 300 km s−1. The FWHM line widths are broadest in the bulge and in the inner 1.8″ near the nucleus (corresponding to 2.7 kpc), where they reach a maximum of 400 km s−1. They are more narrow in the disk, within a range of 100 to 130 km s−1. On top of the very uniform disk component, we also see an irregular structure of broader line widths with FWHM = 150 to 180 km s−1, which extend from the nuclear region in several filaments roughly in north-south direction before bending toward east and west.
Comparison with the maps of molecular gas kinematics presented by Nesvadba et al. (2021) indicates that the same structures are also found in the cold molecular ring. These structures are also found in the other optical gas lines that are bright enough to be fitted pixel by pixel, i.e., [OIII]λλ4959, 5007, [NII]λλ6548, 6583, and [SII]λλ6716, 6731.
7.2. Position-velocity diagram
The position-velocity (PV) diagram, constructed from the full data cube and centered on the Hα line is shown in Fig. 11. It probes the disk velocities out to radii of 15 kpc from the nucleus (corresponding to 22.5 kpc). Velocities increase monotonically from east to west, with a gradient that flattens at about ±5″ distance from the nucleus, however, velocities keep increasing out to the largest distances. The observed Hα diagram follows that of the main rotational velocity components measured with KINEMETRY (see Sect. 7.3) very well (shown as orange contours in Fig. 11).
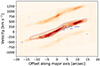 |
Fig. 11. Hα position-velocity diagram. Orange contours show the best-fit model obtained with KINEMETRY, and blue contours the CO(1–0) results of Nesvadba et al. (2021). The [NII] lines cause the fainter features below and above the central Hα line. The line shift is due to differing wavelength of lines. |
In the same figure, we also compare with the PV diagram of the molecular gas probed by the CO(1–0) line. Both gas phases follow each other well over the full range where CO(1–0) is detected. These diagrams confirm that the gas kinematics in J2345−0449 are dominated by rotation, without any clear indication of a significant nonrotational component in either the warm ionized or cold molecular gas.
7.3. Kinemetry analysis
We used the publicly available analysis tool KINEMETRY (Krajnović et al. 2006) to analyze the velocity fields of J2345−0449 quantitatively and in more detail. KINEMETRY expands the velocity field within concentric ellipses around the nucleus of a galaxy into its Fourier components to measure the mean velocity field of the rotating disk, and to identify noncircular gas motion.
The result is shown in the left panel of Fig. 12. For J2345–0449, the velocity field can be fitted out to a radius of 14.3″ from the nucleus (corresponding to 21.3 kpc). The position angle is PA = 272 ± 3° without large jumps at any radius. The ellipticity varies between ϵ = 0.5 and 0.8. Residuals from this fit contribute ≤2%. The resulting velocity field measured from the deprojected lowest-order velocity component in each ring is shown in the left panel of Fig. 12. It is consistent with a regularly rotating disk with a total deprojected velocity offset of 758 ± 15 km s−1.
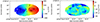 |
Fig. 12. Left: Best fit kinemetry models of the relative velocities extracted from Hα. Right: Residual map of relative velocities – kinemetry model. All velocities are given relative to a redshift z = 0.0755. Colorbars show velocities in km s−1. |
The right panel of Fig. 12 shows the residual velocity components after subtracting the modeled Hα velocity field from the observed velocity map. Residuals are small, about 15 − 30 km s−1, and are mainly associated with star-forming regions. They probably represent streaming motions along the trailing spiral arms. Residuals associated with the broadened emission lines are generally smaller, with offsets ≤10 km s−1.
7.4. Expected signatures from a radio jet-driven outflow
The KINEMETRY analysis in the previous subsection has shown that the cold molecular and warm ionized gas in J2345−0449 follow the global velocity pattern of a rotating disk to a high degree, however, we may also ask what signatures we may expect in case of an interaction between radio jet and gas. To this end, we used one of the synthetic velocity maps of a radio jet that is strongly interacting with a gas disk, obtained from the suite of relativistic hydrodynamic simulations of Mukherjee et al. (2018), see also Meenakshi et al. (2022a,b). The velocity map we are using is obtained from a simulation of a 2.31 Myr old radio jet with jet power Ekin = 1045 erg s−1 impinging onto a gas disk with an average number density of n = 200 cm−3 under an inclination of 45° (their simulation D).
Before analyzing the velocity field with KINEMETRY we constructed a version that is matched in spatial resolution to our data set by convolving it with a Gaussian PSF. Since we wish to study a disk at the same spatial sampling as the observed data, we choose the PSF size such that we cover the major axis of the simulated velocity field with 29 individual PSFs, as is observed for J2345−0449.
The initial and PSF-matched velocity fields are shown in Fig. 13. While the outflow component is clearly visible in the full-resolution data set, it is much more difficult to discern in the PSF-matched image, although some component of high-velocity gas can be seen directly in the map at the periphery of the disk. The KINEMETRY fit, however, shows more significant residuals between the best-fit velocity map of a rotating disk and the observed velocity field (left panel of Fig. 14). The rotation map shows already important offsets from a simple rotating disk at several radii. These appear as distortions in the global velocity field calculated with KINEMETRY at certain intermediate radii, where the outflowing gas component is sufficiently strong to affect the global velocity pattern in the tilted ring. The outflow features become more clearly visible in the right panel of Fig. 14, which shows the residuals of the PSF-matched simulated velocity field after subtracting the best-fit disk model observed with KINEMETRY. Along the north-south direction, where the outflow dominates the intrinsic velocity field at the outer radii, we see large velocity residuals in the map, 80 − 235 km s−1. However, comparing with the observed map of J2345−0449, such gas would probably be too faint to be observed in this galaxy. Nonetheless, a large-scale outflow should have left significant residuals in the velocity map, which we do not observe. This suggests that it is unlikely that we would have missed a strong outflow in our data.
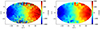 |
Fig. 13. Synthetic velocity field of Simulation D of Mukherjee et al. (2018, see also Meenakshi et al. 2022a,b) showing a radio jet escaping in north-south direction from a rotating disk. The left panel shows the full-resolution simulation, the right panel is smoothed to the same spatial sampling as our MUSE data of J2345−0449. |
 |
Fig. 14. Main rotational velocity component as calculated with KINEMETRY (left) and the residuals between the full velocity field and the main rotational component (right). |
7.5. Absorption from warm neutral gas
We also searched for signatures of outflows of warm neutral gas as probed by the Na D doublet at 5889.97 Å and 5895.94 Å. The Na D lines may either be of stellar or interstellar origin. To only probe a putative interstellar line component, we use the residual spectrum after subtracting the best fit to the stellar continuum emission obtained with STARLIGHT, which allows us to search for residual Na D absorption. In most of the galaxy, no significant Na D absorption features are found, with the exception of a small region of about 1.5″ radius around the nucleus. A Gaussian fit to the Na D doublet extracted from this region is shown in Fig. 15, which was obtained by requiring that both lines have the same width and velocity offset, as expected for the two lines of the doublet. We do not identify a clear blueshift or redshift in this component compared to the stellar spectrum. The best-fit velocity offset is −52±15 km s−1 relative to z = 0.0775, and we measure FWHM = 583 ± 20 km s−1, comparable to that of the stellar component. The kinematics do not permit us to distinguish uniquely between residual absorption from the continuum subtraction and an interstellar component, nonetheless, these results do show that J2345−0449 does not have NaD absorption probing a significant outflow or inflow component of warm neutral gas.
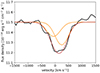 |
Fig. 15. Na D interstellar absorption lines seen against the nucleus of J2345–0449. Orange and red lines indicate the Gaussian fits to the doublet. |
8. Discussion
In the previous sections we have presented new results of J2345–0449 extracted from an optical imaging spectroscopic data cube obtained with VLT/MUSE. Our results add to previous observations obtained in the radio and with optical longslit spectroscopy (Bagchi et al. 2014), X-ray observations with Chandra and XMM (Walker et al. 2015; Mirakhor et al. 2021), and millimeter CO observations obtained with the IRAM 30-m telescope (Dabhade et al. 2020; Nesvadba et al. 2021) and ALMA (Nesvadba et al. 2021). We now discuss our observational results further, to put them into a broader context of galaxy evolution.
8.1. Global star formation history and gas depletion times
Our new observations add additional constraints on the global star formation history as traced by the stellar component, local and global star formation as probed by Hα, and gas kinematics in this galaxy, and can help us elucidate several of the outstanding open questions regarding this galaxy. First, we have shown that only a very small fraction of the stellar mass, ≈6%, has been formed within the last ≤10 Gyrs (Table 2), including in the disk, in stark contrast to other late-type spiral galaxies which have formed significant parts of their stellar disks over long cosmic time scales. The absence of significant young and intermediate-age stellar populations is however not unusual for spiral galaxies of similar stellar mass (e.g., Lelli et al. 2015; Ogle et al. 2019). Contrary to J2345−0449, however, such galaxies normally do not have very massive gas reservoirs (Li et al. 2019) or AGN with extended radio jets (Singh et al. 2015). The main formation period of the bulge and disk in J2345−0449 was clearly in the early Universe. Lookback times ≥10 Gyr correspond to z ≳ 1.8. J2345−0449 may therefore be a nearby fossil remnant of the massive disk galaxies that have been observed in formation during this epoch, many of which have similar sizes and stellar masses (e.g., Förster Schreiber et al. 2009, 2018).
If we take the age distribution of the stellar populations as a rough indicator of the past star formation rates (average SFR, ⟨SFR⟩ = 2.3 M⊙ yr−1), then we find that the current star formation rate of ∼3 M⊙ yr−1 is rather typical for the last 10 Gyr, and lower than the average star formation rates in more recent epochs (6 and 18 M⊙ yr−1 in the last 109 and 108 yrs, respectively). This may indicate a recent increase in star formation during the last Gyr, perhaps related to the processes which led to the formation of the massive molecular ring seen with IRAM and ALMA.
The ratio of molecular gas mass to stellar mass in J2345−0449, Mgas/Mstellar = 0.53, is remarkably large. The most gas-rich galaxies in the Saintonge et al. (2017) sample have molecular gas masses that correspond to about 10% of their stellar mass (their Fig. 13), but these have also stellar masses that are an order of magnitude smaller than that of J2345−0449. Galaxies with Mstellar ≥ 1011 M⊙ in their sample have typical molecular gas masses that are only about 1–2% of their stellar mass. Many massive galaxies have significant HI reservoirs, however, the molecular-to-stellar mass fraction in J2345−0449 exceeds even the typical atomic-to-stellar mass fraction in these galaxies (10%) by a factor ∼5. This underlines that the presence of such a massive molecular gas reservoir in J2345−0449 is truly outstanding. Given the presence of the bright, massive X-ray halo (Walker et al. 2015; Mirakhor et al. 2021), we may suspect that at least parts of this gas originate from cooling of the hot halo gas.
Star formation within this ring seems to be slowed down compared to other spiral galaxies and galaxies near the main sequence of star-forming galaxies. For example Bigiel et al. (2008) and Saintonge et al. (2017) argued that such galaxies have a typical gas depletion time of 2 Gyr, a time which however increases for galaxies below the main sequence. If we take the current star formation rate in all star-forming regions associated with the molecular ring in J2345−0449 of 0.9 M⊙ yr−1, and the molecular gas mass of 2 × 10¹⁰ M⊙, we find a gas-depletion time, τdepl = Mgas/SFR = 22 Gyr. This is much longer than the typical molecular gas depletion time of spiral galaxies of 2 Gyr (Bigiel et al. 2008). Had we used the total star formation rate determined with WISE of 2.95 M⊙ yr−1, ignoring the fact that most star formation seen in Hα is outside the ring, the gas depletion time would be 6.8 Gyrs, in the extreme scatter of their correlation, and also at the very low end of galaxies with similar specific star formation rates in the sample of Saintonge et al. (2017).
8.2. Star formation in individual star-forming regions
The MUSE data also allow us to localize star formation and measure local star formation rates on scales of several 100 pc. We presented the 13 main star-forming regions in this galaxy in Sect. 6. It is very interesting that star-forming regions can be found inside and outside of the molecular ring (Fig. 4). The region of most intense star formation, region (h) in Fig. 4 falls actually right outside the ring. Amongst the 12 remaining regions, seven fall within the molecular ring, and four of these regions are associated with the northern spiral arm seen in Hα. The remaining five regions fall outside the molecular ring, with three falling very near the ring’s edge. All regions are associated with stellar mass surface densities, Σstellar, between 100 and 1000 M⊙ pc−2.
This result does not depend on extinction, as we corrected the SFRs listed in Table A.1 for the observed Hα/Hβ decrements, and obtain a similar SFR as that previously found in the infrared with WISE (Dabhade et al. 2020). This confirms that the star formation in this galaxy is not solely associated with the molecular ring, but also found within the outer disk, as was previously suspected from low-resolution GALEX and WISE data (Nesvadba et al. 2021). We now investigate in more detail whether we can identify differences in star formation efficiency in star-forming regions within and outside the molecular ring.
There is now a wide consensus in the literature that the efficiency with which galaxies form stars depends on the mass surface density of molecular gas (e.g., Kennicutt 1989; Bigiel et al. 2008; de los Reyes & Kennicutt 2019; Kennicutt & De Los Reyes 2021), although perhaps not exclusively (e.g., Shi et al. 2011; Hennebelle & Chabrier 2011; Federrath & Klessen 2012; Krumholz et al. 2012; Shi et al. 2011; Pessa et al. 2022). This is most clearly seen through the relatively tight sequence spanned by star forming galaxies in the Kennicutt-Schmidt diagram (Kennicutt 1998; Kennicutt & De Los Reyes 2021), which relates the surface densities of star formation rates and molecular gas mass. As initially pointed out by Nesvadba et al. (2010) and Ogle et al. (2010) and subsequently confirmed with Herschel photometry by Lanz et al. (2016), a subset of powerful radio galaxies falls about 1–2 dex below the relationship of normal disk galaxies, perhaps indicating lower star formation efficiencies. Nesvadba et al. (2021) used the average star formation rate of 2.95 M⊙ yr−1 measured with WISE (Dabhade et al. 2020), and assumed star formation to be distributed uniformly across the disk, to estimate where J2345−0449 falls in the Kennicutt-Schmidt diagram. Comparing with the molecular gas-mass surface densities observed with ALMA at 1″ beam size, they found that J2345−0449 falls factors 30–70 below the ordinary Kennicutt-Schmidt relation, and into the same range also populated by the radio galaxies previously studied.
We now use our MUSE data to refine this global measurement, and to investigate whether individual star-forming regions show the same offset as J2345−0449 as a whole. This is shown in Fig. 16. Individual star-forming regions are shown as red dots and are labeled individually. They fall clearly within the usual sequence of star-forming galaxies. Regions outside the molecular ring (regions (a) and (f) to (h)) fall somewhat above the ridge line of the normal Kennicutt-Schmidt relationship, but well within the scatter. We used a 3σ upper limit to estimate the molecular gas mass surface densities in these cases, since CO(1–0) is not detected outside the ring, potentially because of relatively shallow data obtained by Nesvadba et al. (2021). Deeper CO(1–0) interferometry is currently being observed at ALMA. Star-forming regions within the ring (labeled (b) to (e)), fall somewhat below the ridge line, but remain well within the scatter of normal spiral galaxies. Region (c), which is furthest from the ridge line, has a star formation efficiency that is about a factor 10 less than the average star-forming galaxy, which is near the edge of the distribution, but not unusually low.
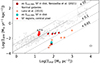 |
Fig. 16. Star formation rate surface density as a function of molecular gas mass surface density in J2345–0449 (Kennicutt-Schmidt relationship). Individual star-forming regions in J2345–0449 (red dot symbols) fall onto the relationship of ordinary star-forming galaxies, whereas the global averages of molecular gas mass and star formation rate surface densities fall a factor 30-70 below. The properties of individual star-forming regions are listed in Table A.1. |
The large red dot in Fig. 16 shows the previous measurement of the average star formation rate surface density and average molecular gas mass surface density in J2345−0449 (Nesvadba et al. 2021). The light green dot indicates our new estimate of the average star formation rate surface density associated with the molecular ring, ΣSFR= 0.004 M⊙ yr−1 kpc−2. We obtained this value by integrating over all star-forming regions associated with the ring, and dividing by the ring’s surface. This estimate is slightly higher than the one derived previously, which assumed that star formation, measured with GALEX and WISE at much lower spatial resolution of ∼5″, was evenly distributed throughout the disk. These estimates agree within their uncertainties.
This shows that in spite of the global suppression of star formation in this galaxy, gas which is able to turn into stars, seems to do so at a normal efficiency, however, the global fraction of such gas seems to be lower than what would be expected from the unusually large integrated molecular gas mass in this galaxy. This is not unexpected, in fact, Mandal et al. (2021) found a very similar behavior in relativistic hydrodynamic simulations of radio jet interacting with gas disks, after implementing the framework of Federrath & Klessen (2012) for turbulence-regulated star formation. Small star-forming regions in these simulations exist with normal or even enhanced star formation efficiencies compared to normal galaxies. These star-forming regions are however embedded in a much more massive gas disk that this globally not forming stars. Our present ALMA data have neither the depth nor the spatial resolution to probe the possible causes of this dichotomy further, however, we are currently obtaining significantly deeper, multitransition CO interferometry with ALMA, which will enable us to investigate this point in more detail.
8.3. Impact of the radio jet
8.3.1. Central cavity
One of the most remarkable features of J2345−0449 is the 1.6 Mpc large, fairly powerful (P1.4 GHz = 2.5 × 1024 W Hz−1) radio source, consisting of two pairs of radio jets that indicate repeated jet activity over long timescales (Bagchi et al. 2014; Nesvadba et al. 2021). Walker et al. (2015) previously argued that the radio jets interact with the hot gas in the halo, depositing an energy rate of dE/dtjet, kin = 2 × 1044 erg s−1, and potentially inflating an X-ray cavity in the circum-galactic medium. Nesvadba et al. (2021) suggested that turbulence induced by the radio jet in the molecular gas could be responsible for the line broadening in parts of the molecular ring, and the low global star formation rates compared to the molecular gas content. We now discuss whether the optical MUSE data presented here can add additional evidence to this scenario.
Unlike the molecular gas, the warm ionized gas does not show a clear central cavity as can been seen from Fig. 4. Hα and other emission lines can be probed down to the nucleus, although the line fluxes are very faint. Although the velocity field shown in Fig. 10 remains regular near the center, and does not indicate a clear noncircular component, that would perhaps herald an outflow, the line widths are strongly enhanced, with Gaussian widths of up to 170 km s−1, corresponding to FWHM = 400 km s−1 (Nesvadba et al. 2021, argued previously with a toy model that beam smearing has only a minor impact for these measurements). The regions of enhanced line widths correspond well to those seen in CO and line widths are similar in both gas phases. The map of Hα line widths, which extends over larger radii than that of CO, shows that the inner region of very broad widths turns into a set of filaments of gas with broadened line widths at larger radii.
It is interesting to ask whether the absence of CO(1–0) line emission in the central regions of J2345−0449 indicates a cavity in the molecular gas distribution or perhaps a region of high gas excitation, as previously observed in the S0 galaxy NGC 3100, a low-power, low-excitation radio galaxy (Ruffa et al. 2019, 2022). It is also possible that only the CO molecule is destroyed, while significant reservoirs of H2 may survive.
Our MUSE data provide us with two sets of constraints that add credence to the presence of a true depression in molecular gas mass surface density. First, we have shown in Fig. 7 that the extinction of stellar light and warm ionized gas probed by the Hα/Hβ decrement follows the distribution of CO line emission, i.e., the extinction is low toward the center. This does not indicate the presence of large columns of molecular gas. Second, the Na D absorption lines do not indicate the presence of large amounts of neutral (molecular or atomic) interstellar gas in the central region either, although some residual emission is observed after subtracting the stellar component (Sect. 7.5). We conclude that the central depression of CO line emission is indeed associated with lower gas-mass surface densities.
Most gas-rich early-type galaxies, including radio galaxies, show gas disks that extend well into the central kiloparsec of the host galaxies (e.g., Okuda et al. 2005; Young et al. 2011; Labiano et al. 2014; Castignani et al. 2020). However, a few cases are known where this is not the case. In particular barred spiral galaxies are known to have molecular rings within the radii where the stellar orbits in the bars corotate with the galaxy’s disk, however, these have typically much smaller sizes (Gadotti et al. 2020). In rare, fortuitous cases, a nuclear encounter with a satellite galaxy on a highly radial orbit can also cause a central gas depletion (Block et al. 2006).
A third mechanism, which seems most relevant to the radio galaxy J2345−0449, is interaction between gas and radio jet. Mukherjee et al. (2018) investigated the impact of radio jets onto surrounding gas disks with average densities of typically n = 100 − 200 cm−3, using a set of relativistic hydrodynamic simulations of radio jets that carry kinetic energies of 1045 and 1046 erg s−1, respectively. In J2345−0449, assuming that the molecular gas is in a ring with R = 11.8 kpc radius, and 4.2 kpc width (Nesvadba et al. 2021), we find an average density of n = 100 cm−3, which is well matched to their parameter range. However, the radio source in J2345−0449 is somewhat weaker, with a kinetic energy of 2 × 1044 erg s−1 (Walker et al. 2015; Cavagnolo et al. 2010). Mukherjee et al. (2018) find indeed that radio jets which expand in near perpendicular direction to the disk rapidly produce a gas depletion within the inner kpc of the host galaxy, although some dense filaments remain (e.g., their Fig. 7). The jets also continue to interact with the gas along the cavity rim. Similar effects may explain the strong line broadening we observe in the inner part of the molecular ring, and associated warm ionized gas. We do not see clear outflow signatures, but this could be due to the somewhat lower jet power in our case, low spatial and spectral resolution compared to the velocity range expected from a low-power outflow, or jet age. The morphology of the inner pair of radio jets (Fig. 6) suggests that these jets have already broken out from the disk itself, at which point the interactions should become less vigorous (Mukherjee et al. 2018). As argued in Fig. 6, however, high electron densities in the parts of the ring that coincide with the radio source in J2345−0449 do suggest that in this case, the radio jet is still regulating the gas conditions.
Such a mechanism, if maintained over long timescales, could also explain why J2345−0449 has such an unusually small bulge (≈15% of the stellar mass, Bagchi et al. 2014, see also Nesvadba et al. 2021). Gas that would normally be inflowing into the center, e.g., along a bar, may start to trigger a new episode of radio activity, which would evacuate this gas from the central regions, either through outflows or a galactic fountain, thereby hindering the growth of a massive bulge. Ruffa et al. (2019) and Ruffa et al. (2022) observed a somewhat similar phenomenology in the low-excitation radio galaxy NGC 3100, which has however, lower-power jets (P1.4 GHz = 1023 W Hz−1), a smaller (D = 1.6 kpc) molecular ring of lower (Mgas = 1.4 × 10⁸ M⊙) molecular gas mass, and radio jets that have not yet escaped from their host galaxy.
8.3.2. Absence of young star-forming regions in the interaction region
There seems to be another effect that the radio jet has on the host galaxy, as is suggested by Fig. 6, where we showed the electron densities in the warm ionized gas measured from the [SII]λλ6716,6731 line ratio together with the Hα morphology and radio contours. Electron densities are typically a few 10 cm−3 in most of the disk, consistent with the typical conditions within normally star-forming spiral galaxies. However, along a 7.5″ (11 kpc) wide band reaching north-south, and extending west from the nucleus, that is associated with the radio emission, electron densities are strongly enhanced, reaching values of 1000 cm−3 (Sect. 4.3). As discussed in Sect. 4.3, such high electron densities are only found in over-pressured bubbles inflated by star formation or AGN feedback from radiation or radio jets. The low luminosity of the AGN (Sect. 3), shock-like line ratios (Sect. 4, and large distance from the nucleus (up to 11 kpc), favors the passage of the radio jet as the cause of the enhanced electron density. Furthermore, the distribution of regions of enhanced electron density are consistent with the cylindrically symmetric compression by a jet, which is observed at these locations in radio emission. A bubble inflated by AGN photoionization would be expected to leave a bipolar distribution of enhanced electron densities as radiation escapes through the polar direction of the torus, which is not observed.
The figures clearly show that all star-forming regions (except the faint region (e), which is near the edge of this region) fall outside the region of enhanced electron densities. The absence of star forming regions in this area is also obvious in Fig. 4. This serves as additional evidence that the interactions between jet and gas can lower the propensity of the gas to form stars, even if it does not lead to fast outflows. Although the gas continues to participate in the overall rotational motion of the disk without obvious kinematic distortion, the internal properties of gas clouds seem to be sufficiently affected by the interactions with the radio jet that the gas fragmentation process leading to star formation elsewhere in this galaxy does not proceed in the usual way, in spite of the presence of high mass-surface density molecular gas. This is somewhat in contradiction at least with the simplest scenarios of positive feedback, where a density enhancement caused by the radio jet should lead to an increase, not a decrease in star formation (e.g., Gaibler et al. 2012; Mukherjee et al. 2018).
To reinforce this comparison between star-forming regions and electron densities, it is important to note that the young age of the star forming regions, t ≤ 11 Myrs, ensures that we do not miss any star formation that would have moved in and out of the interaction region during the lifetime of these regions. At radii of 10–15 kpc from the nucleus, a star-forming region rotating with the disk at velocities of 300 km s−1 will travel about 3.3 kpc, which is about twice the size of the seeing disk. This is not sufficient for the star forming regions overall to have changed their position relative to the region of overpressured gas in a significant way. We conclude that the current positions of these star-forming regions are still representative of the position they had during the onset of star formation.
9. Summary and conclusions
We have presented new VLT/MUSE imaging spectroscopic observations of J2345−0449, a massive, late-type spiral galaxy with extended radio jets. It has also a bright X-ray halo, and a 24 kpc wide ring of molecular hydrogen with enhanced line widths, that is associated with the inner disk. The source-integrated star formation rate falls short by factors 30 to 70 compared to normal star-forming spiral galaxies, as previously measured with GALEX and WISE. In the present analysis we have focused on the spatially resolved on-going and past star formation as traced by Hα and the optical continuum, and the emission-line gas diagnostics, to study the interplay between radio jets, star formation, and the warm ionized gas. Our main results are:
-
We have used STARLIGHT to analyze the optical continuum emission and reconstruct the star formation history. More than 93% of the total stellar mass was formed at least 10 Gyrs ago, including in the disk. This is a remarkably old age for a spiral galaxy. Intermediate-age and young stellar populations formed a few ×109 yrs and a few ×107 − 8 years ago, respectively, are found predominantly in the inner disk, and contribute ∼5% and less than 2% of the total stellar mass, respectively.
-
At most 2% of the optical continuum near the nucleus is emitted by the AGN. The upper limit of the bolometric AGN luminosity, derived from the stellar continuum at λ = 5100 Å and from the [OIII]5007 flux, respectively, is Lbol ≤ 1.0 × 1043 erg s−1, and Lbol ≤ 3.3 × 1043 erg s−1, repectively. This is 7 − 20 times less than the kinetic energy carried by the radio jets, Ekin, jet = 2 × 1044 erg s−1 (Walker et al. 2015; Cavagnolo et al. 2010). The jets are therefore the dominant form of AGN energy output in this galaxy.
-
The BPT and WHAN diagnostic diagrams show that the warm ionized gas in this galaxy is overall dominated by heating through shocks and old stellar populations, also in the disk. Along the spiral arms, the line ratios fall into the “composite” regime of the BPT diagram, suggesting that they may also contain a subdominant component heated by young stars. The [SII]λλ6716,6731 emission line ratio shows electron densities of a few ×10 cm−3 in most of the disk, and a strong enhancement (350 to 1250 cm−3) in a 7.5″ (11 kpc) wide, north-south band west of the nucleus, which is associated with the extended radio emission from the AGN. High electron pressures in the range of 1000 cm−2 are a typical sign of overpressured gas bubbles inflated by star formation and AGN feedback.
-
Gas extinctions are AV = 0.9 − 2.5 mag, estimated from the Balmer decrement, somewhat higher than those found with STARLIGHT, AV, stellar = 0.5-1.1 mag, potentially due to a different spatial distribution of gas and stellar light. Both estimates are enhanced at the molecular ring, suggesting gas-mass surface densities of Σgas = 24 − 72 M⊙ pc−2, comparable to those previously derived from CO(1–0), using a Milky-Way CO-to-H2 conversion factor. This does not suggest that optically thin gas dominates the molecular gas budget in J2345−0449, and confirms that this is one of the most gas-rich galaxies in the nearby Universe.
-
We identify 13 HII regions with a total SFR = 2.3 M⊙ yr−1, compared to SFR = 0.9 and 2.95 M⊙ yr−1 previously estimated with GALEX and WISE in the UV and infrared, respectively. Only about one third of this star formation, SFR = 0.9 M⊙ yr−1 is associated with the molecular ring previously found with ALMA, the rest, SFR = 1.4 M⊙ yr−1, occurs at larger radii. These star-forming regions are mostly spatially unresolved, and have typical ages of 6–11 Myrs, less than the age of the radio source. They avoid the band of overpressured gas associated with radio emission, contrary to what could be expected in scenarios of positive feedback. Individual regions fall onto the Kennicutt-Schmidt relationship of normal star-forming galaxies, whereas the global average star formation rate in J2345−0449 is 30–70 times less than expected from this relationship.
-
The global Hα kinematics follows that of a rotating disk with velocities of −360 to 300 km s−1, and very small deviations, ≤2%, from pure rotation as found with KINEMETRY. Comparison with a similar analysis done for a synthetic velocity field of a hydrodynamic simulation of a jet-driven outflow escaping from a rotating disk shows significant residuals in the velocity map, that are not reminiscent of our results for J2345−0449. In contrast, the optical line widths near the nucleus and associated with the central depression in CO(1–0) line flux, are strongly enhanced (FWHM up to 400 km s−1), and several broad filaments extend from this region into the disk out to radii of several kpc. In spite of clear signatures for interactions between the radio jet and ambient gas, such as enhanced gas densities and shocked diffuse gas over large regions in the disk, we did not detect any clear outflow signatures.
To summarize, our new MUSE observations confirm the outstanding nature of J2345–0449, which is an excellent target to study the interplay of gas and star formation with radio AGN activity in a massive spiral galaxy. Star formation rates are very low in spite of the very large molecular gas mass. The unusually old age of the dominant stellar population in the disk suggests that star formation has been very limited for most of cosmic time. The presence of a region of overpressured gas associated with the faint extended radio emission, where star formation is nearly absent, suggests that the radio AGN activity is the dominant force behind the suppression of star formation.
Acknowledgments
We would like to thank the anonymous referee for their insightful comments, which helped improved the paper. We also thank the staff at ALMA, and GMRT for carrying out the observations. DM and NPHN acknowledge partial financial support through CEFIPRA program 6504-2. Based on observations collected at the European Organisation for Astronomical Research in the Southern Hemisphere under ESO programme(s) 105.B-0299. This paper makes use of the following ALMA data: ADS/JAO.ALMA#2019.1.01492.S. ALMA is a partnership of ESO (representing its member states), NSF (USA) and NINS (Japan), together with NRC (Canada), MOST and ASIAA (Taiwan), and KASI (Republic of Korea), in cooperation with the Republic of Chile. The Joint ALMA Observatory is operated by ESO, AUI/NRAO and NAOJ. The simulations used in this paper were carried out using the resources of the National Computational Infrastructure (NCI Australia), an NCRIS enabled capability supported by the Australian Government. GMRT is run by the National Centre for Radio Astrophysics of the Tata Institute of Fundamental Research.
References
- Agostino, C. J., Salim, S., Faber, S. M., et al. 2021, ApJ, 922, 156 [NASA ADS] [CrossRef] [Google Scholar]
- Alatalo, K., Lacy, M., Lanz, L., et al. 2015, ApJ, 798, 31 [Google Scholar]
- Bagchi, J., Vivek, M., Vikram, V., et al. 2014, ApJ, 788, 174 [NASA ADS] [CrossRef] [Google Scholar]
- Baldwin, J. A., Phillips, M. M., & Terlevich, R. 1981, PASP, 93, 5 [Google Scholar]
- Bigiel, F., Leroy, A., Walter, F., et al. 2008, AJ, 136, 2846 [NASA ADS] [CrossRef] [Google Scholar]
- Block, D. L., Bournaud, F., Combes, F., et al. 2006, Nature, 443, 832 [NASA ADS] [CrossRef] [Google Scholar]
- Brinchmann, J., Charlot, S., White, S. D. M., et al. 2004, MNRAS, 351, 1151 [Google Scholar]
- Bruzual, G., & Charlot, S. 2003, MNRAS, 344, 1000 [NASA ADS] [CrossRef] [Google Scholar]
- Calzetti, D., Armus, L., Bohlin, R. C., et al. 2000, ApJ, 533, 682 [NASA ADS] [CrossRef] [Google Scholar]
- Calzetti, D., Kennicutt, R. C., Engelbracht, C. W., et al. 2007, ApJ, 666, 870 [Google Scholar]
- Cardelli, J. A., Clayton, G. C., & Mathis, J. S. 1989, ApJ, 345, 245 [Google Scholar]
- Castignani, G., Pandey-Pommier, M., Hamer, S. L., et al. 2020, A&A, 640, A65 [NASA ADS] [CrossRef] [EDP Sciences] [Google Scholar]
- Cavagnolo, K. W., McNamara, B. R., Nulsen, P. E. J., et al. 2010, ApJ, 720, 1066 [Google Scholar]
- Chabrier, G. 2003, PASP, 115, 763 [Google Scholar]
- Cid Fernandes, R., Stasińska, G., Mateus, A., & Vale Asari, N. 2011, MNRAS, 413, 1687 [Google Scholar]
- Croton, D. J., Springel, V., White, S. D. M., et al. 2006, MNRAS, 365, 11 [Google Scholar]
- Dabhade, P., Combes, F., Salome, P., Bagchi, J., & Mahato, M. 2020, A&A, 643, A111 [NASA ADS] [CrossRef] [EDP Sciences] [Google Scholar]
- Davies, R., Baron, D., Shimizu, T., et al. 2020, MNRAS, 498, 4150 [Google Scholar]
- Dekel, A., & Burkert, A. 2014, MNRAS, 438, 1870 [Google Scholar]
- de los Reyes, M. A. C., & Kennicutt, Jr., R. C. 2019, ApJ, 872, 16 [NASA ADS] [CrossRef] [Google Scholar]
- Donnari, M., Pillepich, A., Joshi, G. D., et al. 2021, MNRAS, 500, 4004 [Google Scholar]
- Dopita, M. A., & Sutherland, R. S. 2003, Astrophysics of the Diffuse Universe (Berlin, New York: Springer) [CrossRef] [Google Scholar]
- Dopita, M. A., & Sutherland, R. S. 2004, Astrophysics of the Diffuse Universe (Springer Science& Business Media) [Google Scholar]
- Dubois, Y., Pichon, C., Welker, C., et al. 2014, MNRAS, 444, 1453 [Google Scholar]
- Federrath, C., & Klessen, R. S. 2012, ApJ, 761, 156 [Google Scholar]
- Fernandes, R. C., Mateus, A., Sodré, L., Stasińska, G., & Gomes, J. M. 2005, MNRAS, 358, 363 [CrossRef] [Google Scholar]
- Fiore, F., Feruglio, C., Shankar, F., et al. 2017, A&A, 601, A143 [NASA ADS] [CrossRef] [EDP Sciences] [Google Scholar]
- Förster Schreiber, N. M., Genzel, R., Bouché, N., et al. 2009, ApJ, 706, 1364 [Google Scholar]
- Förster Schreiber, N. M., Renzini, A., Mancini, C., et al. 2018, ApJS, 238, 21 [Google Scholar]
- Gadotti, D. A., Bittner, A., Falcón-Barroso, J., et al. 2020, A&A, 643, A14 [NASA ADS] [CrossRef] [EDP Sciences] [Google Scholar]
- Gaibler, V., Khochfar, S., Krause, M., & Silk, J. 2012, MNRAS, 425, 438 [NASA ADS] [CrossRef] [Google Scholar]
- Gensior, J., Kruijssen, J. M. D., & Keller, B. W. 2020, MNRAS, 495, 199 [NASA ADS] [CrossRef] [Google Scholar]
- Gratier, P., Pety, J., Bron, E., et al. 2021, A&A, 645, A27 [CrossRef] [EDP Sciences] [Google Scholar]
- Güver, T., & Özel, F. 2009, MNRAS, 400, 2050 [Google Scholar]
- Hardcastle, M. J., Evans, D. A., & Croston, J. H. 2007, MNRAS, 376, 1849 [NASA ADS] [CrossRef] [Google Scholar]
- Harrison, C. M., Alexander, D. M., Mullaney, J. R., & Swinbank, A. M. 2014, MNRAS, 441, 3306 [Google Scholar]
- Heckman, T. M., Armus, L., & Miley, G. K. 1990, ApJS, 74, 833 [Google Scholar]
- Heckman, T. M., Kauffmann, G., Brinchmann, J., et al. 2004, ApJ, 613, 109 [Google Scholar]
- Hennebelle, P., & Chabrier, G. 2011, ApJ, 743, L29 [Google Scholar]
- Kakkad, D., Groves, B., Dopita, M., et al. 2018, A&A, 618, A6 [NASA ADS] [CrossRef] [EDP Sciences] [Google Scholar]
- Kennicutt, R. C., Jr 1989, ApJ, 344, 685 [CrossRef] [Google Scholar]
- Kennicutt, R. C., Jr 1998, ApJ, 498, 541 [Google Scholar]
- Kennicutt, R. C., Jr, & De Los Reyes, M. A. C. 2021, ApJ, 908, 61 [NASA ADS] [CrossRef] [Google Scholar]
- Kewley, L. J., Groves, B., Kauffmann, G., & Heckman, T. 2006, MNRAS, 372, 961 [Google Scholar]
- Kewley, L. J., Nicholls, D. C., & Sutherland, R. S. 2019, ARA&A, 57, 511 [Google Scholar]
- Komossa, S., Xu, D. W., & Wagner, A. Y. 2018, MNRAS, 477, 5115 [CrossRef] [Google Scholar]
- Krajnović, D., Cappellari, M., de Zeeuw, P. T., & Copin, Y. 2006, MNRAS, 366, 787 [Google Scholar]
- Krumholz, M. R., Dekel, A., & McKee, C. F. 2012, ApJ, 745, 69 [Google Scholar]
- Labiano, A., García-Burillo, S., Combes, F., et al. 2014, A&A, 564, A128 [NASA ADS] [CrossRef] [EDP Sciences] [Google Scholar]
- Lanz, L., Ogle, P. M., Alatalo, K., & Appleton, P. N. 2016, ApJ, 826, 29 [NASA ADS] [CrossRef] [Google Scholar]
- Leitherer, C., Schaerer, D., Goldader, J. D., et al. 1999, ApJS, 123, 3 [Google Scholar]
- Lelli, F., Duc, P.-A., Brinks, E., et al. 2015, A&A, 584, A113 [NASA ADS] [CrossRef] [EDP Sciences] [Google Scholar]
- Li, J.-T., Zhou, P., Jiang, X., Bregman, J. N., & Gao, Y. 2019, ApJ, 877, 3 [NASA ADS] [CrossRef] [Google Scholar]
- Liu, G., Zakamska, N. L., Greene, J. E., Nesvadba, N. P. H., & Liu, X. 2013, MNRAS, 436, 2576 [NASA ADS] [CrossRef] [Google Scholar]
- Machalski, J., Koziel-Wierzbowska, D., & Jamrozy, M. 2007, Acta Astron., 57, 227 [NASA ADS] [Google Scholar]
- Mahony, E. K., Morganti, R., Emonts, B. H. C., Oosterloo, T. A., & Tadhunter, C. 2013, MNRAS, 435, L58 [NASA ADS] [CrossRef] [Google Scholar]
- Mandal, A., Mukherjee, D., Federrath, C., et al. 2021, MNRAS, 508, 4738 [NASA ADS] [CrossRef] [Google Scholar]
- Martig, M., Bournaud, F., Teyssier, R., & Dekel, A. 2009, ApJ, 707, 250 [Google Scholar]
- Meenakshi, M., Mukherjee, D., Wagner, A. Y., et al. 2022a, MNRAS, 511, 1622 [NASA ADS] [CrossRef] [Google Scholar]
- Meenakshi, M., Mukherjee, D., Wagner, A. Y., et al. 2022b, MNRAS, 516, 766 [NASA ADS] [CrossRef] [Google Scholar]
- Menci, N., Fiore, F., Feruglio, C., et al. 2019, ApJ, 877, 74 [NASA ADS] [CrossRef] [Google Scholar]
- Mirakhor, M. S., Walker, S. A., Bagchi, J., et al. 2021, MNRAS, 500, 2503 [Google Scholar]
- Morganti, R., Tadhunter, C. N., & Oosterloo, T. A. 2005, A&A, 444, L9 [NASA ADS] [CrossRef] [EDP Sciences] [Google Scholar]
- Morganti, R., Oosterloo, T., Oonk, J. B. R., Frieswijk, W., & Tadhunter, C. 2015, A&A, 580, A1 [NASA ADS] [CrossRef] [EDP Sciences] [Google Scholar]
- Mukherjee, D., Bicknell, G. V., Wagner, A. Y., Sutherland, R. S., & Silk, J. 2018, MNRAS, 479, 5544 [NASA ADS] [CrossRef] [Google Scholar]
- Nesvadba, N. P. H., Lehnert, M. D., Eisenhauer, F., et al. 2006, ApJ, 650, 693 [NASA ADS] [CrossRef] [Google Scholar]
- Nesvadba, N. P. H., Lehnert, M. D., De Breuck, C., Gilbert, A. M., & van Breugel, W. 2008, A&A, 491, 407 [NASA ADS] [CrossRef] [EDP Sciences] [Google Scholar]
- Nesvadba, N. P. H., Boulanger, F., Salomé, P., et al. 2010, A&A, 521, A65 [NASA ADS] [CrossRef] [EDP Sciences] [Google Scholar]
- Nesvadba, N. P. H., De Breuck, C., Lehnert, M. D., Best, P. N., & Collet, C. 2017, A&A, 599, A123 [NASA ADS] [CrossRef] [EDP Sciences] [Google Scholar]
- Nesvadba, N., Wagner, A., Mukherjee, D., et al. 2021, A&A, 654, A8 [NASA ADS] [CrossRef] [EDP Sciences] [Google Scholar]
- Netzer, H. 2019, MNRAS, 488, 5185 [NASA ADS] [CrossRef] [Google Scholar]
- Nyland, K., Alatalo, K., Wrobel, J. M., et al. 2013, ApJ, 779, 173 [NASA ADS] [CrossRef] [Google Scholar]
- Ogle, P., Boulanger, F., Guillard, P., et al. 2010, ApJ, 724, 1193 [NASA ADS] [CrossRef] [Google Scholar]
- Ogle, P. M., Jarrett, T., Lanz, L., et al. 2019, ApJ, 884, L11 [Google Scholar]
- Okuda, T., Kohno, K., Iguchi, S., & Nakanishi, K. 2005, ApJ, 620, 673 [NASA ADS] [CrossRef] [Google Scholar]
- Osterbrock, D. E. 1989, Astrophysics of Gaseous Nebulae and Active Galactic Nuclei, 408 [Google Scholar]
- Osterbrock, D. E., & Ferland, G. J. 2006, Astrophysics Of Gas Nebulae and Active Galactic Nuclei (University science books) [Google Scholar]
- Pessa, I., Schinnerer, E., Leroy, A. K., et al. 2022, A&A, 663, A61 [NASA ADS] [CrossRef] [EDP Sciences] [Google Scholar]
- Planck Collaboration VI. 2020, A&A, 641, A6 [NASA ADS] [CrossRef] [EDP Sciences] [Google Scholar]
- Posti, L., Fraternali, F., & Marasco, A. 2019, A&A, 626, A56 [NASA ADS] [CrossRef] [EDP Sciences] [Google Scholar]
- Puech, M., Flores, H., Hammer, F., & Lehnert, M. D. 2006, A&A, 455, 131 [NASA ADS] [CrossRef] [EDP Sciences] [Google Scholar]
- Romeo, A. B., & Fathi, K. 2016, MNRAS, 460, 2360 [NASA ADS] [CrossRef] [Google Scholar]
- Ruffa, I., Davis, T. A., Prandoni, I., et al. 2019, MNRAS, 489, 3739 [NASA ADS] [CrossRef] [Google Scholar]
- Ruffa, I., Prandoni, I., Davis, T. A., et al. 2022, MNRAS, 510, 4485 [NASA ADS] [CrossRef] [Google Scholar]
- Sabater, J., Best, P., Hardcastle, M., et al. 2019, A&A, 622, A17 [NASA ADS] [CrossRef] [EDP Sciences] [Google Scholar]
- Saintonge, A., Tacconi, L. J., Fabello, S., et al. 2012, ApJ, 758, 73 [Google Scholar]
- Saintonge, A., Catinella, B., Tacconi, L. J., et al. 2017, ApJS, 233, 22 [Google Scholar]
- Santoro, F., Tadhunter, C., Baron, D., Morganti, R., & Holt, J. 2020, A&A, 644, A54 [NASA ADS] [CrossRef] [EDP Sciences] [Google Scholar]
- Shi, Y., Helou, G., Yan, L., et al. 2011, ApJ, 733, 87 [NASA ADS] [CrossRef] [Google Scholar]
- Silk, J., & Rees, M. J. 1998, A&A, 331, L1 [NASA ADS] [Google Scholar]
- Singh, V., Ishwara-Chandra, C. H., Sievers, J., et al. 2015, MNRAS, 454, 1556 [NASA ADS] [CrossRef] [Google Scholar]
- Torrey, P., Hopkins, P. F., Faucher-Giguère, C.-A., et al. 2020, MNRAS, 497, 5292 [NASA ADS] [CrossRef] [Google Scholar]
- Veilleux, S., & Osterbrock, D. E. 1987, ApJS, 63, 295 [Google Scholar]
- Walker, S. A., Bagchi, J., & Fabian, A. C. 2015, MNRAS, 449, 3527 [NASA ADS] [CrossRef] [Google Scholar]
- Weinberger, R., Springel, V., Hernquist, L., et al. 2017, MNRAS, 465, 3291 [Google Scholar]
- Wright, R. J., Lagos, C. D. P., Power, C. ,& Mitchell, P. D., 2020, MNRAS, 498, 1668 [NASA ADS] [CrossRef] [Google Scholar]
- Young, L. M., Bureau, M., Davis, T. A., et al. 2011, MNRAS, 414, 940 [NASA ADS] [CrossRef] [Google Scholar]
- Zovaro, H. R. M., Nesvadba, N. P. H., Sharp, R., et al. 2019, MNRAS, 489, 4944 [CrossRef] [Google Scholar]
Appendix A: Global properties of star forming regions
In the following, we list the properties of the bright emission lines in individual star-forming regions. Their positions and global properties have been given in Table A.1 and in Table A.2, depending on whether they fall within the molecular ring or outside.
Emission-line properties in individual star-forming regions associated with the molecular ring.
Emission-line properties in individual star-forming regions outside the molecular ring.
All Tables
Emission line properties near the nucleus, in the inner disk, that we define as the part of the disk that is associated with the molecular ring, and in the outer disk, i.e., beyond the molecular gas.
Emission-line properties in individual star-forming regions associated with the molecular ring.
Emission-line properties in individual star-forming regions outside the molecular ring.
All Figures
|
Fig. 1. J2345–0449 on mega-parsec and kilo-parsec scales. Left: radio-continuum image of J2345–0449 observed with the GMRT at 323 MHz, and showing the relative position and size of the radio source and host galaxy, which we now probe with MUSE. The local rms noise is 0.1 mJy bm−1. Right: SDSS three-color image showing the g, r, and i-bands, with the MUSE Hα contours shown in orange. Small circles in the lower left corner indicate the size of the seeing disk in each channel of the rgb image. The orange circle shows the size of the seeing disk of the Hα image. |
| In the text | |
|
Fig. 2. Two examples of spectra used for this analysis, extracted from 0.6″ × 0.6″ apertures within a star forming region (left), and in the outskirts of the disk (right), within the rest-frame of the galaxy. |
| In the text | |
|
Fig. 3. Diagnostic diagrams. Top: Optical diagnostic diagram for our target showing the [OIII]/Hβ versus [NII]/Hα line ratios, following Veilleux & Osterbrock (1987) and Kewley et al. (2019). Left: Light gray areas show the large sample of nearby galaxies of Brinchmann et al. (2004) taken from the SDSS. Orange, purple and red data points indicate gas in each spatial pixel of J2345−0449 that is photoionized by star formation, shocks, and AGN photons, respectively. Blue points mark regions that fall into the regime where star formation and shocks likely coexist. Typical measurement uncertainties are shown in the as cross in the lower left corner. Right: Spatial distribution of these areas in J2345−0449. Contours show the Hα morphology. The circle in the lower left corner indicates the size of the PSF. The black dashed lines show the radio-jets aperture angle. Bottom: Diagnostic diagram using the [NII]/Hα line ratios and Hα equivalent widths (Cid Fernandes et al. 2011, WHAN diagram). Left: Orange, purple, and cyan data points indicate emission photoionized predominantly by HII regions, shocks, and evolved stellar populations, respectively. The cross in the upper left corner represents typical measurement uncertainties. Right: Map of J2345−0449 indicating where the different ionizing sources identified with the WHAN diagram dominate. Contours show the Hα morphology. The size of the PSF is shown as circle in the lower left corner. |
| In the text | |
|
Fig. 4. Hα map of our target. Red contours indicate individual star forming regions identified by the BPT diagram (Fig. 3) and/or identified by an Hα luminosity greater than 13 × 1038 erg s−1. The position of the molecular ring previously observed with ALMA in CO(1–0) is shown as black contours. The small black circle in the lower left corner shows the FWHM size of the PSF. |
| In the text | |
|
Fig. 5. Rest-frame integrated spectrum measured in a 1.4″ aperture centered on the nucleus. The black line shows the measured flux density normalized to the flux at λ = 6270 Å. The best-fit model of the stellar continuum obtained with STARLIGHT is plotted in red. The purple line below shows the continuum-subtracted emission-line spectrum. |
| In the text | |
|
Fig. 6. Electron density, ne, measured from the flux ratio of [SII]λ6716/[SII]λ6731. Top: electron density map. Black contours show the Hα flux, pink contours the radio emission observed with FIRST. Bottom: Integrated [SII]λλ6716,6731 spectra of J2345–0449 extracted from regions with electron densities, ne, below (left panel) and above 600 cm−3 (right panel). Data are shown as black histograms, Gaussian fits as orange lines. The line ratio, r, and its uncertainties is listed above each spectrum. |
| In the text | |
|
Fig. 7. Dust extinction, AV, given in magnitudes, and measured (left) from the stellar continuum, and (right) from the measured Hα/Hβ line ratios and Balmer decrements. In both panels, the highest values are found in the southern part of the inner disk, that is also associated with the CO(1–0) line emission. Black contours in the left panel show the molecular ring, and in the right panel the principal features in the Hα map. |
| In the text | |
|
Fig. 8. Mass surface densities of stellar populations in different age ranges. We can note the different units in each panel. Old stellar populations formed ≥10 Gyrs are by far the dominant mass component, contributing ≥93% to the stellar mass throughout the disk and bulge. The distributions of young and intermediate-age stellar populations are shown in the two lower panels. |
| In the text | |
|
Fig. 9. Cumulative stellar mass as a function of age in the center, the inner, and outer disk, respectively. The inner disk corresponds to the radii covered by the molecular ring. All regions are also shown on Fig. 4. |
| In the text | |
|
Fig. 10. Kinematics maps extracted from Hα. Left: relative velocities and right: gaussian line widths, σ. All velocities are given relative to a redshift z = 0.0755. Colorbars show velocities and widths in km s−1. |
| In the text | |
|
Fig. 11. Hα position-velocity diagram. Orange contours show the best-fit model obtained with KINEMETRY, and blue contours the CO(1–0) results of Nesvadba et al. (2021). The [NII] lines cause the fainter features below and above the central Hα line. The line shift is due to differing wavelength of lines. |
| In the text | |
|
Fig. 12. Left: Best fit kinemetry models of the relative velocities extracted from Hα. Right: Residual map of relative velocities – kinemetry model. All velocities are given relative to a redshift z = 0.0755. Colorbars show velocities in km s−1. |
| In the text | |
|
Fig. 13. Synthetic velocity field of Simulation D of Mukherjee et al. (2018, see also Meenakshi et al. 2022a,b) showing a radio jet escaping in north-south direction from a rotating disk. The left panel shows the full-resolution simulation, the right panel is smoothed to the same spatial sampling as our MUSE data of J2345−0449. |
| In the text | |
|
Fig. 14. Main rotational velocity component as calculated with KINEMETRY (left) and the residuals between the full velocity field and the main rotational component (right). |
| In the text | |
|
Fig. 15. Na D interstellar absorption lines seen against the nucleus of J2345–0449. Orange and red lines indicate the Gaussian fits to the doublet. |
| In the text | |
|
Fig. 16. Star formation rate surface density as a function of molecular gas mass surface density in J2345–0449 (Kennicutt-Schmidt relationship). Individual star-forming regions in J2345–0449 (red dot symbols) fall onto the relationship of ordinary star-forming galaxies, whereas the global averages of molecular gas mass and star formation rate surface densities fall a factor 30-70 below. The properties of individual star-forming regions are listed in Table A.1. |
| In the text | |
Current usage metrics show cumulative count of Article Views (full-text article views including HTML views, PDF and ePub downloads, according to the available data) and Abstracts Views on Vision4Press platform.
Data correspond to usage on the plateform after 2015. The current usage metrics is available 48-96 hours after online publication and is updated daily on week days.
Initial download of the metrics may take a while.