Fig. 4.
Download original image
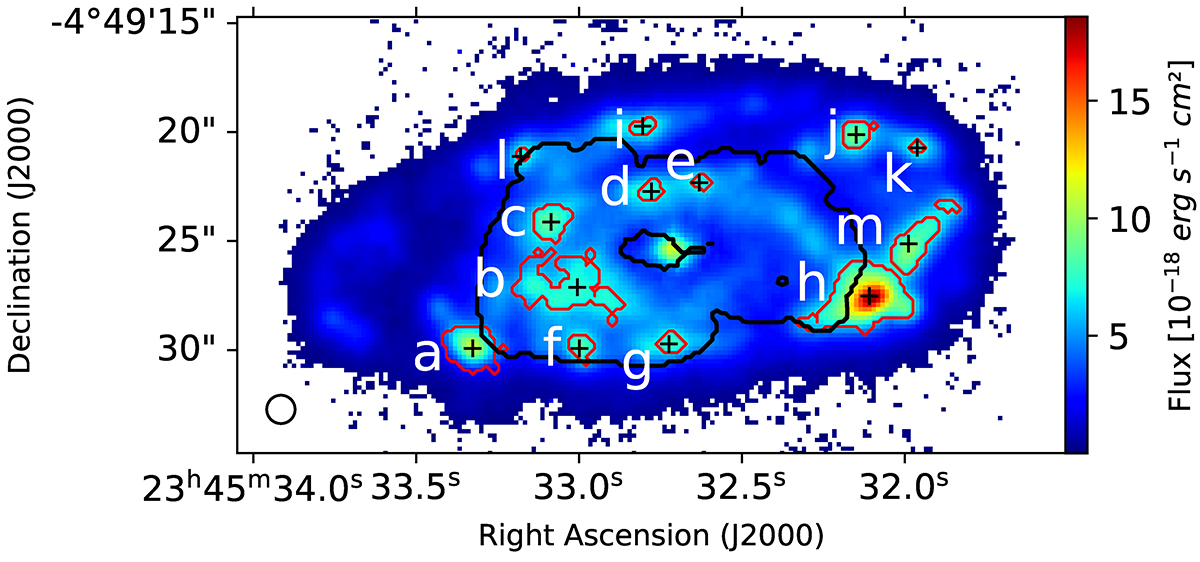
Hα map of our target. Red contours indicate individual star forming regions identified by the BPT diagram (Fig. 3) and/or identified by an Hα luminosity greater than 13 × 1038 erg s−1. The position of the molecular ring previously observed with ALMA in CO(1–0) is shown as black contours. The small black circle in the lower left corner shows the FWHM size of the PSF.
Current usage metrics show cumulative count of Article Views (full-text article views including HTML views, PDF and ePub downloads, according to the available data) and Abstracts Views on Vision4Press platform.
Data correspond to usage on the plateform after 2015. The current usage metrics is available 48-96 hours after online publication and is updated daily on week days.
Initial download of the metrics may take a while.