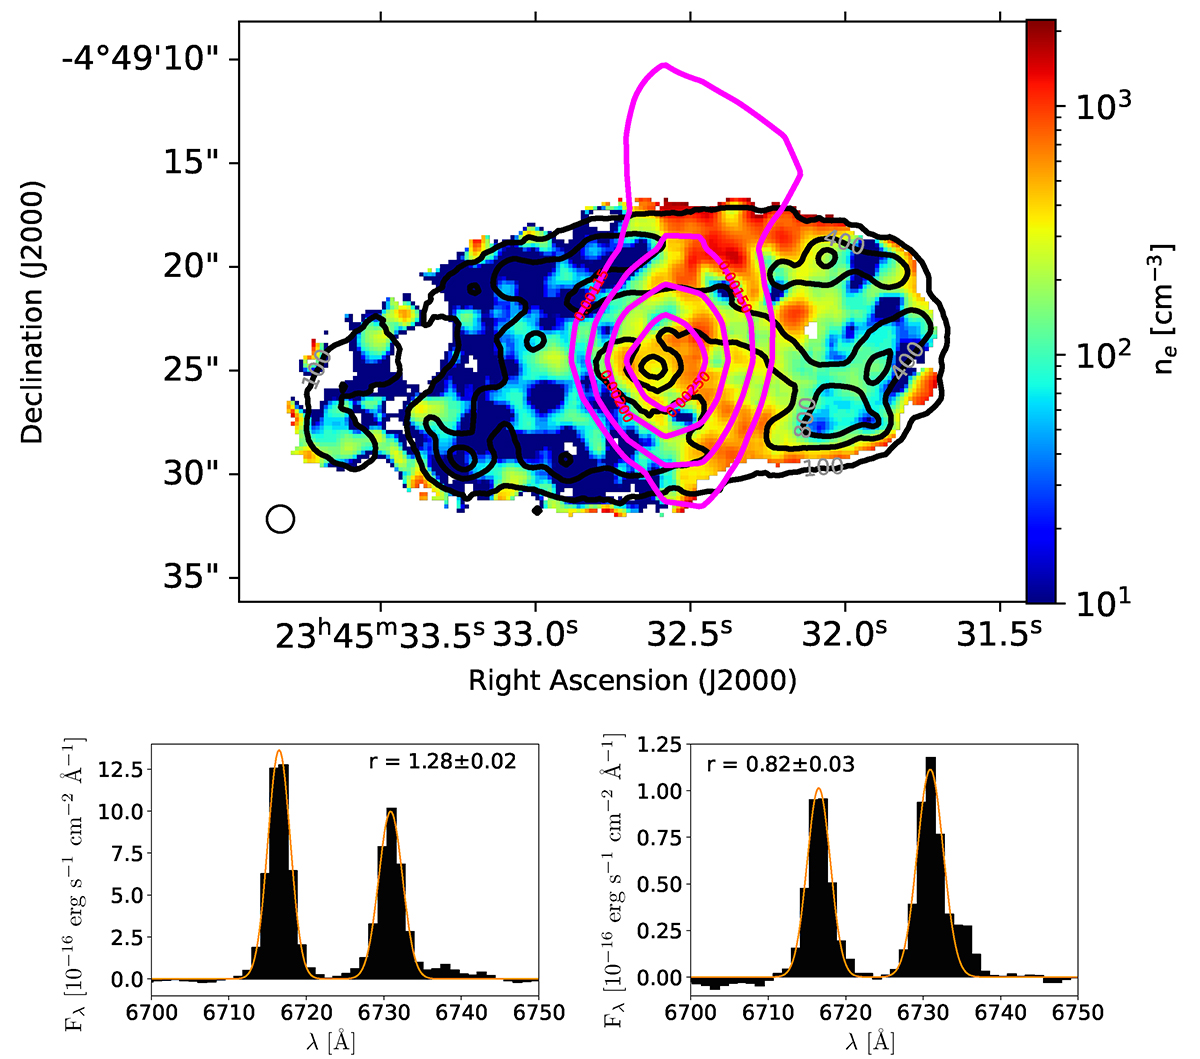
Fig. 6.
Download original image
Electron density, ne, measured from the flux ratio of [SII]λ6716/[SII]λ6731. Top: electron density map. Black contours show the Hα flux, pink contours the radio emission observed with FIRST. Bottom: Integrated [SII]λλ6716,6731 spectra of J2345–0449 extracted from regions with electron densities, ne, below (left panel) and above 600 cm−3 (right panel). Data are shown as black histograms, Gaussian fits as orange lines. The line ratio, r, and its uncertainties is listed above each spectrum.
Current usage metrics show cumulative count of Article Views (full-text article views including HTML views, PDF and ePub downloads, according to the available data) and Abstracts Views on Vision4Press platform.
Data correspond to usage on the plateform after 2015. The current usage metrics is available 48-96 hours after online publication and is updated daily on week days.
Initial download of the metrics may take a while.