Open Access
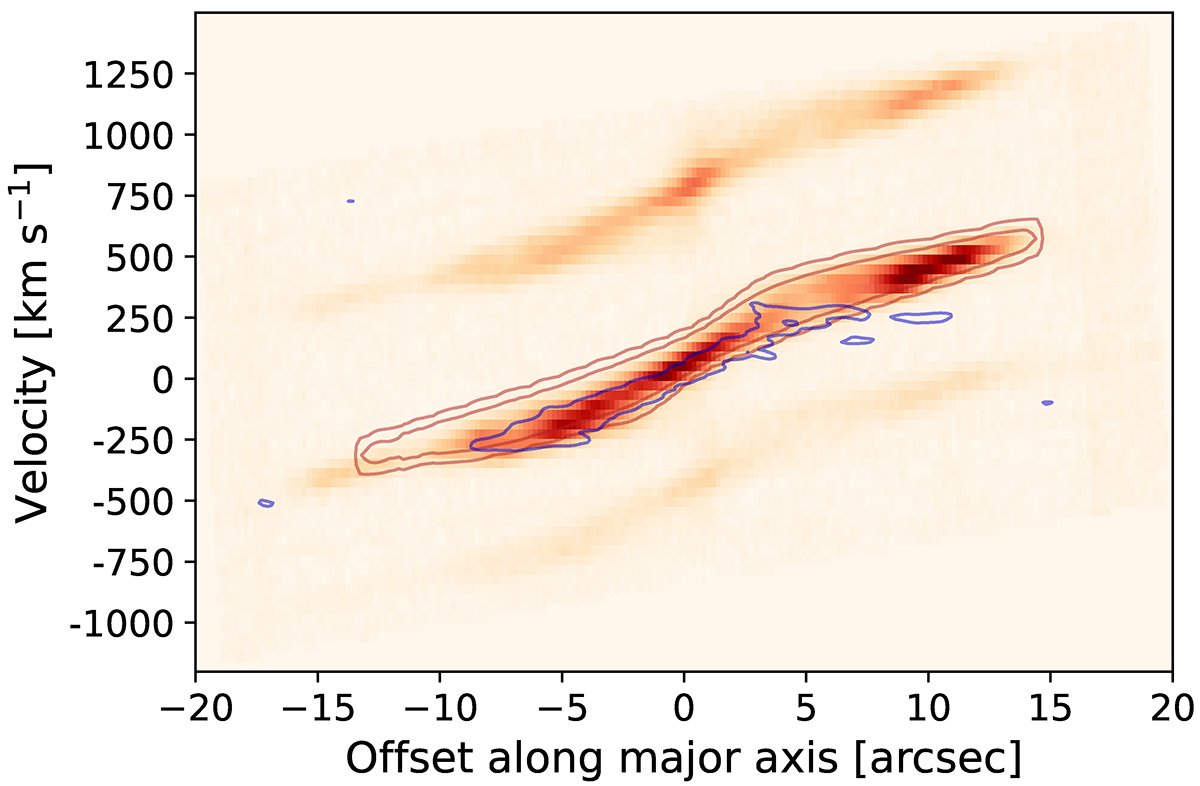
Fig. 11.
Download original image
Hα position-velocity diagram. Orange contours show the best-fit model obtained with KINEMETRY, and blue contours the CO(1–0) results of Nesvadba et al. (2021). The [NII] lines cause the fainter features below and above the central Hα line. The line shift is due to differing wavelength of lines.
Current usage metrics show cumulative count of Article Views (full-text article views including HTML views, PDF and ePub downloads, according to the available data) and Abstracts Views on Vision4Press platform.
Data correspond to usage on the plateform after 2015. The current usage metrics is available 48-96 hours after online publication and is updated daily on week days.
Initial download of the metrics may take a while.