Fig. 3.
Download original image
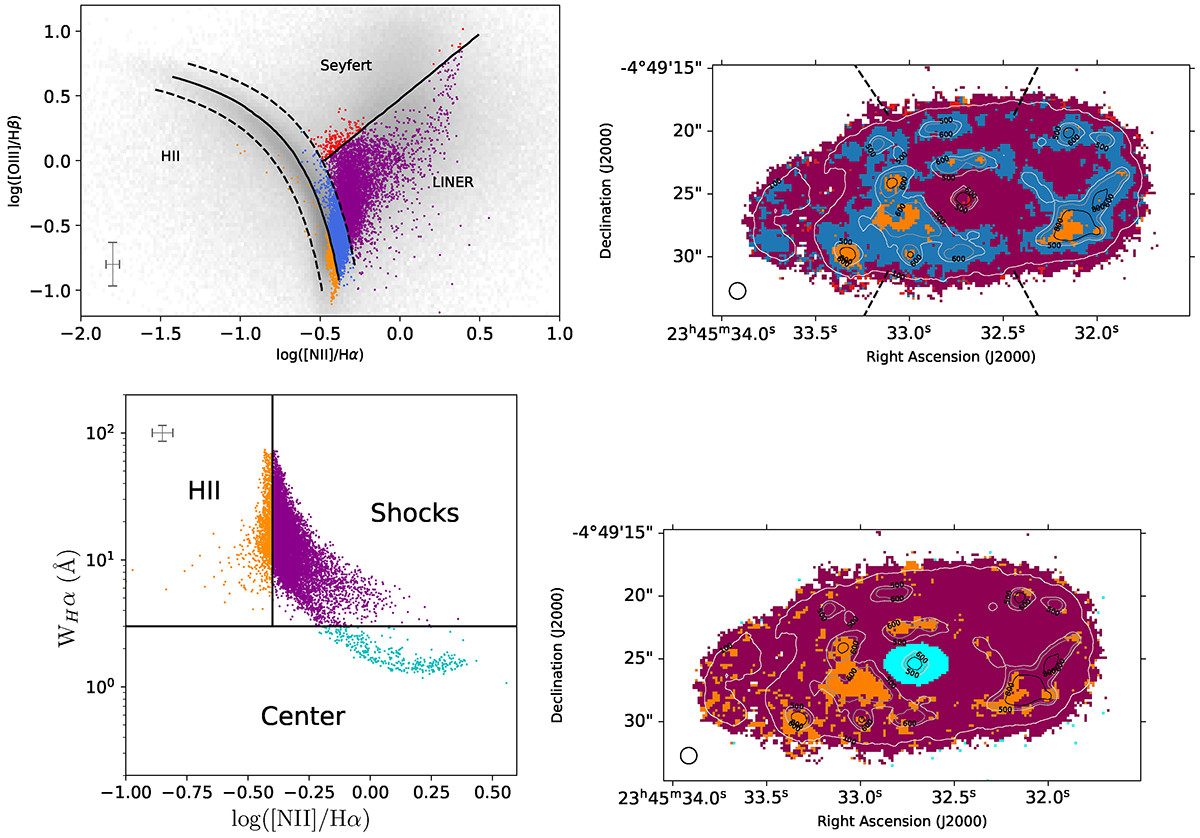
Diagnostic diagrams. Top: Optical diagnostic diagram for our target showing the [OIII]/Hβ versus [NII]/Hα line ratios, following Veilleux & Osterbrock (1987) and Kewley et al. (2019). Left: Light gray areas show the large sample of nearby galaxies of Brinchmann et al. (2004) taken from the SDSS. Orange, purple and red data points indicate gas in each spatial pixel of J2345−0449 that is photoionized by star formation, shocks, and AGN photons, respectively. Blue points mark regions that fall into the regime where star formation and shocks likely coexist. Typical measurement uncertainties are shown in the as cross in the lower left corner. Right: Spatial distribution of these areas in J2345−0449. Contours show the Hα morphology. The circle in the lower left corner indicates the size of the PSF. The black dashed lines show the radio-jets aperture angle. Bottom: Diagnostic diagram using the [NII]/Hα line ratios and Hα equivalent widths (Cid Fernandes et al. 2011, WHAN diagram). Left: Orange, purple, and cyan data points indicate emission photoionized predominantly by HII regions, shocks, and evolved stellar populations, respectively. The cross in the upper left corner represents typical measurement uncertainties. Right: Map of J2345−0449 indicating where the different ionizing sources identified with the WHAN diagram dominate. Contours show the Hα morphology. The size of the PSF is shown as circle in the lower left corner.
Current usage metrics show cumulative count of Article Views (full-text article views including HTML views, PDF and ePub downloads, according to the available data) and Abstracts Views on Vision4Press platform.
Data correspond to usage on the plateform after 2015. The current usage metrics is available 48-96 hours after online publication and is updated daily on week days.
Initial download of the metrics may take a while.