| Issue |
A&A
Volume 674, June 2023
|
|
|---|---|---|
| Article Number | A223 | |
| Number of page(s) | 8 | |
| Section | Extragalactic astronomy | |
| DOI | https://doi.org/10.1051/0004-6361/202346307 | |
| Published online | 27 June 2023 | |
The Northern Cross Fast Radio Burst project
III. The FRB–magnetar connection in a sample of nearby galaxies
1
INAF-Istituto di Radio Astronomia (IRA), Via Piero Gobetti 101, Bologna, Italy
e-mail: This email address is being protected from spambots. You need JavaScript enabled to view it.
2
Dipartimento di Fisica e Astronomia, Universitá di Bologna, Via Gobetti 93/2, 40129 Bologna, Italy
3
South African Radio Astronomy Observatory, Black River Park, 2 Fir Street, Observatory, Cape Town, 7925
South Africa
4
Department of Physics and Electronics, Rhodes University, PO Box 94 Grahamstown, 6140
South Africa
5
INAF-Osservatorio Astronomico di Cagliari, Via della Scienza 5, 09047 Cuccuru Angius, Selargius CA, Italy
6
Università degli Studi di Cagliari, Dipartimento di Fisica, S.P. Monserrato-Sestu km 0.7, 09042 Monserrato, CA, Italy
7
INAF-Osservatorio di Astrofisica e Scienza dello Spazio di Bologna, Via Piero Gobetti 93/3, 40129 Bologna, Italy
8
Institute of Space Sciences and Astronomy (ISSA) Maths and Physics Building, University of Malta, Msida, MSD, 2080
Malta
9
INAF/IAPS, Via del Fosso del Cavaliere 100, 00133 Roma RM, Italy
10
Università degli Studi di Roma “Tor Vergata”, Via della Ricerca Scientifica 1, 00133 Roma RM, Italy
11
SSDC/ASI, Via del Politecnico snc, 00133 Roma RM, Italy
12
INAF-Osservatorio Astronomico di Roma, Via Frascati 33, 00078 Monte Porzio Catone RM, Italy
Received:
2
March
2023
Accepted:
26
April
2023
Abstract
Context. Fast radio bursts (FRBs) are millisecond radio transients observed at cosmological distances. The nature of their progenitors is still a matter of debate, although magnetars are invoked by most models. The proposed FRB–magnetar connection was strengthened by the discovery of an FRB-like event from the Galactic magnetar SGR J1935+2154.
Aims. In this work we aim to investigate how prevalent magnetars such as SGR J1935+2154 are within FRB progenitors.
Methods. To this end, we carried out an FRB search in a sample of seven nearby (< 12 Mpc) galaxies with the Northern Cross Radio Telescope for a total of 692 h.
Results. We detected one 1.8 ms burst in the direction of M 101 with a fluence of 58 ± 5 Jy ms. Its dispersion measure of 303 pc cm−3 places it most likely beyond M 101. Considering that no significant detection comes indisputably from the selected galaxies, we place a 38 yr−1 upper limit on the total burst rate (i.e. including the whole sample) at the 95% confidence level. This upper limit constrains the event rate per magnetar to λmag < 0.42 magnetar−1 yr−1 or, if combined with literature observations of a similar sample of nearby galaxies, it yields a joint constraint of λmag < 0.25 magnetar−1 yr−1. We also provide the first constraints on the expected rate of FRBs hypothetically originating from ultra-luminous X-ray (ULX) sources, since some of the galaxies observed during our observational campaign host confirmed ULXs. We obtain < 13 yr−1 per ULX for the total sample of galaxies observed.
Conclusions. Our results indicate that bursts with energies E > 1034 erg from magnetars such as SGR J1935+2154 appear more rarely compared to previous observations and further disfavour them as unique progenitors for the cosmological FRB population. This provides support to the idea that there is a greater contribution from a population of more exotic magnetars not born via core-collapsed supernovae.
Key words: Local Group / methods: observational / stars: magnetars
© The Authors 2023
 Open Access article, published by EDP Sciences, under the terms of the Creative Commons Attribution License (https://creativecommons.org/licenses/by/4.0), which permits unrestricted use, distribution, and reproduction in any medium, provided the original work is properly cited.
This article is published in open access under the Subscribe to Open model. This email address is being protected from spambots. You need JavaScript enabled to view it. to support open access publication.
1. Introduction
Fast radio bursts (FRBs) are millisecond-long, highly dispersed radio signals with exceptionally high brightness temperatures (1032 − 1035 K) of extragalactic origin (Thornton et al. 2013; Cordes & Chatterjee 2019; Petroff et al. 2019, 2022; Pilia 2021). Since their discovery (Lorimer et al. 2007), about 600 distinct FRB sources have been observed (CHIME/FRB Collaboration 2021), with a host galaxy association for about 25 of them (Tendulkar et al. 2017; Bannister et al. 2019; Ravi et al. 2019, 2022, 2023; Prochaska et al. 2019; Macquart et al. 2020; Marcote et al. 2020; Bhardwaj et al. 2021b; Niu et al. 2022; Nimmo et al. 2022; Ryder et al. 2022; Bhandari et al. 2023; Driessen et al. 2023; Sharma et al. 2023). Moreover, 50 FRBs were found to be repeating (CHIME/FRB Collaboration 2023), with recent statistical evidence indicating that repeaters may represent a distinct class of sources (Hashimoto et al. 2020; Pleunis et al. 2021; Zhong et al. 2022; Guo & Wei 2022; CHIME/FRB Collaboration 2023). Up to now, only two repeaters, FRB 20180916B and FRB 20121102, have shown periodic activity, with periods of ∼16.33 ± 0.12 (Pleunis et al. 2021) and ∼161 ± 5 days (Cruces et al. 2021), respectively.
Of the progenitor candidates, magnetars – neutron stars (NSs) powered by the decay of their strong (1014 − 1016 G) magnetic field (Duncan & Thompson 1992; Rea & Esposito 2011; Turolla et al. 2015; Kaspi & Beloborodov 2017) – are the most widely considered. The FRB–magnetar connection was strengthened by the detection of FRB 20200428, the first Galactic FRB-like event discovered (CHIME/FRB Collaboration 2020; Bochenek et al. 2020); it was observed simultaneously with an X-ray burst (Mereghetti et al. 2020; Ridnaia et al. 2020; Li et al. 2021; Tavani et al. 2021), emitted by the soft gamma repeater J1935+2154 (SGR1935 – hereafter), one of the most active known magnetars (Stamatikos et al. 2014; Lien et al. 2014; Cummings 2014; Kozlova et al. 2016; Younes et al. 2017). The reported isotropic-equivalent energy emitted at radio wavelengths by this burst, ESGR ≃ 2 × 1034 erg (Bochenek et al. 2020; Margalit et al. 2020), lies between those of the energetic pulsar giant radio pulses (see e.g., Kuzmin 2007) and extragalactic FRBs. Further observations revealed fainter bursts from SGR1935 (Zhang et al. 2020; Burgay et al. 2020; Good & CHIME/FRB Collaboration 2020; Alexander & Fedorova 2020; Kirsten et al. 2021; Dong & CHIME/FRB Collaboration 2022; Maan et al. 2022; Huang et al. 2022; Pearlman & CHIME/FRB Collaboration 2022).
Since magnetars are connected to a young stellar population, they are expected to be found in regions of star formation. While this has been observed for some FRBs (Chatterjee et al. 2017; Marcote et al. 2017, 2020; Bassa et al. 2017; Tendulkar et al. 2017, 2021; Ravi et al. 2019; Bhardwaj et al. 2021b; Piro et al. 2021; Niu et al. 2022; Nimmo et al. 2022), others have been found in galaxies with low star formation rates (SFRs), mainly in their outskirts (Heintz et al. 2020; Mannings et al. 2021; Bhandari et al. 2022). Notably, the repeating FRB 20200120E was recently found in a globular cluster in the nearby galaxy (NG) M 81 (Kirsten et al. 2022). It is also theoretically possible to find young magnetised NSs in globular clusters, formed either via the accretion-induced collapse of a white dwarf (WD; Tauris et al. 2013; Wang & Liu 2020) or the collapse of a compact binary system induced by a WD-WD, WD-NS or NS-NS merger (Giacomazzo & Perna 2013; Schwab et al. 2016; Zhong & Dai 2020).
CHIME/FRB Collaboration (2020) observed a sample of 15 NGs within 12 Mpc with SFRs higher than that of the Milky Way (MW) in order to search for SGR1935-like FRBs–(i.e. bursts with energy E0 > 4 × 1034 erg). The advantage of targeting NGs over the MW is that the whole population of magnetars is simultaneously observed, therefore increasing the probability of detecting a burst with respect to individual magnetars. No bursts were observed, allowing them to place a constraint on the burst rate of SGR1935-like events 0.007 < λmag < 0.4 yr−1 magnetar−1, where the lower limit is set by the detection of the SGR1935 burst itself (CHIME/FRB Collaboration 2020).
In this work we present long monitoring observations of a sample of NGs taken with the Northern Cross (NC) Radio Telescope in the search for FRBs with the aim to study the FRB–magnetar connection, following CHIME/FRB Collaboration (2020). We note that some of the galaxies observed within our observational campaign host confirmed ultra–luminous X-ray (ULX) sources, accreting binary systems with X-ray luminosities LX ≥ 1039 erg s−1, which is significantly higher than any X-ray luminosity emitted by stellar processes (Fabbiano 1989; Kaaret et al. 2017).
The paper is structured as follows: Sect. 2.1 describes the observations and the sample of NGs observed, Sect. 3 presents constraints on the FRB burst rate of magnetars (Sect. 3.1) and ULXs (Sect. 3.2) determined using these observations. Finally, the implications that our constraints have on the connection between FRBs and their progenitors, along with our conclusions, are discussed in Sect. 4.
2. An FRB search in a sample of nearby galaxies
2.1. Sample description and observations
Our sample consists of seven galaxies within a maximum distance of 12 Mpc, whose characteristics are summarized in Table 1. We selected them based on their reported high SFRs, since magnetars such as SGR1935, born through core-collapse supernovae (CCSNe), trace young star formation sites. Apart from M 31 and IC 342, all the galaxies were already included in the sample observed by CHIME/FRB Collaboration (2020). We included M 31 for its proximity and similarity to the MW. As already mentioned, among the galaxies observed, M 82, M 101, IC 342 and NGC 6946 host confirmed ULXs. They are M 82 X-1 (Ptak & Griffiths 1999), M 101 X-1 (Stetson et al. 1998), IC 342 X-1, IC 342 X-2 (Rana et al. 2015) and NGC 6946 X-1 (Fabbiano & Trinchieri 1987; Roberts & Colbert 2003). These objects are currently believed to be the result of super-Eddington accretion onto a stellar mass black hole (BH; e.g. Liu et al. 2013), or a NS (Pintore et al. 2020, and references therein).
Properties of the observed NG sample.
We monitored each galaxy daily during its transit through the telescope’s primary beam using eight cylinders of the north-south arm of the array (we refer the reader to Locatelli et al. 2020, for details of the system). Due to limitations of the current acquisition software, a source cannot be tracked continuously as it moves across the telescope’s field of view; therefore, we employed the ‘shift and track’ strategy used in Trudu et al. (2022), where seven discrete delay values are approximately equally spaced in angular size to cover the field of view. The resulting telescope beam pattern is shown in Fig. 1, where the seven peaks corresponding to the seven beam-forming delays are clearly visible. Such a beam pattern implies that the sensitivity to the source varies by up to 40% as it transits through the primary beam. As the variation in the beam response within each delay bin is small (≈10%), in the following analysis we assume it to be constant and equal to its average value (dashed line in Fig. 1). The energy detection threshold, Emin, for a burst observed in the delay bin j from the galaxy i can be written as
 (1)
(1)
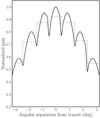 |
Fig. 1. Normalized NC beam-forming response (solid line) as the source transits across the telescope field of view. Dashed lines represent the average value of the telescope beam response for each delay bin. |
where Di is the source distance, Δν = 16 MHz the observing bandwidth, Aj the average beam gain in the jth delay bin and F = 38 Jy ms the NC fluence threshold corresponding to the peak of the central beam assuming a 10σ detection threshold (Trudu et al. 2022). In this work we assume 1 ms as the reference burst duration.
Observations started on December 26, 2021, and ended on August 21, 2022, for a total of 692 h. Data were stored to disk with a time resolution of 138.24 μs and a frequency channel width of 14.468 kHz. We calibrated our data using interferometric observations of Case A (see Locatelli et al. 2020, for details on the calibration procedure), carried out approximately at the beginning, halfway and at the end of the observational campaign. Receiver phases and amplitudes remained fairly constant over week-long timescales; nevertheless, our observing campaign was interspersed with monthly observations of the pulsar B0329+54 and the repeating FRB 20180916B (CHIME/FRB Collaboration 2019). Both sources served as calibration tests for the stability of our system and, at the same time, FRB 20180916B was observed within its window of expected activity (CHIME/FRB Collaboration 2019; Pastor-Marazuela et al. 2021; Pleunis et al. 2021; Trudu et al. 2022) for the purpose of obtaining multiwavelength observations (Pilia et al. 2020; Tavani et al. 2020; Trudu et al. 2022).
We regularly detected single pulses from B0329+54 at its nominal dispersion measure (DM), ∼26.8 pc cm−3 (Hassall et al. 2012), and detected two new bursts from FRB 20180916B, in addition to those presented in Trudu et al. (2022), in agreement with the expected repetition rate.
Figure 2 shows their de-dispersed waterfall plots, labelled B4 and B5 to follow the Trudu et al. (2022) nomenclature, and their best-fit values are listed in Table 2. These detections provide evidence for calibration stability across the whole campaign.
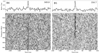 |
Fig. 2. Bursts from FRB 20180916B observed on April 30th 2022 (left panel) and August 9th 2022 (right panel), respectively. Bottom panels show the dynamic spectra, while the top panels show the frequency averaged profiles. The best-fit DMs (in pc cm−3) at which the bursts were de-dispersed are reported in the top right corner of each plot. Data were down-sampled to have 64 frequency channels, each 0.25 MHz wide, and time bins with 2.2 ms width for better display. |
Properties of B4 and B5 bursts from FRB 20180916B.
The search for FRBs in our galaxy sample was performed using the SPANDAK pipeline (Gajjar et al. 2018), which flags radio frequency interference (RFI) through RFIFIND (Ransom et al. 2002) and searches for single pulses with HEIMDALL (Barsdell et al. 2012). We used the same search setup described in Trudu et al. (2022), within the 0 < DM < 1000 pc cm−3 range, with a signal-to-noise ratio (S/N) greater than six and a boxcar duration shorter than 35 ms in order to balance the search time and our scientific goals whilst remaining consistent with the observed width distribution of FRBs (CHIME/FRB Collaboration 2021; Petroff et al. 2022).
2.2. FRB detection from the direction of M 101
We found no candidates with a S/N > 10 throughout the whole campaign and ∼100 candidates with 6 ≤ S/N ≤ 10 that were further visually inspected and double-checked. Most candidates were discarded due to the presence of RFI contamination and noise properties that showed deviations from a theoretical Gaussian distribution. The only candidate that conservatively passed the selection, detected with a S/N ∼ 11, is shown in Fig. 3.
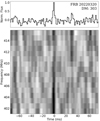 |
Fig. 3. De-dispersed profile of FRB 20220320. The top panel shows the frequency-averaged time series, and the bottom panel shows its dynamic spectrum, coherently de-dispersed at DM = 303 pc cm−3. |
We assessed the likelihood of a candidate signal by computing the number of false candidates with S/N higher than the detection threshold, expected because of noise outliers. The number of false positive events is a function of the S/N and can be computed as (Cordes & McLaughlin 2003)
 (2)
(2)
where NDM is the number of DM trials considered in the FRB search, set internally in HEIMDALL, ΔT the total duration of the observations, dt the time sample duration, and
![Mathematical equation: $$ \begin{aligned} P({>}S/N) = \frac{2}{\sqrt{\pi }} \int _0^x e^{-z^2} \mathrm{d} z \equiv \frac{1}{2} \left[1-\mathrm{erf}\left(\frac{{S/N}}{\sqrt{2}}\right)\right] \end{aligned} $$](/articles/aa/full_html/2023/06/aa46307-23/aa46307-23-eq3.gif) (3)
(3)
the probability that an event is due to a noise statistical fluctuation. In our case, NDM ∼ 3000, ΔT = 692 h, and dt ∼ 138 μs, resulting in Nfalse ∼ 10−9 for S/N ≥ 10. Hence, we consider our candidate to be a genuine FRB.
The burst, hereafter FRB 20220320, was detected on 2022 March 30 UT = 01:14:02.40 (Barycentric time of arrival, ∞ MHz), in the direction of M 101, and its properties are listed in Table 3.
Observational properties of FRB 20220320.
We measured a DM = 303 ± 2 pc cm−3, which disfavours a local origin. The DM contribution along the line of sight of M 101 due to the interstellar medium (ISM) is DMISM ≃ 23 − 31 pc cm−3, according to the NE2001 (Cordes & Lazio 2002, 2003) and the YMW16 (Yao et al. 2017) electron density models, while the contribution from the Galactic halo is ∼50 pc cm−3 (Agarwal et al. 2019; Macquart et al. 2020; Yamasaki & Totani 2020; Lemos et al. 2023). Finally, the intergalactic medium (considering z ≃ 0.001) contributes approximately ∼2 pc cm−3 (Macquart et al. 2020), although this value, for low redshift galaxies, depends on the line of sight (Li et al. 2019). These contributions, if coming from M 101, would imply a moderately high DMhost, ≃220 pc cm−3. In our case, the almost face-on inclination of M 101 seems to disfavour a large DMhost for M 101 (Xu & Han 2015). Although James et al. (2022), by analysing 16 FRBs from Australian Square Kilometre Array Pathfinder (ASKAP) observations, found ⟨DMhost⟩∼186 ± 50 pc cm−3, which would be compatible with an origin from M 101, other works point towards lower values for the host DM contribution (Niino 2020; Zhang et al. 2020). This is further evidence that an association with M 101 is unlikely.
If we consider the burst to be originating farther away, assuming a more conservative value DMhost ≃ 100 pc cm−3, the burst would be placed at a maximum redshift of z ∼ 0.18, that is to say, at a luminosity distance of ∼870 Mpc. For the distance estimation we considered a seven-year Wilkinson Microwave Anisotropy Probe (WMAP7) cosmology (Komatsu et al. 2011) to be consistent with Macquart et al. (2020). Given this maximum redshift, its spectral luminosity would be at most 6.3 × 1033 erg s−1 Hz−1, well within the range of extragalactic FRB spectral luminosities (Bochenek et al. 2020; CHIME/FRB Collaboration 2020; Luo et al. 2020).
3. Upper limits on the FRB repetition rate from our observations
In this section we show how the observations conducted in our NG campaign allowed us to extract important upper limits on the FRB burst rate. In particular, we developed a simple model to calculate the expected rate of FRB events from the whole sample of galaxies listed in Table 1, considering as a first case a single population of SGR1935-like magnetars as FRB progenitors. By taking λmag, the average burst rate per magnetar, and γ, the power-law energy distribution slope for magnetar bursts, as free parameters, we discuss how the upper limits on the rate from the whole galaxy sample translate into upper limits on λmag and γ. We also discuss how our observations coul constrain the FRB event rate if FRBs originated from ULXs. Indeed, accretion-based mechanisms for the FRB engine have been proposed (Waxman 2017; Katz 2017, 2020; Sridhar et al. 2021; Deng et al. 2021).
3.1. SGR1935-like magnetars
We started by computing the total burst rate from our galaxy sample, considering a single population of magnetars similar to SGR1935. This means that we restricted our analysis to magnetars that have radio efficiencies η ∼ 10−5, the ratio of energy radiated in the radio and X-ray bands by SGR1935 (Mereghetti et al. 2020; Ridnaia et al. 2020; CHIME/FRB Collaboration 2020; Bochenek et al. 2020; Tavani et al. 2021), and burst energetics E ≥ E0, where E0 = 2 × 1034 erg is the isotropic radio energy released by FRB 20200428 (Bochenek et al. 2020; Margalit et al. 2020; CHIME/FRB Collaboration 2020). This energy follows by considering d = 7 kpc to be the distance to SGR1935 (Margalit et al. 2020).
Following CHIME/FRB Collaboration (2020), we assumed that the magnetar burst rate ℛ from a given galaxy is proportional to its SFR. We computed the number of SGR1935-like magnetars residing in a certain galaxy by scaling for Nmag/SFRMW, with Nmag = 29 (Olausen & Kaspi 2014; Kaspi & Beloborodov 2017) the number of Galactic magnetars and SFRMW = 1.65 ± 0.19 M⊙ yr−1 the Galactic SFR (Licquia & Newman 2015).
With these prescriptions, the rate expected from the galaxy i of our sample can be expressed as
![Mathematical equation: $$ \begin{aligned} \begin{aligned} \mathcal{R} (\lambda _{\rm mag}, \gamma ; > E_{\mathrm{min}, i,j}) =&N_{\rm mag} \, \frac{\mathrm{SFR}_{i}}{\mathrm{SFR}_{\rm MW}} \\&\times \int _{E_{\mathrm{min}, i,j}}^{E_{\rm max}} K_0 \, \left(\frac{E}{E_0} \right)^{-\gamma } \Theta [E - E_0] \, \mathrm{d}E, \end{aligned} \end{aligned} $$](/articles/aa/full_html/2023/06/aa46307-23/aa46307-23-eq4.gif) (4)
(4)
where Emin, i, j is the minimum burst energy detectable from the galaxy i in the delay bin j (Eq. (1)). The integral is the burst rate energy function, which we assumed to follow a power law with index γ. We note that the Heaviside function, Θ, restricts the case to SGR1935-like bursts (i.e. with energy E ≥ E0). We considered the maximum energy, Emax, to be
 (5)
(5)
with η ∼ 10−5 and Emag the total magnetic energy reservoir for a magnetar with magnetic field B (Margalit et al. 2020):
 (6)
(6)
We considered B = 2 × 10¹⁴ G, the magnetic field strength of SGR1935 (Israel et al. 2016), and verified that a higher value for B does not appreciably affect our results.
The burst rate normalization, K0, can be expressed as a function of the burst rate per magnetar λmag:
 (7)
(7)
yielding:
 (8)
(8)
Equation (4) can therefore be re-written as
 (9)
(9)
We could then compute the total expected burst rate from our NG sample as the sum of the rate for each galaxy in each delay bin, weighted by their corresponding integration time:
 (10)
(10)
where Nb = 7 is the number of delay bins and Ti, j is the total integration time of the ith galaxy in the delay bin j. The total expected burst rate is mildly dependent upon the slope of the energy distribution and much more significantly dependent upon the burst rate per magnetar as can be visually assessed in Fig. 4. Our observations led to a 95% confidence level (CL; Gehrels 1986) upper limit on the total burst rate of ℛtot < 38 yr−1. By imposing this upper limit, we obtain a 95% CL constraint on the burst rate per magnetar that varies between λmag < 0.38 magnetar−1 yr−1 for γ ≤ 1 and λmag < 0.47 magnetar−1 yr−1 for γ ≃ 3. After marginalizing over the energy distribution slope γ, we derive λmag < 0.42 magnetar−1 yr−1.
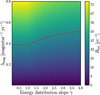 |
Fig. 4. Expected burst rate (colour-map) as a function of the energy distribution slope, γ, and the SGR1935-like burst rate per magnetar, λmag, from the whole observing campaign of NGs. The red line is the 95% CL upper limit obtained via our observations. |
Previous works derived constraints for the magnetar burst rate. In particular, CHIME/FRB Collaboration (2020) obtained 0.007 < λmag < 0.4 magnetar−1 yr−1 at the 95% CL from the detection of FRB 20200428 and the non-detection from a sample of 15 NGs. However, the authors adopted slightly different values than us for the distances and SFRs of the galaxies that are common to our sample (see their Extended Data Table 1), and they considered a lower SFRMW of 1 M⊙ yr−1. If we use their values in our estimate, we obtain λmag < 0.3 magnetar−1 yr−1. By combining our observations with CHIME/FRB Collaboration (2020), we can obtain an even further improved upper limit on λmag. Assuming the distance and SFR values presented in Table 1 for both samples, we recomputed the total rate expected from the joint observations (Eqs. (9) and (10)), which has to be compared with the upper limit obtained from the total observing time (∼1370 h). As a result, we obtain λmag < 0.25 magnetar−1 yr−1 at the 95% CL, the most stringent upper limit on the burst rate per magnetar to date. In Sect. 4 we discuss this result in the framework of the FRB–magnetar connection.
3.2. Ultra-luminous X-ray sources
An alternative formation channel to the more standard magnetar models predicts that FRBs can be produced by short-lived relativistic flares from super-Eddington accreting NSs and BHs (Sridhar et al. 2021). The isotropic energy emitted by this kind of FRB is postulated to lie in the range 1034 erg–1045 erg (Sridhar et al. 2021), which implies that these sources would have been detected with the NC sensitivity. Therefore, the observing time spent on these galaxies is useful for placing an upper limit on the rate of FRBs produced by these accreting objects.
We followed the approach described in Sect. 3 and expressed the rate expected from the population of ULXs, ℛu, i, in the galaxy i of our sample:
 (11)
(11)
where Nu, i is the number of ULX sources expected in the galaxy i and λu is the average burst rate per ULX for energies in the 1034 < E < 1045 erg range. The number of ULX sources can be expressed as a function of the SFR (Kovlakas et al. 2020):
 (12)
(12)
We expect from Eq. (12) a total of ∼14 ULXs in the galaxies we observed. The total expected burst rate, ℛu, tot, from our NG sample then becomes:
 (13)
(13)
The observed upper limit at the 95% CL on the total burst rate is ≃38 yr−1, the same as determined in Sect. 3.1, since it depends only on the total observing time. Therefore, by imposing ℛu, tot < 38 yr−1, we obtain λu < 13 yr−1 for the average burst rate per ULX. This is the first upper limit on the FRB repetition rate hypothetically coming from ULXs. We note that this upper limit is two to three orders of magnitude lower than the reported repetition rate of most active repeaters from FRB 20121102A and FRB 20180916B, r ∼ 103 yr−1 (Margalit et al. 2020). We also find this contrast by computing the repetition rate for confirmed ULXs only, that is to say, without estimating the population of ULXs from Eq. (12) and only considering already discovered ULXs in the galaxies we observed. We report the upper limits obtained for each case in Table 4 and discuss the possible implications of these results in the following section.
Upper limits for the FRB repetition rate (last column) coming from confirmed ULXs.
4. Discussion and conclusions
In this paper we present an FRB search in a sample of seven NGs taken with the NC Radio Telescope. The campaign was 692 h long and yielded the detection of a 58 Jy ms, 1.8 ms long burst with a DM = 303 pc cm−3, observed in the direction of M 101, although most likely coming from a more distant source. Therefore, we consider that no detections came from the monitored galaxies. We used this result to investigate the connection between FRBs and magnetars, by computing the total burst rate, ℛtot, expected from our galaxy sample, assuming, as unique FRB progenitors, magnetars such as SGR J1935+2154, and obtaining ℛtot < 38 yr−1 at the 95% CL. We considered λmag, the average burst rate per magnetar, and γ, the slope of the burst energy distribution, as free parameters for our SFR-based model. In addition, we derived the average FRB rate per ULX from the same observations of NGs. Among the target galaxies of our observational campaign, some host confirmed ULXs, from which, at least theoretically, an FRB would have obtained enough energy (Sridhar et al. 2021) to be detected by the NC.
Since the detection of the Galactic FRB-like signal, it has been tempting to claim that magnetars such as SGR1935 (i.e. magnetars similar in energetics and formed through CCSNe) represent the entire cosmological population of FRBs. Although the implied volumetric rate from the detection of FRB 20200428 is consistent with the faint energy of the cosmological rate density (Lu et al. 2022), SGR1935-like magnetars cannot explain the high repetition rate of active repeaters (Margalit et al. 2020). Moreover, FRB 20200428 is about one order of magnitude fainter than the average FRB (Bochenek et al. 2020; CHIME/FRB Collaboration 2020; Luo et al. 2020), although giant magnetar flares may be bright enough to fill the gap (Margalit et al. 2020). The discrepancy in the repetition rate, along with the discovery of the M81 repeater localized in a globular cluster (Bhardwaj et al. 2021b; Kirsten et al. 2021), led to consider other, more exotic NS formation channels (Kremer et al. 2021, 2023), and question the presence of a single population of magnetars as FRB progenitors.
Our observations do not constrain the burst energy slope well, although they somewhat disfavour flat slopes (γ < 1) over steeper ones (γ > 1). The average burst rate per magnetar is, instead, constrained to be λmag < 0.42 magnetar−1 yr−1. This upper limit halves the range for the magnetar burst rate implied by the detection from the Survey for Transient Astronomical Radio Emission 2 (STARE2; Bochenek et al. 2020), 0.0036 < λmag < 0.8 magnetar−1 yr−1, consistently with the results from Canadian Hydrogen Intensity Mapping Experiment’s (CHIME) NG observations, 0.007 < λmag < 0.4 magnetar−1 yr−1 (CHIME/FRB Collaboration 2020). We also show how the upper limit lowers to λmag < 0.25 magnetar−1 yr−1 if we consider our NG observations combined with the monitoring reported in CHIME/FRB Collaboration (2020).
Considering the STARE2 detection, Margalit et al. (2020) already pointed out that the cosmological FRB rate, including repeating sources, can be explained only by adding a second magnetar population that is younger and with a stronger magnetic field with respect to the SGR1935-like ones (Margalit et al. 2019; Blanchard et al. 2016). This second population includes more exotic magnetars, not born through the usual supernova core collapse, but through a much rarer formation channel. Our constraints imply that the burst rate per magnetar of SGR-like events is approximately a factor of two smaller than previously reported, implying rarer events. From the perspective of a two-population model, our results imply that rare magnetars should be more prominent than considered earlier in order to compensate for the smaller burst rate from SGR1935-like magnetars. Moreover, the detection of FRB 20200120E in a globular cluster (Bhardwaj et al. 2021a; Kirsten et al. 2022) has similar implications (Lu et al. 2022), namely that the formation of magnetars is possible inside globular clusters through compact object mergers, accretion-induced collapse, or a WD-merger-induced collapse (Kirsten et al. 2022; Kremer et al. 2021, 2023). However, the nanosecond structures observed in some bursts from FRB 20200120E could be explained in terms of a recycled millisecond pulsar origin (Majid et al. 2021; Kremer et al. 2021). Hence, it is not clear whether M81-like FRBs could represent this needed population of rarer FRB progenitors.
Among other exotic but prominent progenitor models, we find accretion-based mechanisms (Waxman 2017; Katz 2017, 2020; Sridhar et al. 2021; Deng et al. 2021). In particular, the recent model of Sridhar et al. (2021) is able to explain both the energetics and the chromaticity behaviour seen in FRB 20180916B (Pastor-Marazuela et al. 2021). Estimating the total number of ULXs present in our sample of galaxies to be 14, we have constrained the average rate of FRB events per ULX to λu < 13 yr−1 at the 95% CL. We have also provided individual upper limits for each monitored ULX. These initial estimates show a discrepancy of a few orders of magnitude when compared to the repetition rates of the most active repeaters (Margalit et al. 2020). As already pointed by Sridhar et al. (2021), a strongly magnetised object in the compact pair could be necessary to power cosmological FRB luminosities, making these events much rarer and more difficult to detect. In conclusion, our limits on the burst rate disfavour both magnetars and ULXs as progenitors of very active repeating sources such as FRB 20180916B and FRB 20121102A.
Acknowledgments
We thank the anonymous referee for the useful comments, which helped us improving the quality of the manuscript. The reported data were collected during the phase of the INAF scientific exploitation with the Northern Cross radio telescope.
References
- Agarwal, D., Lorimer, D. R., Fialkov, A., et al. 2019, MNRAS, 490, 1 [NASA ADS] [CrossRef] [Google Scholar]
- Alexander, R., & Fedorova, V. 2020, ATel, 14186, 1 [NASA ADS] [Google Scholar]
- Anand, G. S., Rizzi, L., & Tully, R. B. 2018, AJ, 156, 105 [NASA ADS] [CrossRef] [Google Scholar]
- Bannister, K. W., Deller, A. T., Phillips, C., et al. 2019, Science, 365, 565 [NASA ADS] [CrossRef] [Google Scholar]
- Barsdell, B. R., Bailes, M., Barnes, D. G., & Fluke, C. J. 2012, MNRAS, 422, 379 [CrossRef] [Google Scholar]
- Bassa, C. G., Tendulkar, S. P., Adams, E. A. K., et al. 2017, ApJ, 843, L8 [NASA ADS] [CrossRef] [Google Scholar]
- Bhandari, S., Heintz, K. E., Aggarwal, K., et al. 2022, AJ, 163, 69 [NASA ADS] [CrossRef] [Google Scholar]
- Bhandari, S., Gordon, A. C., Scott, D. R., et al. 2023, ApJ, 948, 67 [NASA ADS] [CrossRef] [Google Scholar]
- Bhardwaj, M., Gaensler, B. M., Kaspi, V. M., et al. 2021a, ApJ, 910, L18 [NASA ADS] [CrossRef] [Google Scholar]
- Bhardwaj, M., Kirichenko, A. Y., Michilli, D., et al. 2021b, ApJ, 919, L24 [NASA ADS] [CrossRef] [Google Scholar]
- Blanchard, P. K., Berger, E., & Fong, W.-F. 2016, ApJ, 817, 144 [Google Scholar]
- Bochenek, C. D., Ravi, V., Belov, K. V., et al. 2020, Nature, 587, 59 [NASA ADS] [CrossRef] [Google Scholar]
- Burgay, M., Pilia, M., Bernardi, G., et al. 2020, ATel, 13783, 1 [NASA ADS] [Google Scholar]
- Chatterjee, S., Law, C. J., Wharton, R. S., et al. 2017, Nature, 541, 58 [NASA ADS] [CrossRef] [Google Scholar]
- CHIME/FRB Collaboration (Andersen, B. C., et al.) 2019, ApJ, 885, L24 [Google Scholar]
- CHIME/FRB Collaboration (Andersen, B. C., et al.) 2020, Nature, 587, 54 [Google Scholar]
- CHIME/FRB Collaboration (Amiri, M., et al.) 2021, ApJS, 257, 59 [NASA ADS] [CrossRef] [Google Scholar]
- CHIME/FRB Collaboration (Andersen, B. C., et al.) 2023, ApJ, 947, 83 [NASA ADS] [CrossRef] [Google Scholar]
- Cordes, J. M., & Chatterjee, S. 2019, ARA&A, 57, 417 [NASA ADS] [CrossRef] [Google Scholar]
- Cordes, J. M., & Lazio, T. J. W. 2002, arXiv e-prints [arXiv:astro-ph/0207156] [Google Scholar]
- Cordes, J. M., & Lazio, T. J. W. 2003, arXiv e-prints [arXiv:astro-ph/0301598] [Google Scholar]
- Cordes, J. M., & McLaughlin, M. A. 2003, ApJ, 596, 1142 [NASA ADS] [CrossRef] [Google Scholar]
- Cruces, M., Spitler, L. G., Scholz, P., et al. 2021, MNRAS, 500, 448 [Google Scholar]
- Cummings, J. R. 2014, GRB Coordinates Network, 16530, 1 [NASA ADS] [Google Scholar]
- Dalcanton, J. J., Williams, B. F., Seth, A. C., et al. 2009, ApJS, 183, 67 [Google Scholar]
- Deng, C.-M., Zhong, S.-Q., & Dai, Z.-G. 2021, ApJ, 922, 98 [NASA ADS] [CrossRef] [Google Scholar]
- Dong, F. A., & CHIME/FRB Collaboration 2022, ATel, 15681, 1 [NASA ADS] [Google Scholar]
- Driessen, L. N., Barr, E., Buckley, D., et al. 2023, MNRAS, submitted [arXiv:2302.09787] [Google Scholar]
- Duncan, R. C., & Thompson, C. 1992, ApJ, 392, L9 [Google Scholar]
- Fabbiano, G. 1989, ARA&A, 27, 87 [NASA ADS] [CrossRef] [Google Scholar]
- Fabbiano, G., & Trinchieri, G. 1987, ApJ, 315, 46 [NASA ADS] [CrossRef] [Google Scholar]
- Förster Schreiber, N. M., Genzel, R., Lutz, D., & Sternberg, A. 2003, ApJ, 599, 193 [CrossRef] [Google Scholar]
- Gajjar, V., Siemion, A. P. V., Price, D. C., et al. 2018, ApJ, 863, 2 [NASA ADS] [CrossRef] [Google Scholar]
- Gao, Y., & Solomon, P. M. 2004, ApJ, 606, 271 [NASA ADS] [CrossRef] [Google Scholar]
- Gehrels, N. 1986, ApJ, 303, 336 [Google Scholar]
- Giacomazzo, B., & Perna, R. 2013, ApJ, 771, L26 [NASA ADS] [CrossRef] [Google Scholar]
- Good, D., & CHIME/FRB Collaboration 2020, ATel, 14074, 1 [NASA ADS] [Google Scholar]
- Guo, H.-Y., & Wei, H. 2022, JCAP, 2022, 010 [CrossRef] [Google Scholar]
- Hashimoto, T., Goto, T., On, A. Y. L., et al. 2020, MNRAS, 498, 3927 [NASA ADS] [CrossRef] [Google Scholar]
- Hassall, T. E., Stappers, B. W., Hessels, J. W. T., et al. 2012, A&A, 543, A66 [NASA ADS] [CrossRef] [EDP Sciences] [Google Scholar]
- Heintz, K. E., Prochaska, J. X., Simha, S., et al. 2020, ApJ, 903, 152 [NASA ADS] [CrossRef] [Google Scholar]
- Hoyt, T. J., Freedman, W. L., Madore, B. F., et al. 2019, ApJ, 882, 150 [NASA ADS] [CrossRef] [Google Scholar]
- Huang, Y. X., Xu, H., Xu, Y. H., et al. 2022, ATel, 15707, 1 [NASA ADS] [Google Scholar]
- Israel, G. L., Esposito, P., Rea, N., et al. 2016, MNRAS, 457, 3448 [NASA ADS] [CrossRef] [Google Scholar]
- James, C. W., Ghosh, E. M., Prochaska, J. X., et al. 2022, MNRAS, 516, 4862 [NASA ADS] [CrossRef] [Google Scholar]
- Kaaret, P., Feng, H., & Roberts, T. P. 2017, ARA&A, 55, 303 [Google Scholar]
- Karachentsev, I. D., Karachentseva, V. E., Huchtmeier, W. K., & Makarov, D. I. 2004, AJ, 127, 2031 [Google Scholar]
- Kaspi, V. M., & Beloborodov, A. M. 2017, ARA&A, 55, 261 [Google Scholar]
- Katz, J. I. 2017, MNRAS, 471, L92 [NASA ADS] [CrossRef] [Google Scholar]
- Katz, J. I. 2020, MNRAS, 494, L64 [NASA ADS] [CrossRef] [Google Scholar]
- Kennicutt, R. C., Jr., Lee, J. C., Funes, J. G., et al. 2008, ApJS, 178, 247 [NASA ADS] [CrossRef] [Google Scholar]
- Kirsten, F., Snelders, M. P., Jenkins, M., et al. 2021, Nat. Astron., 5, 414 [Google Scholar]
- Kirsten, F., Marcote, B., Nimmo, K., et al. 2022, Nature, 602, 585 [NASA ADS] [CrossRef] [Google Scholar]
- Komatsu, E., Smith, K. M., Dunkley, J., et al. 2011, ApJS, 192, 18 [Google Scholar]
- Kovlakas, K., Zezas, A., Andrews, J. J., et al. 2020, MNRAS, 498, 4790 [Google Scholar]
- Kozlova, A. V., Israel, G. L., Svinkin, D. S., et al. 2016, MNRAS, 460, 2008 [NASA ADS] [CrossRef] [Google Scholar]
- Kremer, K., Piro, A. L., & Li, D. 2021, ApJ, 917, L11 [NASA ADS] [CrossRef] [Google Scholar]
- Kremer, K., Li, D., Lu, W., Piro, A. L., & Zhang, B. 2023, ApJ, 944, 6 [NASA ADS] [CrossRef] [Google Scholar]
- Kuzmin, A. D. 2007, Ap&SS, 308, 563 [NASA ADS] [CrossRef] [Google Scholar]
- Lemos, T., Gonçalves, R. S., Carvalho, J. C., & Alcaniz, J. S. 2023, Eur. Phys. J. C, 83, 138 [NASA ADS] [CrossRef] [Google Scholar]
- Li, Y., Zhang, B., Nagamine, K., & Shi, J. 2019, ApJ, 884, L26 [NASA ADS] [CrossRef] [Google Scholar]
- Li, C. K., Lin, L., Xiong, S. L., et al. 2021, Nat. Astron., 5, 378 [NASA ADS] [CrossRef] [Google Scholar]
- Licquia, T. C., & Newman, J. A. 2015, ApJ, 806, 96 [NASA ADS] [CrossRef] [Google Scholar]
- Lien, A. Y., Barthelmy, S. D., Baumgartner, W. H., et al. 2014, GRB Coordinates Network, 16522, 1 [NASA ADS] [Google Scholar]
- Liu, J.-F., Bregman, J. N., Bai, Y., Justham, S., & Crowther, P. 2013, Nature, 503, 500 [NASA ADS] [CrossRef] [Google Scholar]
- Locatelli, N. T., Bernardi, G., Bianchi, G., et al. 2020, MNRAS, 494, 1229 [NASA ADS] [CrossRef] [Google Scholar]
- Lorimer, D. R., Bailes, M., McLaughlin, M. A., Narkevic, D. J., & Crawford, F. 2007, Science, 318, 777 [Google Scholar]
- Lu, W., Beniamini, P., & Kumar, P. 2022, MNRAS, 510, 1867 [Google Scholar]
- Luo, R., Men, Y., Lee, K., et al. 2020, MNRAS, 494, 665 [NASA ADS] [CrossRef] [Google Scholar]
- Maan, Y., Leeuwen, J. V., Straal, S., & Pastor-Marazuela, I. 2022, ATel, 15697, 1 [NASA ADS] [Google Scholar]
- Macquart, J. P., Prochaska, J. X., McQuinn, M., et al. 2020, Nature, 581, 391 [Google Scholar]
- Majid, W. A., Pearlman, A. B., Prince, T. A., et al. 2021, ApJ, 919, L6 [NASA ADS] [CrossRef] [Google Scholar]
- Mannings, A. G., Fong, W.-F., Simha, S., et al. 2021, ApJ, 917, 75 [NASA ADS] [CrossRef] [Google Scholar]
- Marcote, B., Paragi, Z., Hessels, J. W. T., et al. 2017, ApJ, 834, L8 [CrossRef] [Google Scholar]
- Marcote, B., Nimmo, K., Hessels, J. W. T., et al. 2020, Nature, 577, 190 [NASA ADS] [CrossRef] [Google Scholar]
- Margalit, B., Berger, E., & Metzger, B. D. 2019, ApJ, 886, 110 [NASA ADS] [CrossRef] [Google Scholar]
- Margalit, B., Beniamini, P., Sridhar, N., & Metzger, B. D. 2020, ApJ, 899, L27 [NASA ADS] [CrossRef] [Google Scholar]
- McConnachie, A. W., Irwin, M. J., Ferguson, A. M. N., et al. 2005, MNRAS, 356, 979 [NASA ADS] [CrossRef] [Google Scholar]
- Mereghetti, S., Savchenko, V., Ferrigno, C., et al. 2020, ApJ, 898, L29 [Google Scholar]
- Newman, J. A., Ferrarese, L., Stetson, P. B., et al. 2001, ApJ, 553, 562 [NASA ADS] [CrossRef] [Google Scholar]
- Niino, Y. 2020, ApJ, submitted [arXiv:2005.12891] [Google Scholar]
- Nimmo, K., Hewitt, D. M., Hessels, J. W. T., et al. 2022, ApJ, 927, L3 [NASA ADS] [CrossRef] [Google Scholar]
- Niu, C. H., Aggarwal, K., Li, D., et al. 2022, Nature, 606, 873 [NASA ADS] [CrossRef] [Google Scholar]
- Olausen, S. A., & Kaspi, V. M. 2014, ApJS, 212, 6 [Google Scholar]
- Pastor-Marazuela, I., Connor, L., van Leeuwen, J., et al. 2021, Nature, 596, 505 [NASA ADS] [CrossRef] [Google Scholar]
- Pearlman, A. B., & CHIME/FRB Collaboration 2022, ATel, 15792, 1 [NASA ADS] [Google Scholar]
- Petroff, E., Hessels, J. W. T., & Lorimer, D. R. 2019, A&ARv, 27, 4 [NASA ADS] [CrossRef] [Google Scholar]
- Petroff, E., Hessels, J. W. T., & Lorimer, D. R. 2022, A&ARv, 30, 2 [NASA ADS] [CrossRef] [Google Scholar]
- Pilia, M. 2021, Universe, 8, 9 [NASA ADS] [CrossRef] [Google Scholar]
- Pilia, M., Burgay, M., Possenti, A., et al. 2020, ApJ, 896, L40 [NASA ADS] [CrossRef] [Google Scholar]
- Pintore, F., Marelli, M., Salvaterra, R., et al. 2020, ApJ, 890, 166 [NASA ADS] [CrossRef] [Google Scholar]
- Piro, L., Bruni, G., Troja, E., et al. 2021, A&A, 656, L15 [NASA ADS] [CrossRef] [EDP Sciences] [Google Scholar]
- Pleunis, Z., Good, D. C., Kaspi, V. M., et al. 2021, ApJ, 923, 1 [NASA ADS] [CrossRef] [Google Scholar]
- Prochaska, J. X., Macquart, J.-P., McQuinn, M., et al. 2019, Science, 366, 231 [NASA ADS] [CrossRef] [Google Scholar]
- Ptak, A., & Griffiths, R. 1999, ApJ, 517, L85 [NASA ADS] [CrossRef] [Google Scholar]
- Rahmani, S., Lianou, S., & Barmby, P. 2016, MNRAS, 456, 4128 [NASA ADS] [CrossRef] [Google Scholar]
- Rana, V., Harrison, F. A., Bachetti, M., et al. 2015, ApJ, 799, 121 [NASA ADS] [CrossRef] [Google Scholar]
- Ransom, S. M., Eikenberry, S. S., & Middleditch, J. 2002, AJ, 124, 1788 [Google Scholar]
- Ravi, V., Catha, M., D’Addario, L., et al. 2019, Nature, 572, 352 [NASA ADS] [CrossRef] [Google Scholar]
- Ravi, V., Law, C. J., Li, D., et al. 2022, MNRAS, 513, 982 [CrossRef] [Google Scholar]
- Ravi, V., Catha, M., Chen, G., et al. 2023, ApJ, 949, L3 [NASA ADS] [CrossRef] [Google Scholar]
- Rea, N., & Esposito, P. 2011, Astrophys. Space Sci. Proc., 21, 247 [NASA ADS] [CrossRef] [Google Scholar]
- Ridnaia, A., Golenetskii, S., Aptekar, R., et al. 2020, GRB Coordinates Network, 27554, 1 [NASA ADS] [Google Scholar]
- Roberts, T. P., & Colbert, E. J. M. 2003, MNRAS, 341, L49 [NASA ADS] [CrossRef] [Google Scholar]
- Ryder, S. D., Bannister, K. W., Bhandari, S., et al. 2022, arXiv e-prints [arXiv:2210.04680] [Google Scholar]
- Schwab, J., Quataert, E., & Kasen, D. 2016, MNRAS, 463, 3461 [NASA ADS] [CrossRef] [Google Scholar]
- Shappee, B. J., & Stanek, K. Z. 2011, ApJ, 733, 124 [NASA ADS] [CrossRef] [Google Scholar]
- Sharma, K., Somalwar, J., Law, C., et al. 2023, arXiv e-prints [arXiv:2302.14782] [Google Scholar]
- Sridhar, N., Metzger, B. D., Beniamini, P., et al. 2021, ApJ, 917, 13 [NASA ADS] [CrossRef] [Google Scholar]
- Stamatikos, M., Malesani, D., Page, K. L., & Sakamoto, T. 2014, GRB Coordinates Network, 16520, 1 [NASA ADS] [Google Scholar]
- Stetson, P. B., Saha, A., Ferrarese, L., et al. 1998, ApJ, 508, 491 [NASA ADS] [CrossRef] [Google Scholar]
- Tauris, T. M., Sanyal, D., Yoon, S. C., & Langer, N. 2013, A&A, 558, A39 [NASA ADS] [CrossRef] [EDP Sciences] [Google Scholar]
- Tavani, M., Verrecchia, F., Casentini, C., et al. 2020, ApJ, 893, L42 [NASA ADS] [CrossRef] [Google Scholar]
- Tavani, M., Casentini, C., Ursi, A., et al. 2021, Nat. Astron., 5, 401 [NASA ADS] [CrossRef] [Google Scholar]
- Tendulkar, S. P., Bassa, C. G., Cordes, J. M., et al. 2017, ApJ, 834, L7 [NASA ADS] [CrossRef] [Google Scholar]
- Tendulkar, S. P., Gil de Paz, A., Kirichenko, A. Y., et al. 2021, ApJ, 908, L12 [CrossRef] [Google Scholar]
- Thornton, D., Stappers, B., Bailes, M., et al. 2013, Science, 341, 53 [NASA ADS] [CrossRef] [Google Scholar]
- Trudu, M., Pilia, M., Bernardi, G., et al. 2022, MNRAS, 513, 1858 [NASA ADS] [CrossRef] [Google Scholar]
- Turolla, R., Zane, S., & Watts, A. L. 2015, Rep. Progr. Phys., 78, 116901 [Google Scholar]
- Wang, B., & Liu, D. 2020, RAA, 20, 135 [NASA ADS] [Google Scholar]
- Waxman, E. 2017, ApJ, 842, 34 [NASA ADS] [CrossRef] [Google Scholar]
- Xu, J., & Han, J. L. 2015, RAA, 15, 1629 [NASA ADS] [Google Scholar]
- Yamasaki, S., & Totani, T. 2020, ApJ, 888, 105 [NASA ADS] [CrossRef] [Google Scholar]
- Yao, J. M., Manchester, R. N., & Wang, N. 2017, ApJ, 835, 29 [NASA ADS] [CrossRef] [Google Scholar]
- Younes, G., Kouveliotou, C., Jaodand, A., et al. 2017, ApJ, 847, 85 [NASA ADS] [CrossRef] [Google Scholar]
- Zhang, C. F., Jiang, J. C., Men, Y. P., et al. 2020, ATel, 13699, 1 [NASA ADS] [Google Scholar]
- Zhong, S.-Q., & Dai, Z.-G. 2020, ApJ, 893, 9 [NASA ADS] [CrossRef] [Google Scholar]
- Zhong, S.-Q., Xie, W.-J., Deng, C.-M., et al. 2022, ApJ, 926, 206 [NASA ADS] [CrossRef] [Google Scholar]
All Tables
Upper limits for the FRB repetition rate (last column) coming from confirmed ULXs.
All Figures
|
Fig. 1. Normalized NC beam-forming response (solid line) as the source transits across the telescope field of view. Dashed lines represent the average value of the telescope beam response for each delay bin. |
| In the text | |
|
Fig. 2. Bursts from FRB 20180916B observed on April 30th 2022 (left panel) and August 9th 2022 (right panel), respectively. Bottom panels show the dynamic spectra, while the top panels show the frequency averaged profiles. The best-fit DMs (in pc cm−3) at which the bursts were de-dispersed are reported in the top right corner of each plot. Data were down-sampled to have 64 frequency channels, each 0.25 MHz wide, and time bins with 2.2 ms width for better display. |
| In the text | |
|
Fig. 3. De-dispersed profile of FRB 20220320. The top panel shows the frequency-averaged time series, and the bottom panel shows its dynamic spectrum, coherently de-dispersed at DM = 303 pc cm−3. |
| In the text | |
|
Fig. 4. Expected burst rate (colour-map) as a function of the energy distribution slope, γ, and the SGR1935-like burst rate per magnetar, λmag, from the whole observing campaign of NGs. The red line is the 95% CL upper limit obtained via our observations. |
| In the text | |
Current usage metrics show cumulative count of Article Views (full-text article views including HTML views, PDF and ePub downloads, according to the available data) and Abstracts Views on Vision4Press platform.
Data correspond to usage on the plateform after 2015. The current usage metrics is available 48-96 hours after online publication and is updated daily on week days.
Initial download of the metrics may take a while.