Open Access
Fig. 1.
Download original image
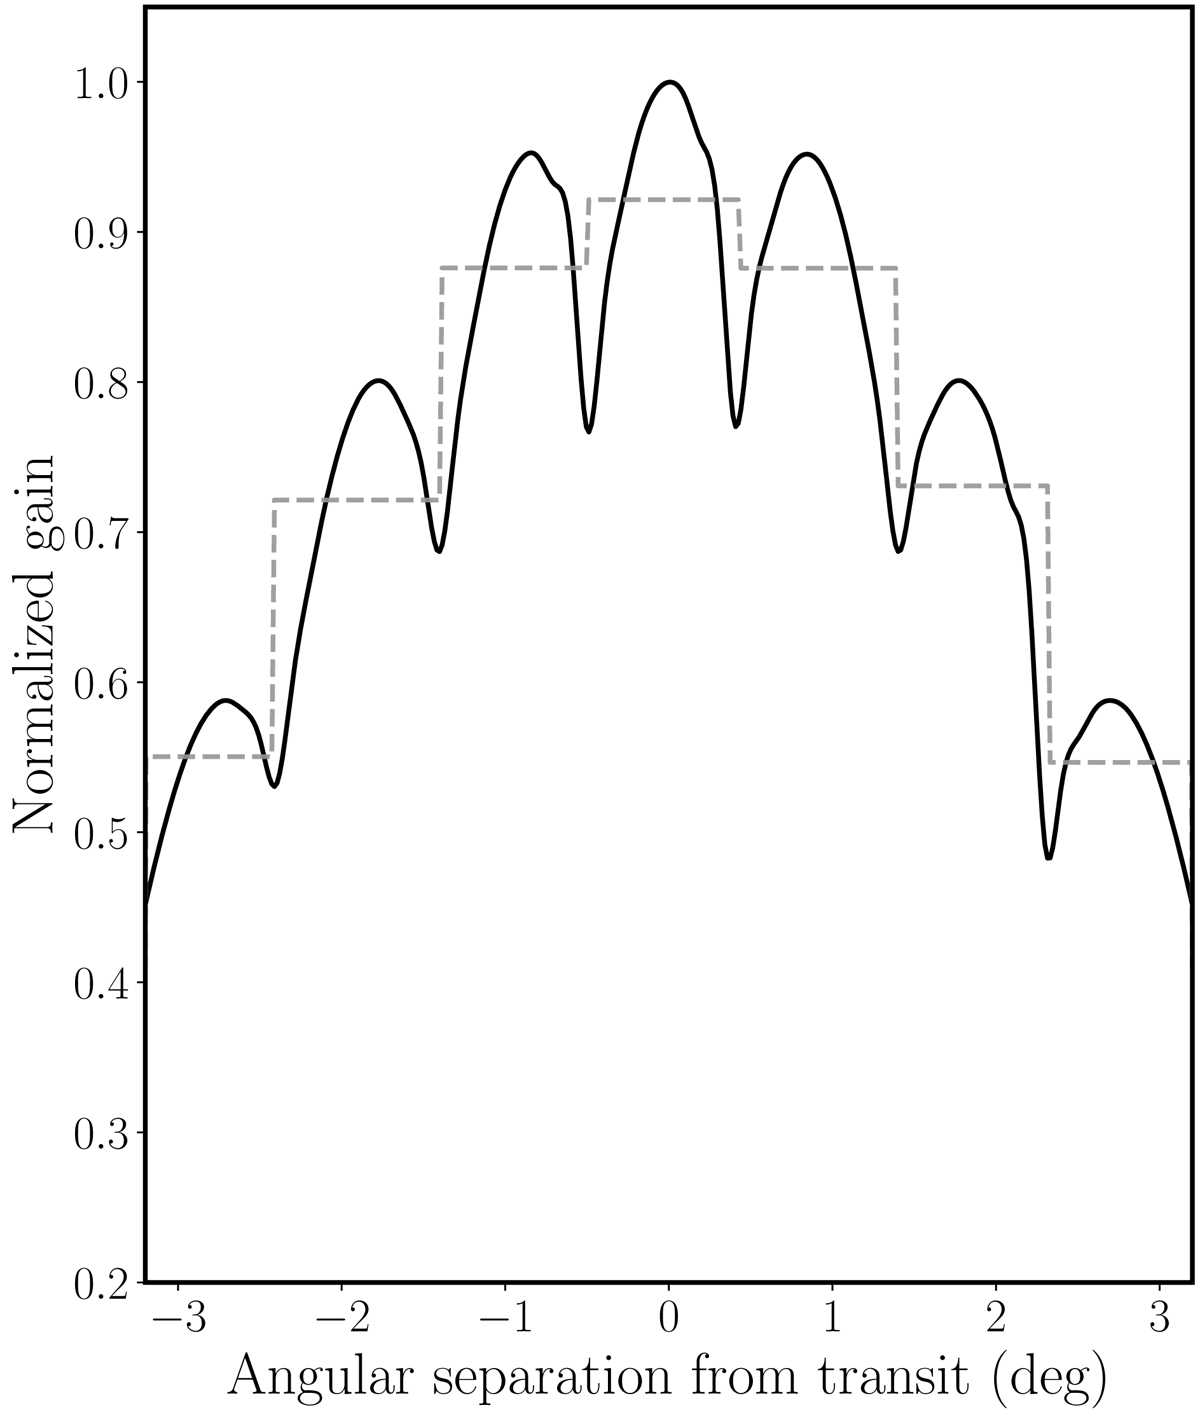
Normalized NC beam-forming response (solid line) as the source transits across the telescope field of view. Dashed lines represent the average value of the telescope beam response for each delay bin.
Current usage metrics show cumulative count of Article Views (full-text article views including HTML views, PDF and ePub downloads, according to the available data) and Abstracts Views on Vision4Press platform.
Data correspond to usage on the plateform after 2015. The current usage metrics is available 48-96 hours after online publication and is updated daily on week days.
Initial download of the metrics may take a while.