Open Access
Fig. 4.
Download original image
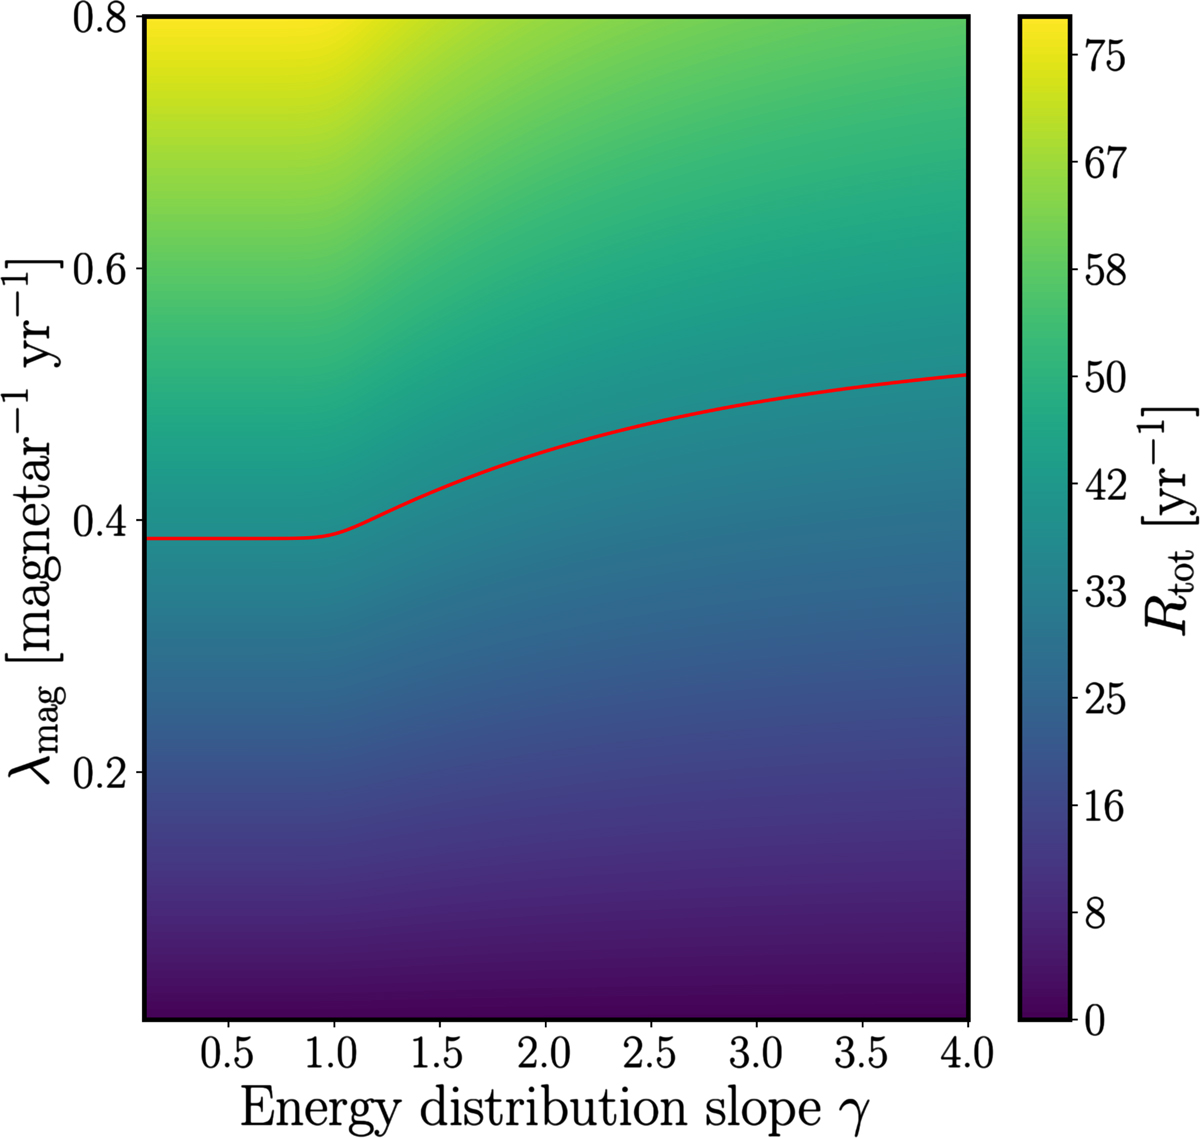
Expected burst rate (colour-map) as a function of the energy distribution slope, γ, and the SGR1935-like burst rate per magnetar, λmag, from the whole observing campaign of NGs. The red line is the 95% CL upper limit obtained via our observations.
Current usage metrics show cumulative count of Article Views (full-text article views including HTML views, PDF and ePub downloads, according to the available data) and Abstracts Views on Vision4Press platform.
Data correspond to usage on the plateform after 2015. The current usage metrics is available 48-96 hours after online publication and is updated daily on week days.
Initial download of the metrics may take a while.