Fig. 2.
Download original image
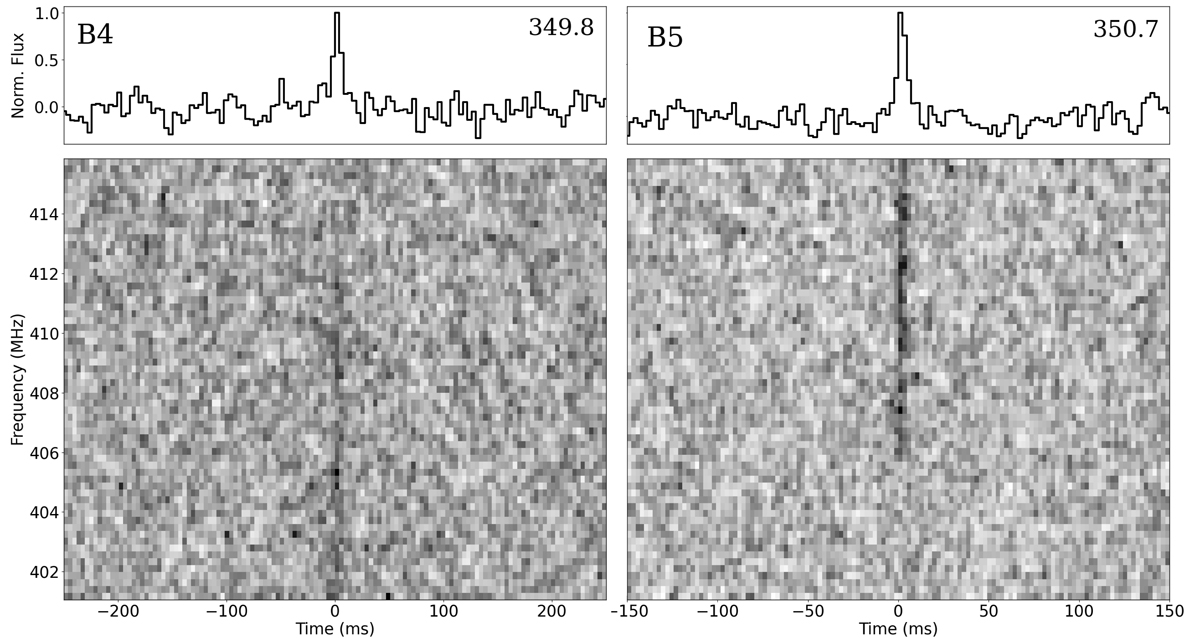
Bursts from FRB 20180916B observed on April 30th 2022 (left panel) and August 9th 2022 (right panel), respectively. Bottom panels show the dynamic spectra, while the top panels show the frequency averaged profiles. The best-fit DMs (in pc cm−3) at which the bursts were de-dispersed are reported in the top right corner of each plot. Data were down-sampled to have 64 frequency channels, each 0.25 MHz wide, and time bins with 2.2 ms width for better display.
Current usage metrics show cumulative count of Article Views (full-text article views including HTML views, PDF and ePub downloads, according to the available data) and Abstracts Views on Vision4Press platform.
Data correspond to usage on the plateform after 2015. The current usage metrics is available 48-96 hours after online publication and is updated daily on week days.
Initial download of the metrics may take a while.