| Issue |
A&A
Volume 690, October 2024
|
|
|---|---|---|
| Article Number | A219 | |
| Number of page(s) | 11 | |
| Section | Extragalactic astronomy | |
| DOI | https://doi.org/10.1051/0004-6361/202450271 | |
| Published online | 10 October 2024 | |
The Northern Cross Fast Radio Burst project
IV. Multi-wavelength study of the actively repeating FRB 20220912A
1
INAF-Istituto di Radio Astronomia (IRA), Via Piero Gobetti 101, Bologna, Italy
2
Dipartimento di Fisica e Astronomia, Università di Bologna, Via Gobetti 93/2, 40129 Bologna, Italy
3
South African Radio Astronomy Observatory, Black River Park, 2 Fir Street, Observatory, Cape Town 7925, South Africa
4
Department of Physics and Electronics, Rhodes University, PO Box 94 Makhanda 6140, South Africa
5
INAF-Osservatorio Astronomico di Cagliari, Via della Scienza 5, I-09047 Selargius, (CA), Italy
6
Department of Space, Earth and Environment, Chalmers University of Technology, Onsala Space Observatory, 439 92 Onsala, Sweden
7
ASTRON, Netherlands Institute for Radio Astronomy, Oude Hoogeveensedijk 4, 7991 PD Dwingeloo, The Netherlands
8
Scuola Universitaria Superiore IUSS Pavia, Piazza della Vittoria 15, 27100 Pavia, Italy
9
Department of Physics, University of Trento, Via Sommarive 14, 38123, Povo, (TN), Italy
10
Institute of Space Sciences and Astronomy (ISSA), University of Malta, Msida, MSD 2080, Malta
11
INAF/IAPS, Via del Fosso del Cavaliere 100, I-00133 Roma (RM), Italy
12
Università degli Studi di Roma “Tor Vergata”, Via della Ricerca Scientifica 1, I-00133 Roma (RM), Italy
13
SSDC/ASI, Via del Politecnico snc, I-00133 Roma (RM), Italy
14
INAF-Osservatorio Astronomico di Roma, Via Frascati 33, 00078 Monte Porzio Catone, (RM), Italy
Received:
5
April
2024
Accepted:
3
July
2024
Context. Fast radio bursts (FRBs) are energetic, millisecond-duration radio pulses observed at extragalactic distances and whose origins are still a subject of heated debate. A fraction of the FRB population have shown repeating bursts, however it’s still unclear whether these represent a distinct class of sources.
Aims. We investigated the bursting behaviour of FRB 20220912A, one of the most active repeating FRBs known thus far. In particular, we focused on its burst energy distribution, linked to the source energetics, and its emission spectrum, with the latter directly related to the underlying emission mechanism.
Methods. We monitored FRB 20220912A at 408 MHz with the Northern Cross radio telescope and at 1.4 GHz using the 32-m Medicina Grueff radio telescope. Additionally, we conducted 1.2 GHz observations taken with the upgraded Giant Meter Wave Radio Telescope (uGMRT) searching for a persistent radio source coincident with FRB 20220912A, and included high energy observations in the 0.3–10 keV, 0.4–100 MeV and 0.03–30 GeV energy range.
Results. We report 16 new bursts from FRB 20220912A at 408 MHz during the period between October 16th 2022 and December 31st 2023. Their cumulative spectral energy distribution follows a power law with slope αE = −1.3 ± 0.2 and we measured a repetition rate of 0.19 ± 0.03 hr−1 for bursts having a fluence of ℱ ≥ 17 Jy ms. Furthermore, we report no detections at 1.4 GHz for ℱ ≥ 20 Jy ms. These non-detections imply an upper limit of β < −2.3, with β being the 408 MHz – 1.4 GHz spectral index of FRB 20220912A. This is inconsistent with positive β values found for the only two known cases in which an FRB has been detected in separate spectral bands. We find that FRB 20220912A shows a decline of four orders of magnitude in its bursting activity at 1.4 GHz over a timescale of one year, while remaining active at 408 MHz. The cumulative spectral energy distribution (SED) shows a flattening for spectral energy Eν ≥ 1031 erg Hz−1, a feature seen thus far in only two hyperactive repeaters. In particular, we highlight a strong similarity between FRB 20220912A and FRB 20201124A, with respect to both the energy and repetition rate ranges. We also find a radio continuum source with 240 ± 36 μJy flux density at 1.2 GHz, centered on the FRB 20220912A coordinates. Finally, we place an upper limit on the γ to radio burst efficiency η to be η < 1.5 × 10⁹ at 99.7% confidence level, in the 0.4–30 MeV energy range.
Conclusions. The strong similarity between the cumulative energy distributions of FRB 20220912A and FRB 20201124A indicate that bursts from these sources are generated via similar emission mechanisms. Our upper limit on β suggests that the spectrum of FRB 20220912A is intrinsically narrow-band. The radio continuum source detected at 1.2 GHz is likely due to a star formation environment surrounding the FRB, given the absence of a source compact on millisecond scales brighter than 48 μJy beam−1. Finally, the upper limit on the ratio between the γ and radio burst fluence disfavours a giant flare origin for the radio bursts unlike observed for the Galactic magnetar SGR 1806-20.
Key words: methods: data analysis / methods: observational / stars: magnetars / radio continuum: galaxies
© The Authors 2024
 Open Access article, published by EDP Sciences, under the terms of the Creative Commons Attribution License (https://creativecommons.org/licenses/by/4.0), which permits unrestricted use, distribution, and reproduction in any medium, provided the original work is properly cited.
This article is published in open access under the Subscribe to Open model. Subscribe to A&A to support open access publication.
1. Introduction
Significant observational and theoretical efforts have been made to understand the origin of millisecond-long radio flashes of extragalactic nature, known as fast radio bursts (FRBs; see Bailes 2022; Petroff et al. 2022; Zhang 2023, for recent reviews). A number of models invoke magnetars (e.g. Duncan & Thompson 1992; Thompson & Duncan 1995, namely neutron stars (NSs) powered by the decay of strong (1014 − 1016 G) magnetic fields, as FRB progenitors (Popov & Postnov 2013; Beloborodov 2020; Lyubarsky 2020; Lu et al. 2020; Bochenek et al. 2021; Sobacchi et al. 2022). This hypothesis is supported by the simultaneous detection of an FRB-like burst, FRB 20200428 (CHIME/FRB Collaboration 2020; Bochenek et al. 2020), with an X-ray outburst from the Galactic magnetar SGR J1935+2154 (Mereghetti et al. 2020; Ridnaia et al. 2020; Li et al. 2021; Tavani et al. 2021).
Nowadays there are about ∼800 distinct known FRB sources (CHIME/FRB Collaboration 2021; Xu et al. 2023) and most of them classified as one-off events. However, about 50 sources (so-called repeaters) have shown repeated emission (CHIME/FRB Collaboration 2023), ruling out catastrophic events as their origin. It is unclear whether all FRB sources are repeating in nature, although bursts from repeaters are statistically wider in temporal width and narrower in bandwidth compared to one-off FRBs (Pleunis et al. 2021). An interesting feature that has emerged from very long monitoring of the two hyperactive repeaters FRB 20121102A (R1) and FRB 20201124A is the flattening of their burst energy distributions at the highest burst energies (Hewitt et al. 2022; Jahns et al. 2023; Kirsten et al. 2024). This suggests a possible link between repeating and non repeating FRB sources (James et al. 2022a; Kirsten et al. 2024), the latter presenting a flat luminosity distribution (James et al. 2022b,a), which could potentially imply that the most energetic bursts are produced by a different emission mechanism compared to the less energetic ones.
Among repeaters, various differences are found, especially in their observed level of activity. Indeed, the burst rate of repeaters spans a wide range of values, ranging from less active sources, which can exhibit a burst rate as low as ∼10−3 hr−1 (CHIME/FRB Collaboration 2023) to the most active ones showing sporadic burst storms in which the repetition rate rises up to several hundreds of bursts per hour (Li et al. 2021; Nimmo et al. 2023; Xu et al. 2022; Zhang et al. 2022, 2023; Feng et al. 2023). On the other hand FRB 20180916B, which shows a 16.3 ± 2.6 days periodic window of activity (Pleunis et al. 2021; Pastor-Marazuela et al. 2021), has not revealed any burst storms, given that its repetition rate is consistent with an origin coming from a Poissonian process (Sand et al. 2023).
Repeating FRBs have been observed with extremely narrow spectra (Kumar et al. 2021; Pastor-Marazuela et al. 2021; Pleunis et al. 2021; Zhou et al. 2022; Zhang et al. 2023; Sheikh et al. 2024), thus hindering a multi-band detection, as well as a broad-band, simultaneous spectral index measurement, that is crucial for investigating the underlying FRB emission mechanism and to exclude progenitor models (e.g. Burke-Spolaor et al. 2016). However, some exceptions have been reported. Remarkably, a single burst from R1 has been simultaneously detected at 1.4 GHz and 3 GHz using the Arecibo radiotelescope and the Karl G. Jansky Very Large Array (VLA), respectively (Law et al. 2017). Assuming a power law spectrum F(ν)∝νβ, the authors obtained a spectral index of β = 2.1. However, the latter result is inconsistent with the non-detection at 4.8 GHz conducted simultaneously with the Effelsberg radio telescope (Law et al. 2017). Therefore, the authors concluded that a single power-law function was not a good description for the broad-band spectrum of the source. Furthermore, Chawla et al. (2020) reported a coincident detection of FRB 20180916B in adjacent frequency bands of the Robert C. Byrd Green Bank Telescope (GBT) (300 − 400 MHz) and the Canadian Hydrogen Intensity Mapping Experiment (CHIME; 400 − 800 MHz, CHIME Collaboration 2022). In this case, the burst in the CHIME band is downwardly drifting into the GBT band. This effect, known as ‘sad trombone’, is commonly observed in the morphology of repeater bursts (e.g. Hessels et al. 2019). In the same work, no bursts have been detected in the Low Frequency Array (LOFAR) 110 − 190 MHz band, implying a lower limit on the broad-band spectral index of β > −1.0. Finally, the simultaneous detection of FRB 20200428 at 600 MHz (CHIME/FRB Collaboration 2020) and 1.4 GHz (Bochenek et al. 2020) gives a rough power law broad-band spectrum of β ∼ 1. However, in this case the flux density measured by CHIME is poorly constrained, given that this has been a sidelobe detection.
The chance to observe FRBs more than once allowed in-depth studies of these elusive sources, and helped in their accurate association with host galaxies (e.g. Gordon et al. 2023). The milliarcsecond localisation precision achieved for a number of actively repeating FRBs (e.g. Marcote et al. 2022) enabled the intriguing discovery of persistent radio sources (PRSs). A PRS is spatially coincident with the FRB site and it is characterised by high luminosity (Lν > 1027 erg s−1 Hz−1, Law et al. 2017) and compactness (< 10 pc, Marcote et al. 2017); however, the latter is inconsistent with typical values inferred from star-formation processes. To date, only two confirmed PRSs are known, both being associated with two actively repeating FRBs: R1 (Chatterjee et al. 2017) and FRB 20190520B (R1-twin; Niu et al. 2022). These FRB sources are very similar in terms of burst activity, host galaxy properties (Niu et al. 2022) and very high rotation measures (RMs) (Michilli et al. 2018; Anna-Thomas et al. 2023). In terms of spectral energy distribution (SED), the known PRSs exhibit flat radio spectra, with a spectral index β ∼ −0.27 for R1 (Marcote et al. 2017) and β ∼ −0.4 for R1-twin (Niu et al. 2022; Bhandari et al. 2023). In particular, the SED of the PRS associated with R1 resembles the Crab (PSR B0531+21) pulsar wind nebula, but with a magnetic field three orders of magnitude stronger to match the implied energetics of the PRS (Resmi et al. 2021). For these reasons the concordance picture for the radio emission of PRSs is a strongly ionised wind nebula powered by a young actively flaring magnetar (Margalit & Metzger 2018). Interestingly, results from very long baseline interferometry (VLBI) observations of R1-twin are also consistent with a hypernebula powered by the accretion of a central compact binary system (Sridhar et al. 2024; Bhandari et al. 2023). A third putative PRS is the one associated with FRB 20201124A, another very active FRB source (e.g. Zhou et al. 2022). Observations conducted with the VLA revealed the presence of a persistent, extended radio source coincident with the FRB position (Piro et al. 2021). However, at the milliarcsecond scale the same radiation is completely resolved out (Nimmo et al. 2023), indicating that the continuum radiation is related to extended star formation occurring in the near environment of the FRB (Piro et al. 2021).
In September 2022, CHIME discovered FRB 20220912A, a repeating FRB source having dispersion measure (DM) of 219.46 pc cm−3 (Mckinven 2022), subsequently localised with arcsecond precision in the outskirts of a moderately star forming, massive galaxy at redshift z = 0.0771 (Ravi et al. 2023). Bursts were detected at different frequencies, between 408 MHz and 2.3 GHz (see Zhang et al. 2023, and references therein), with a period of particularly high activity. A burst rate of ∼400 hr−1 was observed at 1.4 GHz, for a 90% fluence threshold of 4 mJy ms (Zhang et al. 2023). A fraction of the observed bursts show very narrow-band spectra (Zhang et al. 2023) and short durations (∼16 μs), the latter usually clustered in dense burst forests (Hewitt et al. 2023). The source was recently localised at RA (J2000) = 23h09m04.8988s ± 0.0003s, Dec (J2000) = 48° 42′23.908″ ± 0.005″(Hewitt et al. 2024), placing it closer to the centre of the host galaxy than previously suggested. Their observations also rule out the presence of a PRS down to a ∼20 μJy beam−1 level. It was argued by Ravi et al. (2023) that the DM contribution by the host is low (≤53 pc cm−3). A low DM host contribution, along with an approximately zero rotation measure (RM; Mckinven 2022; Zhang et al. 2023; Feng et al. 2023; Hewitt et al. 2023), corroborates the hypothesis of a clean local environment (Hewitt et al. 2023).
In this work, we report the first multi-wavelength monitoring campaign of FRB 20220912A, carried out at 408 MHz with the Northern Cross (NC) radio telescope, at 1.4 GHz with The Medicina Grueff 32-m single dish and at X and γ rays with The Neil Gehrels Swift Observatory (Swift) (Gehrels et al. 2004) and AGILE (Tavani et al. 2009) satellites. Furthermore, we use new deep continuum radio observations taken with the upgraded Giant Meter Wave Radio Telescope (uGMRT) at band 5 (1.0–1.4 GHz) to investigate the presence of a PRS in the direction of FRB 20220912A.
The paper is structured as follows. In Section 2 we describe the multi-wavelength campaign conducted on FRB 20220912A. In Section 3, we describe and discuss the results of the observations. Finally, we present our conclusions in Section 4.
2. Observations
2.1. Northern Cross radio telescope
The NC radio telescope is a T-shaped transit radio telescope deployed near Medicina (Italy). The telescope operates at 408 MHz (P band) with a 16 MHz bandwidth, and it is undergoing an upgrade of the receiving system (Locatelli et al. 2020) to enable various studies, including FRB observations. The current telescope configuration has two differences with respect to observations presented in Trudu et al. (2022) and Pelliciari et al. (2023). First, it doubles the collecting area, combining sixteen cylinders of the North-South arm into a single beam, whose half-power beam width is now 1.6° ×0.25°. Second, the delay correction needed to form the beam is performed at higher cadence, namely every 5 s, effectively tracking the source across the field of view. Observations are stored to disk as 16-bit SIGPROC (Lorimer 2011) filterbank files, with a time resolution of 138.24 μs and a 14.468 kHz frequency channel width (see Locatelli et al. 2020, for a detailed description of the system).
We started monitoring FRB 20220912A with eight cylinders on 16 October 16 2022, forming a single beam at the source coordinates, RA (J2000) = 23h 09m 04.9s, Dec (J2000) = +48° 42′ 25.4″ (Ravi et al. 2023). After the first 14 hours on-source, the observations were interrupted and resumed on 17 May 2023, when 16 cylinders were employed. Observations ended on 31 December 2023, for a total of 122 hr on-source. Each session of observation lasted for ∼35 min. As in Trudu et al. (2022) and Pelliciari et al. (2023), we performed a weekly calibration through interferometric observations of Cas A. A summary of the conducted observations is shown in Fig. 1.
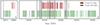 |
Fig. 1. Overview of the FRB 20220912A monitoring campaign. Panel a displays the MJD range 59868–59903 (35 days), while panel b shows the MJD range 60081 – 60309 (228 days). Green (red) vertical blocks indicate observations at 408 MHz (1.4 GHz). Vertical black lines represent burst detections at 408 MHz. Each observing session at 408 MHz last ∼35 minutes, while 1.4 GHz observations started 15 minutes before the P band run and last ∼60 minutes. |
2.2. Medicina Grueff radio telescope
Simultaneous observations were carried out at 1.4 GHz (L band) with the Medicina Grueff 32 m dish (hereafter Medicina). The total duration of the campaign was 177 hours, made of ∼1 hr daily runs. We recorded the 2-bit baseband data in both circular polarisations written to disk in VDIF format (Whitney et al. 2010), using the local digital baseband converter (DBBC) system (Tuccari 2003). Observations are centred at 1414 MHz, sampling a 128 MHz bandwidth divided into four separated sub-bands. Data were converted to filterbank format using a custom-built pipeline (Kirsten et al. 2020) and stored to disk with a 250 kHz frequency and 64 μs time resolution respectively. Two circular polarisations were averaged together to obtain total intensity data. The telescope has a system equivalent flux density (SEFD) of 458 Jy at 1.4 GHz, which leads (using the radiometer equation) to a result of σL ≃ 1.2 Jy ms root mean square (rms) noise for a burst of 1 ms of duration. To test the data acquisition and conversion we observed PSR B0329+54 and we successfully detected single pulses on this basis.
2.3. uGMRT
To search for a PRS coincident to the position of FRB 20220912A, continuum radio observations of FRB 20220912A were performed with the uGMRT in the 1050 − 1450 MHz (band-5) frequency range on 2023 November 1st. The total bandwidth was splitted into 16384 channels of 24.414 kHz each. The field of FRB 20220912A was observed for a total of ∼3 hours. The sources 3C48 and J2322+509, a nearby source to the target, were used as absolute flux scale and phase calibrators, respectively.
The high spectral resolution of our data enabled us to split the total bandwidth in eight sub-bands of 50 MHz each for easier data reduction. We processed each sub-band independently by carrying out a standard interferometric data reduction1 using the Common Astronomy Software Applications (CASA; McMullin et al. 2007) package. We iteratively performed flagging of RFI, bandpass, amplitude and phase calibrations for each sub-band. Finally, the calibrated visibilities of all the sub-bands were recombined for imaging. We assumed 3C48 to be 17.7 Jy at 1.2 GHz, with a spectral index β = −0.76 (Perley & Butler 2013). These measurements were used for the 3C48 flux and bandpass calibrations, which were then transferred to J2322+509. Finally, we determined gain and phase calibration for J2322+509 and then transferred them to the target field. Owing to severe RFI, two out of eight sub-bands were flagged, thus leaving 300 MHz of remaining bandwidth. Imaging was carried out with the TCLEAN task in CASA, by weighting the visibilities according to the briggs scheme with a ROBUST parameter −1. We achieved a final noise level of 36 μJy beam−1 at an angular resolution of 1.97″ × 1.77″.
2.4. Swift and AGILE monitoring
Since its discovery (Mckinven 2022), FRB 20220912A has been added to the AGILE list of sources monitored during the Spinning-mode observations. We verified the source exposure with the MiniCalorimeter (MCAL;  ) detector and the AGILE gamma-ray imaging detector (GRID; 30 MeV ≤ E ≤ 30 GeV). We took the de-dispersed topocentric arrival times at infinite frequencies as the arrival time for each burst. AGILE acquired MCAL data covering 3 of the 16 bursts presented here, due to the South Atlantic Anomaly (SAA) passages or Earth occultation. We selected good events with standard selection criteria, such as the SAA passages time intervals exclusion, along with the inclusion of events with off-axis angles smaller than 60 degrees or at angles from Earth direction greater than 80 degrees.
A monitoring campaign with Swift was also started in autumn 2022, similar to the one dedicated to FRB 20180916B (partially reported in Tavani et al. 2020; Trudu et al. 2023). Swift observed FRB 20220912A with the X-ray Telescope (XRT, Burrows et al. 2005), as one of the three instruments on board. The Swift/XRT X-ray (0.3–10 keV) data were obtained daily after time of opportunity requests during source activity phases (on November 2022, and July-October, 2023, partially covering the radio monitoring presented in this work). The XRT observations were carried out in windowed timing (WT) readout mode, with 2–10 daily pointings. The time resolution of WT data is 1.8 ms and each pointing has a typical exposure of ∼1.8 ks. We considered the combination of all the data and processed them using the XRTDAS software package (v.3.7.0)2 within the HEASoft package (v.6.32.1). We cleaned and calibrated the data with standard filtering criteria using the xrtpipeline task and the calibration files available from the Swift/XRT CALDB (version 20230705). The imaging analysis was executed selecting events in the energy channels between 0.3 and 10 keV and within a 20 pixel (∼47″) radius, including the 90% of the point-spread function. The background was estimated from a nearby source-free circular region with the same radius value.
3. Results and discussion
The search for FRB candidates in NC data follows the strategy employed in Trudu et al. (2022) and Pelliciari et al. (2023), using the SPANDAK pipeline (Gajjar et al. 2018), which flags RFIs through RFIFIND (Ransom et al. 2002) and searches for single pulses with HEIMDALL (Barsdell et al. 2012). We considered a signal-to-noise ratio (S/N) greater than 8 and a boxcar width shorter than 35 ms. We carried out our search using DM between 200 pc cm−3 and 240 pc cm−3, given the nominal 220 pc cm−3 DM of the source. In the case of observations at 1.4 GHz, we set the threshold S/N > 10, to minimise the RFI contamination. To cross-check the results of the single-pulse search conducted at 1.4 GHz with the pipeline described above, we searched for FRBs in a large amount of data also with the processing pipeline described in Kirsten et al. (2021, 2024), which searches FRB with HEIMDALL and classifies bursts with the deep learning classifier FETCH (Agarwal et al. 2020). We estimated the completeness of our observations at both 408 MHz and 1.4 GHz via injections of simulated burst. We used FRB-FAKER3 (Houben et al. 2019) to inject 100 bursts of 1 ms duration with a DM of 220 pc cm−3 at random times. We varied the S/N of the injected burst between 5 and 20 and we ran the same pipeline used for the search in order to retrieve the injected bursts. We find a 95% completeness for a fluence of 17 and 20 Jy ms at 408 MHz and 1.4 GHz respectively.
We detected a total of 16 bursts at 408 MHz and labeled them as “Bn”, then ordered them according to their time of arrival (ToA). We show their dynamic, de-dispersed spectra in Fig. 2, while their measured properties are reported in Table 1. All radio bursts, except for the first one, B01, were detected during the second period of the campaign (i.e. later than May 17th, 2023) when 16 cylinders were used. We fit a Gaussian profile to the de-dispersed FRB spectrum, integrated over the burst profile, and found that the full width at half maximum (FWHM) of all bursts are compatible with the 16 MHz bandwidth, apart from B14, whose extensions is only ∼6 MHz. Furthermore, we found no evidence of scattering and sub-burst structures on time scales larger than 138.24 μs for any of the detected burst.
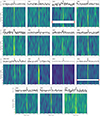 |
Fig. 2. Bursts from FRB 20220912A observed at 408 MHz. Both the de-dispersed, dynamic spectrum (bottom sub-panels) and the frequency-averaged profiles (top sub-panels) are shown. For a better visualisation, the data were down-sampled to have 16 frequency channels (each 1 MHz wide) and time bins 1.5 ms in width. Horizontal white rows (highlighted with red ticks) are flagged channels due to RFI. |
Burst properties at 408 MHz from FRB 20220912A.
Given the  of a burst, we computed its fluence as the product of its peak flux density Fpeak and its FWHM duration w, where the former is obtained as (Lorimer & Kramer 2004):
Here,  Jy (Trudu et al. 2022) holds for each receiver (i.e., each group of sixteen dipoles), Np = 1 is the number of polarisations, Nc = 1024 is the number of spectral channels and Δνch = 14.4 kHz the channel width. Furthermore, A is the number of receivers included in either the eight (A = 32) or sixteen (A = 64) cylinders, ξ is the fraction of channels excised by RFIs, and, finally, the attenuation of the primary beam at the burst ToA is given by
  (Trudu et al. 2022; Pelliciari et al. 2023).
Given the burst fluence, we computed the corresponding burst spectral energy Eν:
Here the burst isotropic energy is Ei (e.g. Macquart & Ekers 2018; Chawla et al. 2022) per unit bandwidth. Also, DL = 380.86 Mpc is the luminosity distance of the source, obtained considering z = 0.0771, the redshift of the source, and the Planck 2015 cosmology (Planck Collaboration XIII 2016).
We computed the cumulative spectral energy rate R(> Eν) at 408 MHz. We plot it in Fig. 3, together with spectral energies from literature observations4. It follows a power law in the 3 × 1030 < Eν < 3 × 1031 erg Hz−1 range:
where Eν, 0 = 3 × 1030 erg Hz−1. As a reference, the NC 95% completeness fluence limit corresponds to 3 × 1030 erg Hz−1. We found the best fit values to be R0 = 0.19 ± 0.03 hr−1 and αE = −1.3 ± 0.2, respectively. We do not report any detections at 1.4 GHz, from which we placed a 95% C.L. upper limit (UL) of 0.017 hr−1 on the burst rate at 1.4 GHz for ℱ ≥ 20 Jy ms (corresponding to Eν = 3.2 × 1030 erg Hz−1).
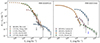 |
Fig. 3. Comparison between the cumulative spectral energy rate distribution for two hyperactive repeaters at different observing frequencies and times. Left: FRB 20220912A at 408 MHz (white stars; this work), 1.25 GHz (orange circles; Zhang et al. 2023), 1.4 GHz (green pentagons and red squares; Feng et al. 2023; Hewitt et al. 2024 and 1.572 GHz (blue diamonds; Sheikh et al. 2024). The 95% C.L. UL for R(Eν > 2.5 × 1030 erg Hz−1) from our 1.4 GHz observations is plotted as a black downward arrow. Right: FRB 20201124A at 600 MHz (pink stars; Lanman et al. 2022), 650 MHz (blue squares; Marthi et al. 2022), 1.25 GHz (orange circles; Zhang et al. 2022) and 1.4 GHz (green diamonds; Kirsten et al. 2024). The 95% C.L. UL for R(Eν > 2 × 1031 erg Hz−1) from P (334 MHz) resulting from non-detections in Kirsten et al. (2024), is plotted as a blue downward arrows. |
We repeated the analysis for FRB 20201124A5, another very actively repeating FRB source (Xu et al. 2022; Zhang et al. 2022). The resulting distributions are shown in Fig. 3, while the best fit parameters obtained for each observation are listed in Table 2.
Parameters obtained from the power-law fitting of the cumulative energy distributions for FRBs 20220912A and 20201124A.
The cumulative spectral energy rates are fairly similar between FRBs 20220912A and 20201124A, both in the range of the energetic and the repetition rate. This could be an indication that these two sources share the same emission mechanism (James et al. 2020), as also highlighted by other similarities such their reported double-peaked waiting time distribution and complex time-frequency structures of their bursts (see e.g. Zhang et al. 2022, 2023). Regarding FRB 20220912A, the repetition rate for bursts having Eν ≥ 2 × 1030 erg Hz−1 decreased from ∼10 hr−1 (Zhang et al. 2023; Feng et al. 2023) during a storm event, to ∼0.1 hr−1, approximately two months later (Sheikh et al. 2024), when the storm ended. Lastly, it dropped to less than 0.017 hr−1 nearly a year later, as we could see from our 1.4 GHz monitoring (see Fig. 3). However, the source remained active at 408 MHz, exhibiting comparable levels of repetition rate to those reported by Sheikh et al. (2024). FRB 20220912A is, as far as we know, the only FRB source that shows a decline of more than four orders of magnitude in its burst rate in the L band.
A similar behaviour, albeit inverted in frequency, can be seen for FRB 20201124A, where the burst rate dropped from ∼0.2 hr−1 as reported at 550–750 MHz observations (Marthi et al. 2022) to < 5 × 10⁻³ hr−1 at (2 × 1031 erg Hz−1, as resulting from non-detections at 334 MHz in ∼650 hr of observing time (Kirsten et al. 2024). To obtain the minimum spectral energy corresponding to the latter observational campaign, we used Eq. 2, considering the 91 Jy ms completeness fluence reported in Kirsten et al. (2024).
Interestingly, we note the same flattening of the cumulative spectral energy rate distribution for high energetic bursts as the one previously reported for R1 (Hewitt et al. 2022; Jahns et al. 2023) and, more recently, for FRB 20201124A (Kirsten et al. 2024). As can be noted also from the best fit values obtained for αE in Table 2, the case for FRB 20220912A is particularly similar to FRB 20201124A. We note that αE shifts from approximately −2 for Eν ≥ 1030 erg Hz−1 to roughly −1 at Eν ≃ 2 × 1031 erg Hz−1. Moreover, high energetic bursts present a slope αE = −1.03 ± 0.3, obtained by analysing L band data from Sheikh et al. (2024), which is fully consistent with the power law slope, αE, obtained by fitting the cumulative luminosity distribution of apparently non-repeating FRBs (James et al. 2022a,b; Shin et al. 2023). As a reference, James et al. (2022a) obtained  , but the other measurements are still consistent with this value. Regarding R1, the cumulative isotropic energy distribution flattens to αE = −0.88 ± 0.01 for Eiso ≥ 1.3 × 1038 erg (Jahns et al. 2023). This value for αE roughly agrees with other reported values as obtained by fitting the R1 cumulative energy distribution at high energies (Law et al. 2017; Gourdji et al. 2019; Cruces et al. 2021; Hewitt et al. 2022). Even if the cumulative slopes are similar to the case of FRBs 20220912A and 20201124A, we note that Eiso = 1.3 × 1038 erg corresponds to a spectral energy of6 ∼4 × 1029 erg Hz−1, which is approximately one order of magnitude lower than the break spectral energy we obtained for the other two repeaters.
3.1. Constraints on broad-band spectral index
No multi-band observations of FRB 20220912A have been reported yet. However, from a period of burst storm detected by the Five-hundred-meter Aperture Spherical Telescope (FAST), Zhang et al. (2023) obtained a synthetic L band (1 − 1.5 GHz) spectral index of −2.6 ± 0.21 (Zhang et al. 2023). This value was derived by fitting a spectrum obtained by averaging the fluence of all their reported bursts, characterised by having single narrow-band spectra with emission occurring only over 20% of the observing bandwidth (Zhang et al. 2023), in different frequency channels. Although this is a valid way to obtain an in-band spectral index, we suggest some caution when making a direct comparison between an UL on the broad-band spectral index and the in-band β value obtained in Zhang et al. (2023). Indeed, our observations probe the broad-band spectrum of the source, which can be obtained only when considering simultaneous bursts arriving at separate frequency bands.
During our observational campaign, a total of six bursts (B08-B13) have been detected in the P band during simultaneous L band observations of which we do not report any counterpart. Henceforth, we use these non-detections to provide ULs on the L band fluence of these bursts, which (in turn) imply ULs on the FRB 20220912A broad-band (408 MHz – 1.4 GHz) spectral index. For each detected burst with an L band simultaneous observation we computed the fluence UL using the radiometer Eq. (1), considering the same width of the corresponding burst in the P band. We considered a 2σ detection threshold in this case, since our goal has not been to search for bursts blindly with HEIMDALL, which has a minimum S/N search of ∼6. Instead, we manually inspected the Medicina data at burst topocentric arrival times, after correcting them for the DM of the bursts. The brightest burst we detected during our campaign is B11, with a measured fluence F = 145 ± 4.6 Jy ms at 408 MHz. We do not report any significant radio emission down to 2σ at 1.4 GHz and this translates into a fluence UL of 10.1 Jy ms in the L band for a burst having a 14.6 ms duration. This UL translates into β < −2.3. The same limit on β is obtained by the non-detection of an L band counterpart for B12, which has an high S/N as well but with a ×10 shorter duration than B11. We report all the ULs obtained from our observations in Table 3.
ULs on fluence and broad-band spectral index β for Medicina observations for which there is a simultaneous burst detection at 408 MHz from NC radio telescope.
Our non-detections in the L band undermine the hypothesis of a positive (or flat) broad-band spectral radio emission. We find our UL on β in disagreement with β = 2.1, as measured for a burst from R1 in the multi-frequency, Arecibo (1.4 GHz) – VLA (3 GHz) campaign; namely, this is the only simultaneous FRB detection present in the literature (Law et al. 2017). The other bursts reported in Law et al. (2017) have not been detected simultaneously by the two observatories, showing that the broad-band spectral behaviour of the source cannot simply be modelled by a power law function. Moreover, also a spectrum with β ∼ 1 as the one measured from FRB 20200428, the Galactic FRB, simultaneously detected by CHIME/FRB Collaboration (2020) (400 MHz – 800 MHz) and the Survey for Transient Astronomical Radio Emission 2 (STARE-2, 1.4 GHz Bochenek et al. 2020) can be ruled out based on our observations. Therefore, our upper limit could imply either that FRB 20220912A is characterised by a steep radio spectrum or it could be a consequence of its intrinsically narrow-band emission (Zhang et al. 2023; Feng et al. 2023; Sheikh et al. 2024).
Our UL is somewhat inconsistent with the very flat spectrum usually observed for radio-loud magnetars (Camilo et al. 2008; Lazaridis et al. 2008; Dai et al. 2019); however, large fluctuations in the spectral index are observed locally in magnetars, for instance, in the case of XTE J1810–197 (Lazaridis et al. 2008; Maan & Leeuwen 2022). An interesting exception is the radio-loud magnetar Swift J1818.0–1607, which has shown emission in a steep spectrum with β ≃ −2.26 (Lower et al. 2022). A broad-band emission with this spectral index seems to be disfavoured by our observations. Nevertheless, we must be careful in comparing the spectral index for radio-loud magnetars and FRBs, since (up to now) the former showed only pulsed emission (but see also Esposito et al. 2020). The only two exceptions to date are SGR J1935+2154 (CHIME/FRB Collaboration 2020; Bochenek et al. 2020; Zhang et al. 2020; Kirsten et al. 2021; Good & CHIME/FRB Collaboration 2020) and 1E 1547.0–5408 (Israel et al. 2021), which also showed FRB-like bursts, before entering a pulsar-like phase (Zhu et al. 2023). For the former, FRB-like bursts are emitted in random phases (unlike radio pulsations, which instead arrive in a phase windows anti-aligned with X-ray pulsations), hinting at different emission mechanisms between radio pulses and FRB-like bursts (Zhu et al. 2023). For 1E 1547.0–5408, rather, FRB-like bursts are not aligned in phase with radio pulsations, nor with X-ray bursts (Israel et al. 2021).
3.2. Continuum radio emission from FRB 20220912A host galaxy
In our uGMRT image at 1.26 GHz, we detect a continuum source spatially coincident with the coordinates of PSO J347.2702+48.7066, the host galaxy of FRB 20220912A. The source integrated and peak flux densities are consistent at 1σ level; thus, we considered it as unresolved in our observations. Its centroid has coordinates RA (J2000) = 23h09m04.88s ± 0.017 s, Dec (J2000) = + 48° 42′24.04″ ± 0.25″. Such position is well in agreement with R.A. (J2000) = 23h09m04.8988s ± 0.0003 s, Dec (J2000) = + 48° 42′23.9078″ ± 0.005″, namely the localisation of FRB 20220912A obtained from European VLBI Network (EVN) observations (Hewitt et al. 2024). The radio contours of the source we detect are shown in Fig. 4, as well as the VLBI localisation of the FRB. In the same figure, the optical image taken from the Panoramic Survey Telescope & Rapid Response System (Pan-STARRS) data archive 1 (PS1; Flewelling et al. 2020) is shown.
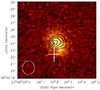 |
Fig. 4. Optical Pan-STARRS (i filter) image of PSO J347.2702+48.7066, the host galaxy of FRB 20220912A, with contour levels representing the continuum radio source we detected at 1.26 GHz, with a 1.97″ × 1.77″ synthesised beam. Contours are drawn from three to six times the rms noise level σ ≃ 36 μJy beam−1. The white cross represents the position of APTF J23 radio source, with the cross extensions being the 1σ uncertainties on its centroid (Hewitt et al. 2024), while the blue cross indicates the position of FRB 20220912A localised at milliarcsecond angular resolution (Hewitt et al. 2024). The synthesised beam of our uGMRT observations is represented in the bottom left corner of the image as a white ellipse. |
We measured a flux density of 240 ± 36 μJy at 1.26 GHz, which corresponds to a spectral luminosity of Lν ≃ 4 × 1028 erg s−1 Hz−1. We are aware that EVN observations ruled out the presence of a PRS surrounding FRB 20220912A at milliarcsecond scale for an rms of 16 μJy beam−1, placing an UL of 1.2 × 1028 erg s−1 Hz−1 on its spectral luminosity at 1.4 GHz (Hewitt et al. 2024). In the same work, a continuum radio source, APTF J230904+484222 (APTF J23), detected by the Westerbork Synthesis Radio Telescope Aperture Tile In Focus (WSRT-APERTIF) has been reported, with a position consistent with the coordinates of FRB 20220912A host galaxy. This source has a peak flux density of 270 ± 40 μJy beam−1, which falls within the measured flux range of our source, considering the associated uncertainties. Although APTF J23 is offset by ∼1.6″ with respect to the FRB VLBI position (see Fig. 4), the ∼2″ uncertainties associated to its centroid makes APTF J23 consistent at 2σ level with the position of our detected source. We thus conclude that the source we detect and APTF J23 are the same radio source, albeit observed in this work with an improved spatial resolution by a factor of four.
Finally, we note that the contour levels of the PRS we are aiming to detect are offset by approximately 0.6″ (about 0.9 kpc in physical size) from the geometric centre of the host galaxy. This offset lowers the plausibility that an active galactic nucleus (AGN) is the origin of this source and, instead, suggests that the radio emission is originating from a star formation region in the vicinity of FRB 20220912A.
3.3. Results from the high energy monitoring of FRB 20220912A
As a first step, we checked the burst exposures in the AGILE source monitoring, as well as the position of the source within the AGILE FoV at each burst time. The relative AGILE exposure to the source is reported in Table 4. We obtained a coverage of three of the observed bursts with MCAL data but no detection was found analysing the light curves in five binnings (16, 32, 64, 256 ms, and 1 s) and considering shifts of 1/4 of bin (four shifts for the first two time scales, two for the second two). We extracted a 3σ C.L. fluence ULs in 0.4–30 MeV energy band considering a cut-off power-law model, with a photon index of −0.70 and cut-off energy of 65 keV (as reported for the FRB 200428 burst by Mereghetti et al. 2020). We also estimated UL fluences that would be required to issue a trigger with the onboard 1 ms MCAL trigger logic timescale (see Ursi et al. 2022). We report the corresponding ULs in Table 4. These MCAL UL values are somewhat lower than the similar values previously published (see for instance Trudu et al. 2023), thanks to the non-standard spectral model applied in this work. The most stringent UL that we can place on the radio efficiency η = Eγ/ERadio is from burst B05, for which the non-activation of the MCAL trigger system permits us to obtain η < 1.5 × 10⁹ at 3σ C.L. in the 0.4–30 MeV energy range. This UL is more stringent than what found from the radio non-detection of a giant flare from magnetar SGR 1806-20, as already reported also for FRB20180916B in Tavani et al. (2020, 2021), for which η ∼ 1011 (Tendulkar et al. 2016). We conclude that observations in this work confirm the exclusion of giant X-ray flares as possible X-ray countepart of B05. Moreover, we set an UL value on η consistent with those previously reported for one-off and repeater sources (see, e.g., Figure 3 from Pearlman et al. 2023, and references therein). We note that our UL for η is conservative. Indeed, η depends on the radio isotropic energy of the burst, which in turn relies on the spectral occupancy. In our case, we considered Δν = 16 MHz, which is the observed bandwidth of the NC radio telescope, but the unknown intrinsic spectral width of the burst likely exceeds this value, and it could allow tighter constraints to be placed on η.
AGILE FRB 20220912A bursts coverage and MCAL ULs.
AGILE/GRID covered 2 of the 16 bursts (B05 and B15) at their ToA. We analysed GRID data near burst arrival times on short (±100 s around the bursts), and longer timescales (±10 days and 100 days starting about B05 trigger time). The long-timescale data analysis was performed applying the standard AGILE multi-source maximum likelihood (AML; Bulgarelli et al. 2012), which is mainly applied to exposures longer than a few hours. We report no detection at short timescales for AGILE/GRID. Finally, we extracted 3σ ULs in the E ≥ 100 MeV band for two long time integrations, 10 days after each burst and 100 days after burst B05 (the latter period of time includes also B15). We obtained UL10d = 2.0 × 10⁻¹¹ erg cm−2 s−1 and UL100d = 4.4 × 10⁻¹² erg cm−2 s−1. From the latter, we obtained Lγ < 7.1 × 1043 erg s−1 for the persistent γ-ray luminosity of the source.
No X-ray source was detected at > 3σ C.L. in the whole Swift/XRT WT mode dataset. We note however, with a detailed single observation check, that no radio burst was exposed even including three more proposals acquired in photon counting (PC) mode: burst B01 occurred 16 hrs after the observation on October 16th, 2022, while B16 occurred within our third observations but did not fall within the WT mode sky window. We then extracted a 3σ countrate ULs for our observations using the XIMAGE package (sosta command) and converted to fluxes using a standard single power-law spectral model with a photon index of 2.0, and correcting for absorption for a column density of NH fixed to the Galactic value of 1.43 × 1021cm−2 (HI4PI Collaboration 2016) corrected for the redshift of the source (Ravi et al. 2023). The X-ray observations exposure and the corresponding ULs for the persistent X-ray fluence are reported in Table 5. From the latter, we obtained an UL for the persistent X-ray luminosity LX = 4πDL2FX/(1 + z) < 3.4 × 1042 erg s−1, where DL is the luminosity distance of FRB 20220912A. We note that this UL excludes the majority of mid- and high-luminosity AGNs, which typically have X-ray luminosity LX ≥ 1043 erg s−1 (e.g. Padovani et al. 2017). This offers further evidence that the radio source detected with uGMRT (see Section 3.2) originates from a region of star formation, rather than from an AGN.
Swift exposures and flux ULs (0.3 – 10 keV).
4. Summary and conclusions
In this work, we present a campaign of simultaneous observations at 408 MHz and 1.4 GHz, taken with the NC and Mc radiotelescopes, respectively, of one of the most active repeaters known to date: FRB 20220912A. During the campaign, we detected 16 bursts from FRB 20220912A at 408 MHz. We found that the cumulative burst rate as a function of the spectral energy at 408 MHz can be aptly fitted with a single power-law function R(> Eν)∝EναE, with αE = −1.3 ± 0.2. We do not report any burst detection at 1.4 GHz in a total of 177 hr above a fluence and a spectral energy threshold of ℱ ≥ 20 Jy ms and 3.2 × 1030 erg Hz−1, respectively. These non-detections place an UL of 0.017 hr−1 at 95% C.L for the burst rate at 1.4 GHz, which is about four orders of magnitude lower than the level of activity reported at the same frequency during a burst storm of the source (Zhang et al. 2023; Feng et al. 2023) at the same spectral energy. On the other hand, the source remained active at 408 MHz with comparable repetition rate as observed from a long monitoring after the end of the burst storm (Sheikh et al. 2024). Interestingly, we note that the cumulative spectral energy rate distribution of FRB 20220912A flattens for bursts having a spectral energy of Eν ≥ 1031 erg Hz−1, changing slope from approximately αE ≈ −2 to αE ≈ −1. This flattening feature has been reported so far for two other well-studied hyperactive repeaters, R1 (Hewitt et al. 2022; Jahns et al. 2023) and FRB 20201124A (Kirsten et al. 2024). As discussed in Kirsten et al. (2024), this could be linked to a different type of emission mechanism, emission site or beaming angle between low and high energy bursts. This could potentially represent a link between one-off bursts and repeating sources (James et al. 2022b; Kirsten et al. 2024). The fact that also FRB 20220912A shows this kind of behaviour, combined with the fact that high energy bursts present a slope that is amply consistent with that of the non-repeaters population (James et al. 2022a,b; Shin et al. 2023), provides further support to the idea that a fraction of apparently non-repeating FRBs could (instead) be repeating sources with very low repetition rates (Ravi 2019; James 2023). We compared the cumulative spectral energy rate for FRB 20220912A and FRB 20201124A, highlighting a strong similarity between the two distributions, both in terms of the spectral energy and repetition rate ranges.
In total, 6 of the 16 bursts detected at 408 MHz arrived during simultaneous observations at 1.4 GHz, allowing us to place the first ULs to the broad-band (408 MHz–1.4 GHz) spectral index β of FRB 20220912A. Analysing the Mc data at the ToA of burst B11, which has the highest fluence, we obtained an UL of β < −2.3, indicating that the source (under the assumption of an intrinsically broad-band emission) exhibits a very steep spectral index. Our observations then strongly disfavor a flat or even inverted spectrum for FRB 20220912A. We note that this is different than what has been reported for the only two simultaneous detections of FRBs in separate frequency bands, the latter indicating a positive spectral index (Law et al. 2017; Bochenek et al. 2020; CHIME/FRB Collaboration 2020). Our findings support the idea that the intrinsic spectrum of FRB 20220912A’s bursts is narrow-band, as reported in recent observations (Zhang et al. 2023; Feng et al. 2023; Sheikh et al. 2024; Hewitt et al. 2024).
Additionally, we reported three-hour-long continuum radio observations of FRB 20220912A field using the band 5 (1050 − 1450 MHz) of the uGMRT. We detected a continuum radio source of 240 ± 40 μJy flux density that is spatially coincident with the FRB 20220912A VLBI localisation. Given it has not been detected in recent, deep, EVN observations (Hewitt et al. 2024), we suggest that this continuum radio source may possibly originate from a region of star formation, potentially located in the vicinity of the FRB source. This is corroborated by the 0.6″ offset (0.9 kpc in physical size) between the source centroid and the geometric centre of the optical host galaxy, which excludes the hypothesis that the radio source is being powered by an AGN.
Finally, we report the results of an X- and γ-ray monitoring of FRB 20220912A with the Swift and AGILE space missions in X- and γ rays, respectively. We reported no detection for either of these high-energy campaigns. Regarding AGILE, we placed an UL on the radio efficiency of η = Eγ/Eradio < 1.5 × 10⁹ for the B05 burst, the latter being more stringent than the UL on η obtained from the radio non-detection of a giant flare from magnetar SGR 1806-20 (Tendulkar et al. 2016) and consistent with literature ULs from one-off sources and repeaters (Pearlman et al. 2023), along with a persistent γ-ray luminosity UL of Lγ < 7.1 × 1043 erg s−1. From Swift observations we obtained instead a UL for the persistent X-ray luminosity (0.3–10 keV) of LX < 3.4 × 1042 erg s−1.
We considered a redshift z = 0.098 (Kilpatrick et al. 2021), corresponding to a luminosity distance DL = 453.3 Mpc (Zhang et al. 2022).
We divided the break istropic energy as reported in Jahns et al. (2023) by 450 MHz, i.e. an average effective bandwidth as reported therein. This value for the break spectral energy agrees well with what reported in Hewitt et al. (2022), when considering a bandwidth of 275 MHz.
Acknowledgments
We thank the anonymous referee for the useful comments, helping us in improving the quality of the paper. The reported data were collected during the phase of the INAF scientific exploitation with the NC radio telescope. This article was produced with the support of the PhD program in Space Science and Technology at the University of Trento, Cycle XXXIX, with the support of a scholarship financed by the Ministerial Decree no. 118 of 2nd March 2023, based on the NRRP – funded by the European Union – NextGenerationEU – Mission 4 “Education and Research”, Component 1 “Enhancement of the offer of educational services: from nurseries to universities”’ – Investment 4.1 “Extension of the number of research doctorates and innovative doctorates for public administration and cultural heritage” – CUP E66E23000110001 and of the Scuola Universitaria Superiore IUSS Pavia.
References
- Agarwal, D., Aggarwal, K., Burke-Spolaor, S., Lorimer, D. R., & Garver-Daniels, N. 2020, MNRAS, 497, 1661 [Google Scholar]
- Anna-Thomas, R., Connor, L., Dai, S., et al. 2023, Science, 380, 599 [NASA ADS] [CrossRef] [Google Scholar]
- Bailes, M. 2022, Science, 378, abj3043 [NASA ADS] [CrossRef] [Google Scholar]
- Barsdell, B. R., Bailes, M., Barnes, D. G., & Fluke, C. J. 2012, MNRAS, 422, 379 [CrossRef] [Google Scholar]
- Beloborodov, A. M. 2020, ApJ, 896, 142 [NASA ADS] [CrossRef] [Google Scholar]
- Bhandari, S., Marcote, B., Sridhar, N., et al. 2023, ApJ, 958, L19 [CrossRef] [Google Scholar]
- Bochenek, C. D., Ravi, V., Belov, K. V., et al. 2020, Nature, 587, 59 [NASA ADS] [CrossRef] [Google Scholar]
- Bochenek, C. D., Ravi, V., & Dong, D. 2021, ApJ, 907, L31 [Google Scholar]
- Bulgarelli, A., Chen, A. W., Tavani, M., et al. 2012, A&A, 540, A79 [NASA ADS] [CrossRef] [EDP Sciences] [Google Scholar]
- Burke-Spolaor, S., Trott, C. M., Brisken, W. F., et al. 2016, ApJ, 826, 223 [NASA ADS] [CrossRef] [Google Scholar]
- Burrows, D. N., Hill, J. E., Nousek, J. A., et al. 2005, Space Sci. Rev., 120, 165 [Google Scholar]
- Camilo, F., Reynolds, J., Johnston, S., Halpern, J. P., & Ransom, S. M. 2008, ApJ, 679, 681 [Google Scholar]
- Chatterjee, S., Law, C. J., Wharton, R. S., et al. 2017, Nature, 541, 58 [NASA ADS] [CrossRef] [Google Scholar]
- Chawla, P., Andersen, B. C., Bhardwaj, M., et al. 2020, ApJ, 896, L41 [NASA ADS] [CrossRef] [Google Scholar]
- Chawla, P., Kaspi, V. M., Ransom, S. M., et al. 2022, ApJ, 927, 35 [NASA ADS] [CrossRef] [Google Scholar]
- CHIME Collaboration (Amiri, M., et al.) 2022, ApJS, 261, 29 [CrossRef] [Google Scholar]
- CHIME/FRB Collaboration (Andersen, B. C., et al.) 2020, Nature, 587, 54 [Google Scholar]
- CHIME/FRB Collaboration (Amiri, M., et al.) 2021, ApJS, 257, 59 [NASA ADS] [CrossRef] [Google Scholar]
- CHIME/FRB Collaboration (Andersen, B. C., et al.) 2023, ApJ, 947, 83 [NASA ADS] [CrossRef] [Google Scholar]
- Cruces, M., Spitler, L. G., Scholz, P., et al. 2021, MNRAS, 500, 448 [Google Scholar]
- Dai, S., Lower, M. E., Bailes, M., et al. 2019, ApJ, 874, L14 [NASA ADS] [CrossRef] [Google Scholar]
- Duncan, R. C., & Thompson, C. 1992, ApJ, 392, L9 [Google Scholar]
- Esposito, P., Rea, N., Borghese, A., et al. 2020, ApJ, 896, L30 [NASA ADS] [CrossRef] [Google Scholar]
- Feng, Y., Li, D., Zhang, Y.-K., et al. 2023, ArXiv e-prints [arXiv:2304.14671] [Google Scholar]
- Flewelling, H. A., Magnier, E. A., Chambers, K. C., et al. 2020, ApJS, 251, 7 [NASA ADS] [CrossRef] [Google Scholar]
- Gajjar, V., Siemion, A. P. V., Price, D. C., et al. 2018, ApJ, 863, 2 [NASA ADS] [CrossRef] [Google Scholar]
- Gehrels, N., Chincarini, G., Giommi, P., et al. 2004, ApJ, 611, 1005 [Google Scholar]
- Good, D., & CHIME/FRB Collaboration 2020, ATel., 14074 [Google Scholar]
- Gordon, A. C., Fong, W.-F., Kilpatrick, C. D., et al. 2023, ApJ, 954, 80 [NASA ADS] [CrossRef] [Google Scholar]
- Gourdji, K., Michilli, D., Spitler, L. G., et al. 2019, ApJ, 877, L19 [NASA ADS] [CrossRef] [Google Scholar]
- Hessels, J. W. T., Spitler, L. G., Seymour, A. D., et al. 2019, ApJ, 876, L23 [Google Scholar]
- Hewitt, D. M., Snelders, M. P., Hessels, J. W. T., et al. 2022, MNRAS, 515, 3577 [NASA ADS] [CrossRef] [Google Scholar]
- Hewitt, D. M., Hessels, J. W. T., Ould-Boukattine, O. S., et al. 2023, MNRAS, 526, 2039 [NASA ADS] [CrossRef] [Google Scholar]
- Hewitt, D. M., Bhandari, S., Hessels, J. W. T., et al. 2024, MNRAS, 529, 1814 [NASA ADS] [CrossRef] [Google Scholar]
- HI4PI Collaboration (Ben Bekhti, N.), et al. 2016, A&A, 594, A116 [NASA ADS] [CrossRef] [EDP Sciences] [Google Scholar]
- Houben, L. J. M., Spitler, L. G., ter Veen, S., et al. 2019, A&A, 623, A42 [NASA ADS] [CrossRef] [EDP Sciences] [Google Scholar]
- Israel, G. L., Burgay, M., Rea, N., et al. 2021, ApJ, 907, 7 [NASA ADS] [CrossRef] [Google Scholar]
- Jahns, J. N., Spitler, L. G., Nimmo, K., et al. 2023, MNRAS, 519, 666 [Google Scholar]
- James, C. W. 2023, PASA, 40, e057 [NASA ADS] [CrossRef] [Google Scholar]
- James, C. W., Osłowski, S., Flynn, C., et al. 2020, ApJ, 895, L22 [NASA ADS] [CrossRef] [Google Scholar]
- James, C. W., Prochaska, J. X., Macquart, J. P., et al. 2022a, MNRAS, 510, L18 [Google Scholar]
- James, C. W., Ghosh, E. M., Prochaska, J. X., et al. 2022b, MNRAS, 516, 4862 [NASA ADS] [CrossRef] [Google Scholar]
- Kilpatrick, C. D., Fong, W., Prochaska, J. X., et al. 2021, ATel., 14516 [Google Scholar]
- Kirsten, F., Jenkins, M., Snelders, M., et al. 2020, ATel., 13735 [Google Scholar]
- Kirsten, F., Snelders, M. P., Jenkins, M., et al. 2021, Nat. Astron., 5, 414 [Google Scholar]
- Kirsten, F., Ould-Boukattine, O. S., Herrmann, W., et al. 2024, Nat. Astron., 8, 1 [Google Scholar]
- Kumar, P., Shannon, R. M., Flynn, C., et al. 2021, MNRAS, 500, 2525 [Google Scholar]
- Lanman, A. E., Andersen, B. C., Chawla, P., et al. 2022, ApJ, 927, 59 [NASA ADS] [CrossRef] [Google Scholar]
- Law, C. J., Abruzzo, M. W., Bassa, C. G., et al. 2017, ApJ, 850, 76 [Google Scholar]
- Lazaridis, K., Jessner, A., Kramer, M., et al. 2008, MNRAS, 390, 839 [NASA ADS] [CrossRef] [Google Scholar]
- Li, D., Wang, P., Zhu, W. W., et al. 2021, Nature, 598, 267 [CrossRef] [Google Scholar]
- Locatelli, N. T., Bernardi, G., Bianchi, G., et al. 2020, MNRAS, 494, 1229 [NASA ADS] [CrossRef] [Google Scholar]
- Lorimer, D. R. 2011, Astrophysics Source Code Library [record ascl:1107.016] [Google Scholar]
- Lorimer, D. R., & Kramer, M. 2004, Handbook of Pulsar Astronomy (Cambridge, UK: Cambridge University Press), 4 [Google Scholar]
- Lower, M. E., Shannon, R. M., & Kumar, P. 2022, ATel., 15172 [Google Scholar]
- Lu, W., Kumar, P., & Zhang, B. 2020, MNRAS, 498, 1397 [NASA ADS] [CrossRef] [Google Scholar]
- Lyubarsky, Y. 2020, ApJ, 897, 1 [NASA ADS] [CrossRef] [Google Scholar]
- Maan, Y., Leeuwen, J. V., Straal, S., & Pastor-Marazuela, I., 2022, ATel., 15697 [Google Scholar]
- Macquart, J. P., & Ekers, R. 2018, MNRAS, 480, 4211 [NASA ADS] [CrossRef] [Google Scholar]
- Marcote, B., Paragi, Z., Hessels, J. W. T., et al. 2017, ApJ, 834, L8 [CrossRef] [Google Scholar]
- Marcote, B., Kirsten, F., Hessels, J., et al. 2022, Eur. VLBI Network Mini-Symp. Users’ Meet., 2021, 35 [Google Scholar]
- Margalit, B., & Metzger, B. D. 2018, ApJ, 868, L4 [NASA ADS] [CrossRef] [Google Scholar]
- Marthi, V. R., Bethapudi, S., Main, R. A., et al. 2022, MNRAS, 509, 2209 [NASA ADS] [Google Scholar]
- Mckinven, R., & CHIME/FRB Collaboration 2022, ATel., 15679 [Google Scholar]
- McMullin, J. P., Waters, B., Schiebel, D., Young, W., & Golap, K. 2007, ASP Conf. Ser., 376, 127 [Google Scholar]
- Mereghetti, S., Savchenko, V., Ferrigno, C., et al. 2020, ApJ, 898, L29 [Google Scholar]
- Michilli, D., Seymour, A., Hessels, J. W. T., et al. 2018, Nature, 553, 182 [Google Scholar]
- Nimmo, K., Hessels, J. W. T., Snelders, M. P., et al. 2023, MNRAS, 520, 2281 [NASA ADS] [CrossRef] [Google Scholar]
- Niu, C. H., Aggarwal, K., Li, D., et al. 2022, Nature, 606, 873 [NASA ADS] [CrossRef] [Google Scholar]
- Padovani, P., Alexander, D. M., Assef, R. J., et al. 2017, A&ARv., 25, 2 [NASA ADS] [CrossRef] [Google Scholar]
- Pastor-Marazuela, I., Connor, L., van Leeuwen, J., et al. 2021, Nature, 596, 505 [NASA ADS] [CrossRef] [Google Scholar]
- Pearlman, A. B., Scholz, P., Bethapudi, S., et al. 2023, ArXiv e-prunts [arXiv:2308.10930] [Google Scholar]
- Pelliciari, D., Bernardi, G., Pilia, M., et al. 2023, A&A, 674, A223 [NASA ADS] [CrossRef] [EDP Sciences] [Google Scholar]
- Perley, R. A., & Butler, B. J. 2013, ApJS, 204, 19 [Google Scholar]
- Petroff, E., Hessels, J. W. T., & Lorimer, D. R. 2022, A&ARv., 30, 2 [NASA ADS] [CrossRef] [Google Scholar]
- Piro, L., Bruni, G., Troja, E., et al. 2021, A&A, 656, L15 [NASA ADS] [CrossRef] [EDP Sciences] [Google Scholar]
- Planck Collaboration XIII. 2016, A&A, 594, A13 [NASA ADS] [CrossRef] [EDP Sciences] [Google Scholar]
- Pleunis, Z., Good, D. C., Kaspi, V. M., et al. 2021, ApJ, 923, 1 [NASA ADS] [CrossRef] [Google Scholar]
- Popov, S. B., & Postnov, K. A. 2013, ArXiv e-prints [arXiv:1307.4924] [Google Scholar]
- Ransom, S. M., Eikenberry, S. S., & Middleditch, J. 2002, AJ, 124, 1788 [Google Scholar]
- Ravi, V. 2019, Nat. Astron., 3, 928 [NASA ADS] [CrossRef] [Google Scholar]
- Ravi, V., Catha, M., Chen, G., et al. 2023, ApJ, 949, L3 [NASA ADS] [CrossRef] [Google Scholar]
- Resmi, L., Vink, J., & Ishwara-Chandra, C. H. 2021, A&A, 655, A102 [NASA ADS] [CrossRef] [EDP Sciences] [Google Scholar]
- Ridnaia, A., Golenetskii, S., Aptekar, R., et al. 2020, GRB Coordinates Network, 27554 [Google Scholar]
- Sand, K. R., Breitman, D., Michilli, D., et al. 2023, ApJ, 956, 23 [NASA ADS] [CrossRef] [Google Scholar]
- Sheikh, S. Z., Farah, W., Pollak, A. W., et al. 2024, MNRAS, 527, 10425D [Google Scholar]
- Shin, K., Masui, K. W., Bhardwaj, M., et al. 2023, ApJ, 944, 105 [NASA ADS] [CrossRef] [Google Scholar]
- Sobacchi, E., Lyubarsky, Y., Beloborodov, A. M., & Sironi, L. 2022, MNRAS, 511, 4766 [NASA ADS] [CrossRef] [Google Scholar]
- Sridhar, N., Metzger, B. D., & Fang, K. 2024, ApJ, 960, 74 [NASA ADS] [CrossRef] [Google Scholar]
- Tavani, M., Barbiellini, G., Argan, A., et al. 2009, A&A, 502, 995 [NASA ADS] [CrossRef] [EDP Sciences] [Google Scholar]
- Tavani, M., Verrecchia, F., Casentini, C., et al. 2020, ApJ, 893, L42 [NASA ADS] [CrossRef] [Google Scholar]
- Tavani, M., Casentini, C., Ursi, A., et al. 2021, Nat. Astron., 5, 401 [NASA ADS] [CrossRef] [Google Scholar]
- Tendulkar, S. P., Kaspi, V. M., & Patel, C. 2016, ApJ, 827, 59 [NASA ADS] [CrossRef] [Google Scholar]
- Thompson, C., & Duncan, R. C. 1995, MNRAS, 275, 255 [Google Scholar]
- Trudu, M., Pilia, M., Bernardi, G., et al. 2022, MNRAS, 513, 1858 [NASA ADS] [CrossRef] [Google Scholar]
- Trudu, M., Pilia, M., Nicastro, L., et al. 2023, A&A, 676, A17 [NASA ADS] [CrossRef] [EDP Sciences] [Google Scholar]
- Tuccari, G. 2003, ASP Conf. Ser., 306, 177 [NASA ADS] [Google Scholar]
- Ursi, A., Verrecchia, F., Piano, G., et al. 2022, ApJ, 924, 80 [NASA ADS] [CrossRef] [Google Scholar]
- Whitney, A., Kettenis, M., Phillips, C., & Sekido, M. 2010, in Sixth International VLBI Service for Geodesy and Astronomy. Proceedings from the 2010 General Meeting, eds. R. Navarro, S. Rogstad, C. E. Goodhart, et al., 192 [Google Scholar]
- Xu, H., Niu, J. R., Chen, P., et al. 2022, Nature, 609, 685 [NASA ADS] [CrossRef] [Google Scholar]
- Xu, J., Feng, Y., Li, D., et al. 2023, Universe, 9, 330 [NASA ADS] [CrossRef] [Google Scholar]
- Zhang, B. 2023, Rev. Mod. Phys., 95, 035005 [NASA ADS] [CrossRef] [Google Scholar]
- Zhang, C. F., Jiang, J. C., Men, Y. P., et al. 2020, ATel., 13699 [Google Scholar]
- Zhang, Y.-K., Wang, P., Feng, Y., et al. 2022, Res. Astron. Astrophys., 22, 124002 [CrossRef] [Google Scholar]
- Zhang, Y.-K., Li, D., Zhang, B., et al. 2023, ApJ, 955, 142 [NASA ADS] [CrossRef] [Google Scholar]
- Zhou, D. J., Han, J. L., Zhang, B., et al. 2022, Res. Astron. Astrophys., 22, 124001 [CrossRef] [Google Scholar]
- Zhu, W., Xu, H., Zhou, D., et al. 2023, Sci. Adv., 9, eadf6198 [NASA ADS] [CrossRef] [Google Scholar]
All Tables
Parameters obtained from the power-law fitting of the cumulative energy distributions for FRBs 20220912A and 20201124A.
ULs on fluence and broad-band spectral index β for Medicina observations for which there is a simultaneous burst detection at 408 MHz from NC radio telescope.
All Figures
|
Fig. 1. Overview of the FRB 20220912A monitoring campaign. Panel a displays the MJD range 59868–59903 (35 days), while panel b shows the MJD range 60081 – 60309 (228 days). Green (red) vertical blocks indicate observations at 408 MHz (1.4 GHz). Vertical black lines represent burst detections at 408 MHz. Each observing session at 408 MHz last ∼35 minutes, while 1.4 GHz observations started 15 minutes before the P band run and last ∼60 minutes. |
| In the text | |
|
Fig. 2. Bursts from FRB 20220912A observed at 408 MHz. Both the de-dispersed, dynamic spectrum (bottom sub-panels) and the frequency-averaged profiles (top sub-panels) are shown. For a better visualisation, the data were down-sampled to have 16 frequency channels (each 1 MHz wide) and time bins 1.5 ms in width. Horizontal white rows (highlighted with red ticks) are flagged channels due to RFI. |
| In the text | |
|
Fig. 3. Comparison between the cumulative spectral energy rate distribution for two hyperactive repeaters at different observing frequencies and times. Left: FRB 20220912A at 408 MHz (white stars; this work), 1.25 GHz (orange circles; Zhang et al. 2023), 1.4 GHz (green pentagons and red squares; Feng et al. 2023; Hewitt et al. 2024 and 1.572 GHz (blue diamonds; Sheikh et al. 2024). The 95% C.L. UL for R(Eν > 2.5 × 1030 erg Hz−1) from our 1.4 GHz observations is plotted as a black downward arrow. Right: FRB 20201124A at 600 MHz (pink stars; Lanman et al. 2022), 650 MHz (blue squares; Marthi et al. 2022), 1.25 GHz (orange circles; Zhang et al. 2022) and 1.4 GHz (green diamonds; Kirsten et al. 2024). The 95% C.L. UL for R(Eν > 2 × 1031 erg Hz−1) from P (334 MHz) resulting from non-detections in Kirsten et al. (2024), is plotted as a blue downward arrows. |
| In the text | |
|
Fig. 4. Optical Pan-STARRS (i filter) image of PSO J347.2702+48.7066, the host galaxy of FRB 20220912A, with contour levels representing the continuum radio source we detected at 1.26 GHz, with a 1.97″ × 1.77″ synthesised beam. Contours are drawn from three to six times the rms noise level σ ≃ 36 μJy beam−1. The white cross represents the position of APTF J23 radio source, with the cross extensions being the 1σ uncertainties on its centroid (Hewitt et al. 2024), while the blue cross indicates the position of FRB 20220912A localised at milliarcsecond angular resolution (Hewitt et al. 2024). The synthesised beam of our uGMRT observations is represented in the bottom left corner of the image as a white ellipse. |
| In the text | |
Current usage metrics show cumulative count of Article Views (full-text article views including HTML views, PDF and ePub downloads, according to the available data) and Abstracts Views on Vision4Press platform.
Data correspond to usage on the plateform after 2015. The current usage metrics is available 48-96 hours after online publication and is updated daily on week days.
Initial download of the metrics may take a while.