Fig. 3.
Download original image
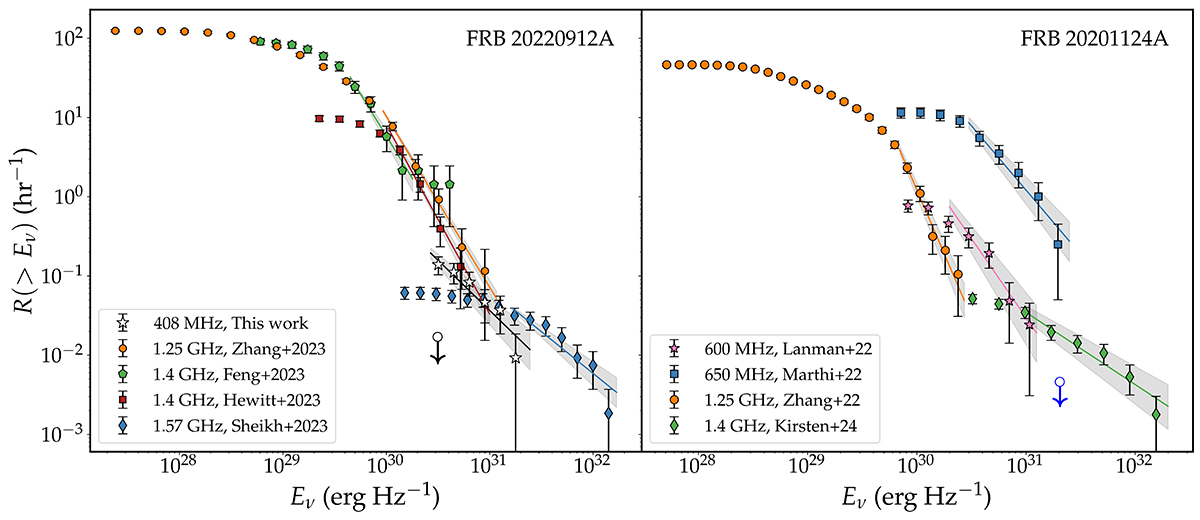
Comparison between the cumulative spectral energy rate distribution for two hyperactive repeaters at different observing frequencies and times. Left: FRB 20220912A at 408 MHz (white stars; this work), 1.25 GHz (orange circles; Zhang et al. 2023), 1.4 GHz (green pentagons and red squares; Feng et al. 2023; Hewitt et al. 2024 and 1.572 GHz (blue diamonds; Sheikh et al. 2024). The 95% C.L. UL for R(Eν > 2.5 × 1030 erg Hz−1) from our 1.4 GHz observations is plotted as a black downward arrow. Right: FRB 20201124A at 600 MHz (pink stars; Lanman et al. 2022), 650 MHz (blue squares; Marthi et al. 2022), 1.25 GHz (orange circles; Zhang et al. 2022) and 1.4 GHz (green diamonds; Kirsten et al. 2024). The 95% C.L. UL for R(Eν > 2 × 1031 erg Hz−1) from P (334 MHz) resulting from non-detections in Kirsten et al. (2024), is plotted as a blue downward arrows.
Current usage metrics show cumulative count of Article Views (full-text article views including HTML views, PDF and ePub downloads, according to the available data) and Abstracts Views on Vision4Press platform.
Data correspond to usage on the plateform after 2015. The current usage metrics is available 48-96 hours after online publication and is updated daily on week days.
Initial download of the metrics may take a while.