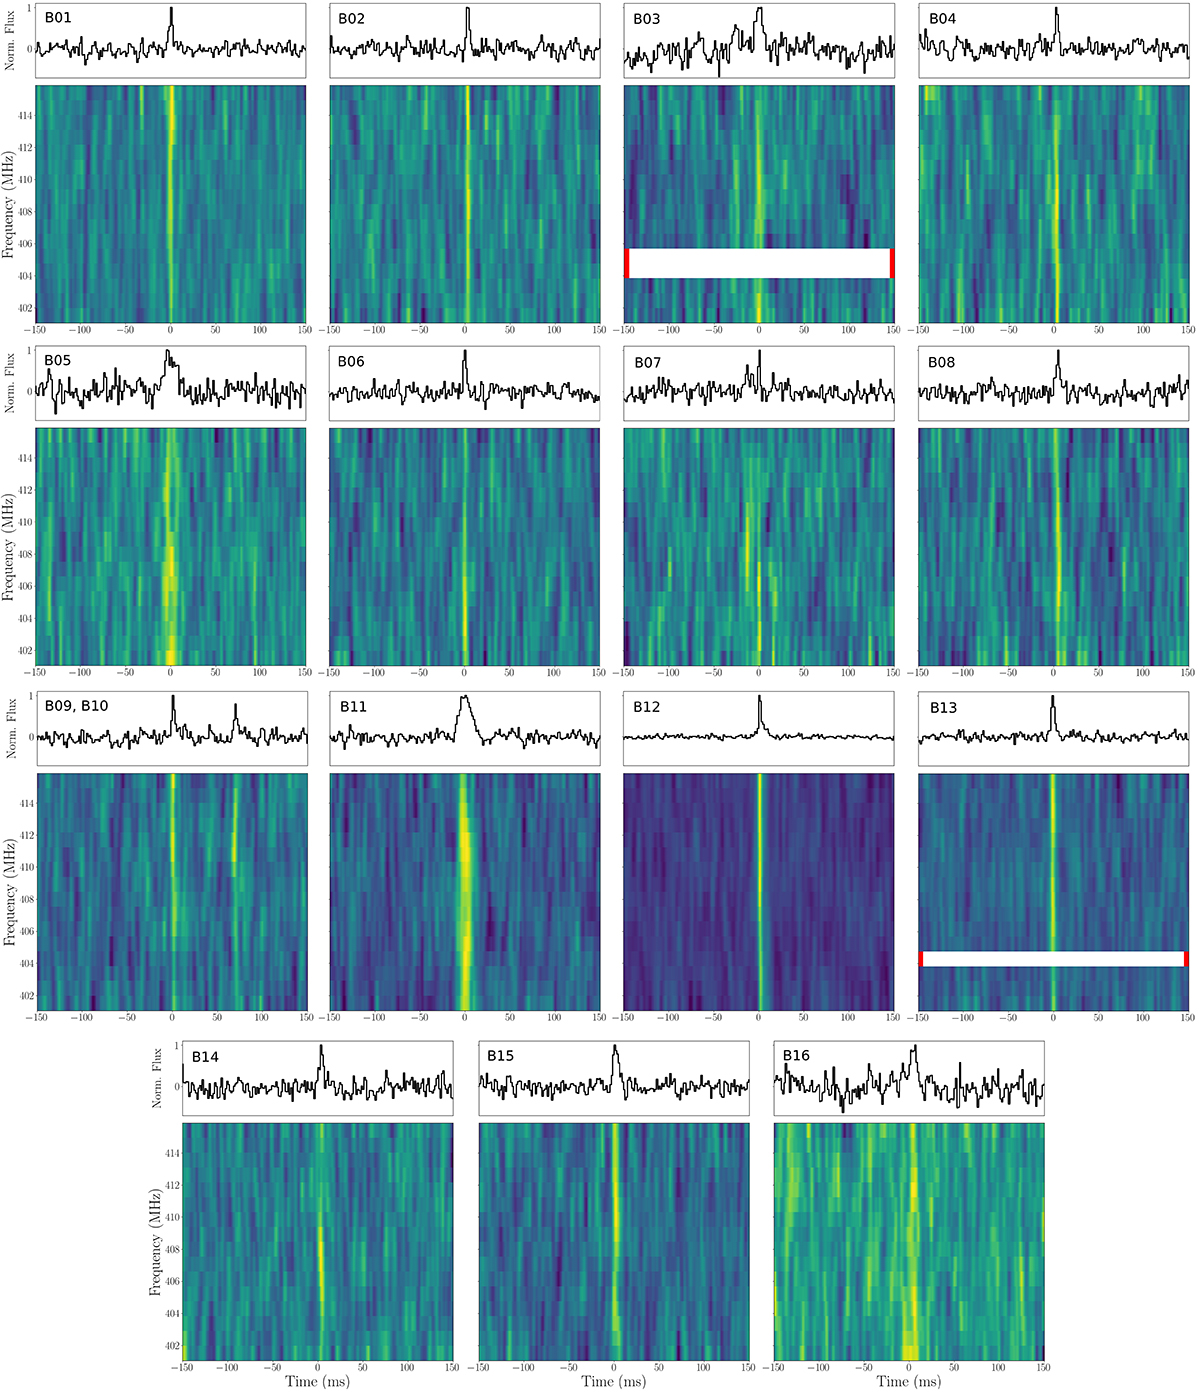
Fig. 2.
Download original image
Bursts from FRB 20220912A observed at 408 MHz. Both the de-dispersed, dynamic spectrum (bottom sub-panels) and the frequency-averaged profiles (top sub-panels) are shown. For a better visualisation, the data were down-sampled to have 16 frequency channels (each 1 MHz wide) and time bins 1.5 ms in width. Horizontal white rows (highlighted with red ticks) are flagged channels due to RFI.
Current usage metrics show cumulative count of Article Views (full-text article views including HTML views, PDF and ePub downloads, according to the available data) and Abstracts Views on Vision4Press platform.
Data correspond to usage on the plateform after 2015. The current usage metrics is available 48-96 hours after online publication and is updated daily on week days.
Initial download of the metrics may take a while.