| Issue |
A&A
Volume 674, June 2023
|
|
|---|---|---|
| Article Number | A222 | |
| Number of page(s) | 9 | |
| Section | Cosmology (including clusters of galaxies) | |
| DOI | https://doi.org/10.1051/0004-6361/202345882 | |
| Published online | 27 June 2023 | |
Testing decaying dark matter models as a solution to the S8 tension with the thermal Sunyaev-Zel’dovich effect
1
Université Paris-Saclay, CNRS, Institut d’Astrophysique Spatiale, Bâtiment 121, 91405 Orsay, France
2
Kavli IPMU (WPI), UTIAS, The University of Tokyo, Kashiwa, Chiba, 277-8583
Japan
e-mail: This email address is being protected from spambots. You need JavaScript enabled to view it.
Received:
10
January
2023
Accepted:
5
May
2023
Abstract
Considering possible solutions to the S8 tension between the Planck cosmic microwave background (CMB) measurement and low-redshift probes, we extended the standard ΛCDM cosmological model by including decay of dark matter (DDM). We first tested the DDM model in which dark matter decays into a form of noninteracting dark radiation. Under this DDM model, we investigated the impacts of DDM on the Sunyaev Zel’dovich (SZ) effect by varying the decay lifetime, Γ−1, including the background evolution in cosmology and the nonlinear prescription in the halo mass function. We performed a cosmological analysis under the assumption of this extended cosmological model by combining the latest high-redshift Planck CMB measurement and low-redshift measurements of the SZ power spectrum as well as the baryonic acoustic oscillations (BAO) and luminosity distances to type Ia supernovae (SNIa). Our result shows a preference for Γ−1 ∼ 220 Gyr with a lower bound on the decay lifetime of ∼38 Gyr at 95% confidence level. Additionally, we tested the other DDM model in which dark matter decays into warm dark matter and dark radiation. This model supports Γ−1 ∼ 137 Gyr to resolve the S8 tension with a lower bound on the decay lifetime of ∼24 Gyr at 95% confidence level. Comparing these two models, we find that the second leads to slightly better reconciliation of the S8 tension.
Key words: cosmic background radiation / large-scale structure of Universe / dark matter / galaxies: clusters: general / galaxies: clusters: intracluster medium
© The Authors 2023
 Open Access article, published by EDP Sciences, under the terms of the Creative Commons Attribution License (https://creativecommons.org/licenses/by/4.0), which permits unrestricted use, distribution, and reproduction in any medium, provided the original work is properly cited.
This article is published in open access under the Subscribe to Open model. This email address is being protected from spambots. You need JavaScript enabled to view it. to support open access publication.
1. Introduction
The current standard cosmological model, called the Λcold dark matter (ΛCDM) model, has been supported by many observational results at different epochs, such as cosmic microwave background (CMB), big bang nucleosynthesis (BBN), and luminosity distances to type Ia supernovae (SNIa). However, as measurement precision has increased over the past few years, the validity of the ΛCDM model is under reexamination, particularly due to a discrepancy in the S8(≡σ8(Ωm/0.3)0.5 parameter, which is the amplitude of matter density fluctuations, σ8, scaled by the square root of the matter density, Ωm. For example, Planck measured S8 = 0.830 ± 0.013 with the CMB anisotropies (z ∼ 1100; Planck Collaboration VI 2020), but low-redshift (z ∼ 0 − 1) cosmological probes, such as the abundance of galaxy clusters by Planck (Planck Collaboration XX 2014; Planck Collaboration XXIV 2016) and gravitational lensing by the Kilo Degree Survey (KiDS; Heymans et al. 2021) and Dark Energy Survey (DES; DES Collaboration 2022), show a preference for a lower value of S8 ∼ 0.76 − 0.78, representing a tension of up to ∼2 − 3σ with the CMB constraints, referred to as the S8 tension. This tension indicates that the growth rate of the cosmic structure is less than expected from the CMB measurements and may demand modifications to the standard model.
Many attempts have been made to solve the S8 tension by breaking assumptions in the standard cosmological model, mainly on the nature of neutrinos (e.g., Salvati et al. 2018; Tröster et al. 2021), dark energy (e.g., Bolliet et al. 2018; Salvati et al. 2018; Lambiase et al. 2019; Di Valentino et al. 2020a,b; Tröster et al. 2021), modified gravity (e.g., Ilić et al. 2019), and others (e.g., Nunes & Vagnozzi 2021) However, none of the proposed solutions have gained wide acceptance so far. One possible solution is the decaying dark matter (DDM) model (e.g., Doroshkevich et al. 1989; Aoyama et al. 2014; Audren et al. 2014; Enqvist et al. 2015, 2020; Poulin et al. 2016; Xiao et al. 2020; Abellán et al. 2021; Chen et al. 2021; Hubert et al. 2021; Holm et al. 2023; Fuß & Garny 2022; Abellán et al. 2022; Mau et al. 2022; McCarthy & Hill 2022; Simon et al. 2022; Bucko et al. 2023). The DDM model has two features that reduce the cosmic structure growth and could naturally explain the S8 tension. First, the cosmic structure growth is reduced by the decay of massive dark matter (DM) into lighter or massless daughter particles. Second, the DDM model can only change the structure formation scenario at low redshift, which is probed by clusters of galaxies, lensing, and so on, without modifying the scenario at high redshift – which can be probed by CMB – before dark matter decays.
While several scenarios can be considered for the decay modes, we consider two scenarios: one scenario in which DM decays into a form of noninteracting dark radiation (DR), hereafter referred to as the ΛDDM1 model (e.g., Audren et al. 2014; Enqvist et al. 2015, 2020; Poulin et al. 2016) and another scenario, where DM decays into one massless DR component and one massive warm DM (WDM) particle (hereafter ΛDDM2 model) that interacts only through gravity with the standard model particles (e.g., Aoyama et al. 2014; Abellán et al. 2021, 2022). The ΛDDM1 model can be parameterized with the decay rate, Γ (Γ−1 represents the lifetime of DM), in addition to the cosmological parameters under the standard ΛCDM model. The DDM2 model can be parameterized with two parameters: Γ, and ε, which represents the mass-energy fraction transferred to the massless component of DR (Aoyama et al. 2014; Abellán et al. 2021, 2022). Many studies have been performed for the simplest scenario, that is, the ΛDDM1 model, and tight constraints have been put on the lifetime of the DM particle of Γ−1 > 160 Gyr (e.g., Audren et al. 2014; Enqvist et al. 2015, 2020; Poulin et al. 2016), which is much greater than the current age of the Universe. Fewer studies have considered the extended DDM models, such as the ΛDDM2 scenario. For example, Abellán et al. (2022) showed that the ΛDDM2 can fully explain the low-S8 measurement with a shorter lifetime of Γ−1 ≃ 55 (ε/0.007)1.4 Gyr using the Planck CMB measurement (Planck Collaboration VI 2020) combined with the baryonic acoustic oscillations (BAO) measurements from the 6-degree Field Galaxy Survey (6dF; Beutler et al. 2011), the Sloan Digital Sky Survey (SDSS; Ross et al. 2015), the Baryon Oscillation Spectroscopic Survey (BOSS; Alam et al. 2017), and the Extended Baryon Oscillation Spectroscopic Survey (eBOSS; Blomqvist 2019; de Sainte Agathe & Balland 2019), including the SNIa measurement from Pantheon (Scolnic et al. 2018). A further study was performed by Abellán et al. (2021), who included KiDS and DES weak-lensing data (Abbott et al. 2018; Joudaki et al. 2020; Heymans et al. 2021), with the authors concluding that there is a preference for the ΛDDM2 model over the standard ΛCDM model when KiDS and DES weak-lensing data are included, without degrading the fit to other cosmological datasets such as CMB, BAO, and SNIa measurements.
In this paper, we use the thermal Sunyaev-Zel’dovich (SZ) effect (Sunyaev & Zeldovich 1970, 1972) as a probe for the S8 tension. To investigate the S8 parameter, the SZ effect, which is caused by the inverse Compton scattering of CMB photons by hot electrons along the line of sight, is a useful probe because the SZ power spectrum,  , is sensitive to the σ8 and Ωm cosmological parameters as
  (Planck Collaboration XXII 2016; Salvati et al. 2018). The S8 tension was first revealed by cosmological analysis of the SZ cluster number counts from Planck (Planck Collaboration XX 2014). Recent SZ results (Planck Collaboration XXII 2016; Tanimura et al. 2022) showed a similar S8 value of
 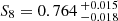 to the weak-lensing and cluster-count observations, confirming a tension with the Planck CMB result. As a solution for the S8 tension, we assume that the origin of the tension is caused by the DDM and constrain the cosmological parameters and the DDM models using the latest SZ power spectrum measurement in Tanimura et al. (2022; hereafter T22). In our cosmological analyses, this SZ measurement is combined with other low-redshift probes that constrain the expansion history of the Universe, such as the BAO measurements from 6dFGS at z = 0.106 (Beutler et al. 2011), SDSS DR7 at z = 0.15 (Ross et al. 2015), and BOSS DR12 at z = 0.38, 0.51, 0.61 Alam et al. (2017) as well as the Pantheon SNIa catalog (Scolnic et al. 2018) (BAO+SNIa). The present paper is structured as follows. Section 2 describes the model of the SZ power spectrum, including the DDM model. Section 3 presents the constraint we place on the DDM model as a result of our cosmological analysis. We finally end with the conclusions of this study in Sect. 4.
2. Theoretical background
In this section, we first describe the theoretical prescription of the SZ effect, in particular the SZ angular power spectrum under the ΛCDM model by following T22, and then modify it to include the DDM models.
2.1. Compton y parameter
The Compton y parameter is proportional to the line-of-sight integral of electron pressure, Pe = nekBTe, where ne is the physical electron number density, kB is the Boltzmann constant, and Te is the electron temperature. In an angular direction,  , this Compton parameter is expressed as
 (1)
(1)
where σT is the Thomson cross section, me is the mass of one electron, c is the speed of light, and l is the physical distance. The change to the CMB temperature by the SZ effect, ΔT, at frequency ν is given by
 (2)
(2)
where TCMB is the CMB temperature. The frequency dependence of the SZ effect is included in the pre-factor f(x) as
 (3)
(3)
in the thermodynamic temperature unit, where h is the Planck constant.
2.2. SZ angular power spectrum
The SZ power spectrum can be modeled with a halo model (Cooray & Sheth 2002). The halo model consists of a “one-halo term”, which accounts for the correlation arising within an individual halo, and a “two-halo term”, which accounts for the correlation arising due to the environment surrounding a halo (Komatsu et al. 2002; Cooray & Sheth 2002). In this paper, we consider only the one-halo term because the contribution from the two-halo term to the total SZ power spectrum is minor (Komatsu & Kitayama 1999) at the scales we consider (ℓ > 60). The SZ power spectrum is then given by
 (4)
(4)
where d2V/dzdΩ is the comoving volume element per redshift per steradian, n(M, z) is the comoving number density of halos of mass M and redshift z, called the halo mass function (HMF), and  is the 2D Fourier transform of the y-profile of a halo, given by
 (5)
(5)
where rs is the characteristic scale radius of the pressure profile and xr = r/rs is the dimensionless radial scale. dA is the angular diameter distance and ℓs = dA/rs is the associated multipole moment. We integrate the contribution of halos in the redshift range from 0 to 3 and the mass range from 1013 M⊙ to 5 × 10¹⁵ M⊙ as well as the scaled radial distance, xr, in the range from 0 to 5, following T22.
2.3. Halo mass function
We use the mass function from Tinker et al. (2008), as in T22, in which the number of halos per unit volume is given by
 (6)
(6)
where ρm, 0 is the matter density at z = 0 and f(σ) is given by
![Mathematical equation: $$ \begin{aligned} f(\sigma ) = A \left[ 1 + \left( \frac{\sigma }{b} \right)^{-a} \right] \mathrm{exp} \left( - \frac{c}{\sigma ^2} \right), \end{aligned} $$](/articles/aa/full_html/2023/06/aa45882-23/aa45882-23-eq12.gif) (7)
(7)
where A, a, b, c are constants calibrated with simulations in Tinker et al. (2008). Here, σ is the standard deviation of density perturbations in a sphere of radius R = (3M/4πρm, 0)1/3, and is given by
 (8)
(8)
where W(kR) is the window function of a spherical top hat of radius R.
2.4. Universal pressure profile
For the electron pressure profile, we use the model from Planck Collaboration V (2013), which is used as a fiducial model in T22, and adopts the “universal” pressure profile (UPP; Nagai et al. 2007), which is a form of the generalized Navarro et al. (NFW; 1997) profile (gNFW),
![Mathematical equation: $$ \begin{aligned} \mathbb{P} (x_{\rm 500}) = \frac{P_{0}}{(c_{500} x_{\rm 500})^{\gamma } [1 + (c_{500} x_{\rm 500})^{\alpha }]^{(\beta -\alpha )/\gamma } }. \end{aligned} $$](/articles/aa/full_html/2023/06/aa45882-23/aa45882-23-eq14.gif) (9)
(9)
Here, x500 = r/R500 and we remind the reader that R500 denotes 500 times the critical density. The model is defined by the following parameters: P0, a normalization; c500, a concentration parameter defined at a characteristic radius R500; and the slopes in the central (x500 ≪ 1/c500), intermediate (x500 ∼ 1/c500), and outer regions (x500 ≫ 1/c500), which are given by γ, α, and β, respectively. The scaled pressure profile for a halo with M500 and z is
 (10)
(10)
with
![Mathematical equation: $$ \begin{aligned} P_{500}&= 1.65 \times 10^{-3} \left[\frac{H(z)}{H_0}\right]^{8/3} \nonumber \\&\times \left[ \frac{ (1-b) \, M_{500}}{3 \times 10^{14} \, (h/0.7)^{-1}\,{M}_{\odot }} \right]^{2/3+ \alpha _{\rm p}} \left(\frac{h}{0.7}\right)^{2}\,\mathrm{keV\,cm}^{-3}, \end{aligned} $$](/articles/aa/full_html/2023/06/aa45882-23/aa45882-23-eq16.gif) (11)
(11)
where H(z) is the Hubble parameter at redshift z and H0 = 100 h km s−1 Mpc−1 is the present value. P500 is the characteristic pressure reflecting the mass variation expected in a self-similar model of pressure evolution when αp = 0, purely based on gravitation (Arnaud et al. 2010). Deviation from the self-similarity appears in a variation of the scaled pressure profile, given by
![Mathematical equation: $$ \begin{aligned} \frac{P(r)}{P_{500}} = \mathbb{P} (x) \left[ \frac{ (1-b) \, M_{500}}{3 \times 10^{14} \, (h/0.7)^{-1}\,{M}_{\odot }} \right]^{\alpha _{\rm p}}, \end{aligned} $$](/articles/aa/full_html/2023/06/aa45882-23/aa45882-23-eq17.gif) (12)
(12)
expressed as a function of M500. Here, b is the hydrostatic mass bias. We note that we use the pressure model in Planck Collaboration V (2013) in which M500 alternatively corresponds to the hydrostatic mass, (1 − b) M500. For the mass bias, we adopt (1 − b) = 0.780 ± 0.092 derived from the Canadian Cluster Comparison Project (Hoekstra et al. 2015; CCCP), which is consistent with most of the results from hydrodynamic simulations (Gianfagna et al. 2021). For the parameters of the generalized NFW electron pressure profile, we adopt the best-fit values of [P0, c500, γ, α, β]=[6.41, 1.81, 0.31, 1.33, 4.13], estimated from 62 massive nearby clusters (1014.4 < M500 < 1015.3 M⊙) using the Planck SZ and XMM-Newton X-ray data in Planck Collaboration V (2013). We also adopt αp = 0.12 from the measurement in Arnaud et al. (2010).
2.5. Decaying dark matter model implementation
We include the DDM model based on the public code provided by Abellán et al. (2021; hereafter G21)1, in which the DDM model is implemented in the modified version of the Boltzmann code, CLASS (Blas et al. 2011; Lesgourgues & Tram 2011). In this code, the 1-body (ΛDDM1 model) and 2-body (ΛDDM2 model) decaying DM models are implemented by including two additional parameters with respect to ΛCDM; one is the decay rate, Γ, and the other is the mass-energy fraction transferred to DR,  , where 0 ≤ ε ≤ 1/2. In the two extreme cases, ε = 0 corresponds to the standard ΛCDM case with no DM decay and ε = 1/2 to the ΛDDM1 case. The values in between correspond to the ΛDDM2 case. Abellán et al. (2021) introduced a new approximation scheme that allows one to accurately and quickly compute the dynamics of the WDM linear perturbations by treating the WDM species as a viscous fluid and included the background evolution of WDM and, in particular, density perturbations, which were not included in previous studies (Vattis et al. 2019; Haridasu & Viel 2020; Clark et al. 2021). In our analyses, we use the DDM model including this new scheme.
In the ΛDDM1 model (DM → DR), the DM decay reduces the matter content in the Universe, causing a reduction in the expansion rate compared to the ΛCDM model, as shown in Fig. 1 of G21. This reduces the growth of matter-density fluctuations at small scales compared to the ΛCDM model, as shown in Fig. 4 of G21. The amount of matter power suppression increases as the DM lifetime becomes shorter.
In the ΛDDM2 model (DM → WDM+DR), the WDM component partially contributes to the matter density, leaving the expansion rate almost unchanged compared to the ΛCDM model, as shown in Fig. 1 of G21. However, as in the ΛDDM1 model, this component suppresses the growth of matter-density fluctuations due to the free-streaming of WDM at small scales compared to the ΛCDM case, as shown in Fig. 4 of G21. Also similarly to the ΛDDM1 model, the amount of matter power suppression increases as the DM lifetime becomes shorter, and the scale of the power suppression is determined by the free-streaming length of WDM, similarly to that induced by massive neutrinos.
In order to include these DDM models in the model of SZ power spectrum, we modified the comoving volume, HMF, and the pressure profile of the halo in Eq. (4). First, the comoving volume at a given redshift depends on the background evolution of assumed cosmological models, and the model including the DDM can be directly computed with G21.
Second, we consider the modification of the HMF. The theoretical prescription of the SZ power spectrum, including the DDM model, was studied in Takahashi et al. (2004). The authors included the impact of DDM on the HMF by modifying the Press–Schechter formalism (Press & Schechter 1974). We instead use the HMF from Tinker et al. (2008) but replace the matter power spectrum in Eq. (8) and ρm, 0 in Eq. (6) with ones including the DDM model. The HMF in the ΛDDM1 model was tested using N-body simulations in Enqvist et al. (2020, E20). E20 checked the deviation between their HMF in the ΛDDM1 model and the Tinker HMF form in the PlanckΛCDM model and provided its fitting formula with an accuracy of ∼20% for halos with 1014 − 1015 h−1 M⊙ at 0 < z < 1. We checked our modified Tinker HMF in the ΛDDM1 model by comparing with the results of E20. Our HMF shows a similar trend to that found by E20: the relative discrepancy between the HMFs in the ΛDDM1 and ΛCDM models increases as the halo mass increases and the rate of DDM increases (or the DDM lifetime decreases). In addition, we find that our modified HMF is consistent with that of E20 to within ∼5% below 1014 h−1 M⊙ and to within ∼16% in the range of 1014 − 1015 h−1 M⊙ around our best-fit value of Γ−1 ∼ 220 Gyr, which is within the accuracy of the HMF of E20. With the ΛDDM2 model, a similar result using numerical simulations has not yet been published; however, our best-fit value of ε is small, namely of ∼0.002, as shown later in Table 2 and the impact of the ε parameter on the SZ power spectrum is minor, as shown in Fig. 3. Therefore, our modified HMF in the ΛDDM2 model would have a similar accuracy to the one in the case of the ΛDDM1 model.
Third, we consider the modification of the pressure profile of the halo. Currently, the model of this pressure profile is constrained by the pressure measurements in galaxy clusters with X-ray or the SZ effect. For example, in Planck Collaboration V (2013) and Pointecouteau et al. (2021), the SZ profiles of galaxy clusters were stacked and fitted with the gNFW model with five parameters in Eq. (9). We include the impact from the DDM model on the pressure profile model in Planck Collaboration V (2013) by modifying the time evolution in Eq. (11) and replacing the H(z) with the one including the DDM model. The pressure profile of the halo is also given as a function of mass, and this relation might be modified when the DDM model is included. However, we assume that this is not the case. This assumption would not be valid if the DM decay were to depend its density, but the DDM model we consider here does not have such a dependency.
The SZ power spectra, including these modifications, are shown in Fig. 1 for the ΛDDM1 model with different decay lifetimes of Γ−1 = 30, 100, and 300 Gyr, which are compared with the ΛCDM model with stable CDM under the Planck 2018 cosmology of Table 1 in Planck Collaboration VI (2020). As expected, the DM lifetime Γ−1 determines the depth of the suppression, and the amount of power suppression increases for smaller lifetimes.
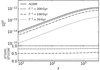 |
Fig. 1. SZ power spectra with the ΛDDM1 model (DM → DR) with different decay lifetimes of Γ−1 = 30 (dotted line), 100 (dash-dot line), and 300 (dashed line) Gyr. “ΛCDM” represents the ΛCDM model with stable cold dark matter (solid line). Here, the Planck 2018 cosmological parameters are assumed in all cases. |
We also show the SZ power spectra for the ΛDDM2 model in Fig. 2 with different decay lifetimes of Γ−1 = 30, 100, and 300 Gyr and also with different mass-energy fractions transferred to DR with ε = 0.1 and 0.01. As in the case of the DDM1 model, the lifetime Γ−1 determines the depth of the suppression, which increases for smaller lifetimes. Here, ε determines the free-streaming scale of WDM and the suppression scale of the matter power spectrum, reducing the number of halos in the HMF. Because this reduction is more dramatic for massive halos, the SZ power spectrum is more suppressed at large scales, as shown in Fig. 3.
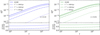 |
Fig. 2. SZ power spectra with the ΛDDM2 model (DM → WDM+DR) with different decay lifetimes of Γ−1 = 30 (dotted line), 100 (dash-dot line), and 300 (dashed line) Gyr. “ΛCDM” represents the ΛCDM model with stable cold dark matter (solid line). The mass-energy fractions transferred to DR are ε = 0.1 (blue) in the left panel and 0.01 (green) in the right panel. Here, the Planck 2018 cosmological parameters are assumed in all cases. |
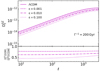 |
Fig. 3. SZ power spectra with the ΛDDM2 model (DM → WDM+DR) for the lifetime of Γ−1 = 200 Gyr with different values of ε, namely, ε = 0.1 (dotted line), 0.01 (dash-dot line), and 0.001 (dashed line). “ΛCDM” represents the ΛCDM model with stable cold dark matter (solid line). Here, the Planck 2018 cosmological parameters are assumed in all cases. |
2.6. Emulator of SZ power spectrum
We compute the  in our cosmological analysis with the Monte Carlo Markov chain (MCMC) in Sect. 3.2, and therefore the
  computation time has to be minimized. To achieve this, we adopted the machine learning technique that uses the Random Forest algorithm developed2 by Douspis et al. (2022) and used in Gorce et al. (2022), and modified it to build an emulator adapted to the DDM models. We built about 50 000 SZ power spectra with a random sampling of cosmological parameters within the ranges listed in Table 1 at 50 different multipoles between 2 and 3072 and used 60%, 20%, and 20% of the sample for the training, validation, and test, respectively. We optimized the hyperparameters of the Random Forest, such as numbers of trees and depths to be 40 and 30, respectively, to maximize the final score of the prediction. This resulted in the accuracy of the constructed model being better than 1% in our analysis range of 60 < ℓ < 1411, which is well below the uncertainty in the current SZ measurement of ∼30% used in our analysis.
Sampling parameters and priors.
3. Cosmological analysis
We use the measurement of the SZ angular power spectrum in T22 to explain the S8 tension and constrain the DDM model. In our cosmological analyses, this SZ measurement is also combined with other low-redshift probes of BAO+SNIa. These measurements are compared to the theoretical prescription with the DDM model described in Sect. 2.
3.1. Compton y-map
A new all-sky y map was reconstructed in T22 from the Planck 2020 data release 4 (Planck Collaboration Int. LVII 2020)3 in HEALpix4 format (Górski et al. 2005) with a pixel resolution of Nside = 2048 (∼1.7 arcmin). The reconstruction was performed based on the modified internal linear combination algorithm (MILCA; Hurier et al. 2013 by combining six Planck HFI frequency maps between 100 and 857 GHz so that the spectral response of the Compton y parameter is unity.
We use sky masks suitable for the analysis of the y maps provided in the 2015 Planck data release (Planck Collaboration XXII 2016). These masks cover point sources and regions around the Galactic plane, excluding about 58% of the sky. However, the residual extragalactic foreground emissions may remain in the y map. We therefore model them including radio and infrared (IR) point sources with the Planck sky model (Delabrouille et al. 2013) and cosmic infrared background (CIB) fluctuations from Maniyar et al. (2021).
Our cosmological analysis uses two y-maps reconstructed from the first and last half-ring Planck frequency maps and computes their cross-power spectrum to avoid the bias induced by the noise in the auto-power spectrum. We also limit our analysis to the multipole range of 60 < ℓ in order to minimize the contribution from the foreground and to ℓ < 1411 in order to minimize the contribution from the noise.
3.2. Maximum likelihood analysis
Cosmological constraints can be obtained by fitting the SZ power spectrum measurement with the SZ and foreground models simultaneously. In our model, we consider four components: SZ, CIB, radio point sources, and IR point sources. We also include an instrumental noise, CN, in the model. Finally, the observed SZ power spectrum,  , is modeled by
 (13)
(13)
where  is the SZ power spectrum, Θ is the set of free cosmological parameters shown below in Eq. (14), l − b is the hydrostatic mass bias,
  is the CIB power spectrum,
  and
and  are the IR and radio source power spectra, and
  is the empirical model for the instrumental noise. For the cosmological parameters, we vary
 (14)
(14)
in the ΛDDM1 model and
 (15)
(15)
in the ΛDDM2 model, where Ωbh2 is the baryon density, ln(1010As) is the primordial density perturbation amplitude, ns is the primordial density perturbation spectral index, τreio is the Reionization optical depth, H0 is the Hubble constant,  is the initial matter density of decaying dark matter, log10Γ is the decay rate in logarithmic scale, and log10ε is the fractional mass energy transferred to DR in logarithmic scale.
We performed the MCMC likelihood analysis using the MONTEPYTHON-v3 (Audren et al. 2013; Brinckmann & Lesgourgues 2019). We first performed the cosmological analysis only with the high-redshift Planck CMB data from high-ℓ TT,TE,EE lite and low-ℓ TT, EE (Planck Collaboration VI 2020) under the ΛDDM1 and ΛDDM2 models, respectively, without the low-redshift data of the SZ, BAO, and SNIa. We then combined the CMB data with the low-redshift probes and compared the results. We used flat priors for the cosmological parameters and Gaussian priors for nuisance parameters. The sampling parameters and priors used in our cosmological analysis are summarized in Table 1.
3.3. Results
Figure 4 shows the result of our cosmological analysis with the ΛDDM1 model. In this model, DM decays into DR and Ωm decreases compared to that in the ΛCDM. Therefore, the lower S8 value is mainly induced by the lower value of Ωm, and not by that of σ8, as shown in Fig. 4. This figure shows the posterior distributions of the cosmological parameters, log10Γ, S8, σ8, and Ωm with 68% and 95% confidence interval contours when only the Planck CMB data are used (gray) and the Planck CMB data are combined with the BAO + SNIa + SZ (red). The posterior distributions of other cosmological parameters are summarized in Table 2 with 68% confidence interval, and we find that they are consistent between the two cases.
Best cosmological parameter estimates under the ΛDDM1 and ΛDDM2 models using the Planck CMB data without or with SZ data.
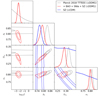 |
Fig. 4. Posterior distributions of the cosmological parameters under the ΛDDM1 model, log10Γ, S8, σ8, and Ωm with 68% and 95% confidence interval contours obtained from our cosmological analysis, when only the Planck CMB data are used (gray) and the Planck CMB data are combined with the BAO + SNIa + SZ data (red). The latest result with the SZ power spectrum from T22 is shown in blue. We note that only Ωm and σ8 parameters are varied in T22, while the six ΛCDM cosmological parameters are varied in our analysis as shown in Table 1. |
The CMB data can constrain the DDM model through the integrated Sachs-Wolfe (ISW) effect and the lensing of the CMB as shown in Figs. 5 and 13 in Aoyama et al. (2014) and put a tight constraint of Γ−1 > 160 Gyr on the ΛDDM1 model (e.g., Audren et al. 2014; Enqvist et al. 2015, 2020; Poulin et al. 2016). In our analysis, a combination of the high-redshift CMB data and low-redshift BAO + SNIa + SZ data provides the best-fit value on the DM decay lifetime of
![Mathematical equation: $$ \begin{aligned} \Gamma ^{-1} = 220.5_{-91.5}^{+155.8} \; \mathrm{[Gyr]} \quad (\mathrm{\Lambda DDM1}) , \end{aligned} $$](/articles/aa/full_html/2023/06/aa45882-23/aa45882-23-eq58.gif) (16)
(16)
showing that the value of Γ−1 ∼ 220 Gyr is better able to resolve the S8 tension between the Planck CMB measurement and the SZ measurement. Given the uncertainty on our measurement, we also constrained a lower bound on the DM decay lifetime of ∼38 Gyr at 95% confidence level but did not obtain a tighter constraint than that based on the CMB data.
Figure 5 shows the result of our cosmological analysis with the ΛDDM2 model. In this model, DM decays into WDM, but Ωm does not decrease unlike the case in the ΛDDM1 model. (We note that the scale ranges of Ωm and σ8 are the same in Figs. 4 and 5.) Rather, the σ8 is lowered by the matter power suppression at small scales because of the free-streaming length of WDM, which is similar to that caused by massive neutrinos. The lower S8 value is therefore mainly a result of the lower value of σ8, and not of the lower value of Ωm, as shown in Fig. 5. This figure shows the posterior distributions of the cosmological parameters log10Γ, S8, log10ε, σ8, and Ωm with 68% and 95% confidence interval contours when only the Planck CMB data are used (gray) and the Planck CMB data are combined with the BAO + SNIa+ SZ data (red). The posterior distributions of other cosmological parameters are summarized in Table 2 with 68% confidence interval, and we find that they are consistent between the two cases.
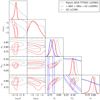 |
Fig. 5. Posterior distributions of the cosmological parameters under the ΛDDM2 model, log10Γ, log10ε, S8, σ8, and Ωm with 68% and 95% confidence interval contours obtained from our cosmological analysis, when only the Planck CMB data are used (gray) and the Planck CMB data are combined with the BAO + SNIa + SZ data (red). The latest result with the SZ power spectrum from T22 is shown in blue. We note that only Ωm and σ8 parameters are varied in T22, while the six ΛCDM cosmological parameters are varied in our analysis as shown in Table. 1. |
Similarly to the case with the ΛDDM1 model, a combination of the high-redshift CMB data and low-redshift BAO+SNIa+SZ data provides the best-fit value on the DM decay lifetime of
![Mathematical equation: $$ \begin{aligned} \Gamma ^{-1} = 137.3_{-56.6}^{+176.8} \, \mathrm{[Gyr]} \quad (\mathrm{\Lambda DDM2}), \end{aligned} $$](/articles/aa/full_html/2023/06/aa45882-23/aa45882-23-eq59.gif) (17)
(17)
which gives a lower bound on the decay lifetime of DM of ∼24 Gyr at 95% confidence level.
In summary, we find that both models give lower S8 values than the value from the Planck CMB measurement and reconcile the S8 tension. Therefore, both models may provide a solution for the tension. We also compare the best-fit χ2 values in our cosmological analyses. These are 1021.94 and 1020.67 with the ΛDDM1 and ΛDDM2 models, respectively, and we find a slight preference for the ΛDDM2 model compared to the ΛDDM1 model.
However, one of the DDM parameters, ε, is not well constrained in our analysis. To constrain this parameter, precise measurements of the shape of the SZ power spectrum are required as shown in Fig. 3. However, the uncertainty in the current SZ measurement is ∼30%, which prevents us from determining the value of this parameter. For this purpose, more sensitive data at small scales will be useful, such as those provided by AdvACT Henderson et al. (2016) and SPT-3G Benson et al. (2014) and the upcoming Simons Observatory Ade et al. (2019) and CMB-S4 Abazajian et al. (2019).
3.4. Systematic effects
Finally, we consider systematic uncertainties in our analysis. As discussed in Planck Collaboration XXII (2016) and T22, the mass bias and the pressure profile model are not well constrained, which affects the cosmological analysis with the SZ power spectrum. We summarize the results in Tables 3 and 4 for the ΛDDM1 and ΛDDM2 models.
Γ−1 constraints obtained with different mass bias priors and pressure profile models under ΛDDM1.
Γ−1 constraints obtained with different mass bias priors and pressure profile models under ΛDDM2.
First, in order to investigate the impact on our DDM constraints from the mass bias, we replaced the mass bias prior on the CCCP with two others: one from the “weighting the giants” weak lensing measurements (von der Linden et al. 2014; WtG) and the other from cosmological hydrodynamical simulations (Biffi et al. 2016; BIFFI). Table 3 shows a comparison of the effects of these two mass bias priors on Γ−1 and its lower bound at 95% confidence level. The result shows that the Γ−1 value increases as the mass bias increases (or 1 − b decreases). The reason is that the amplitude of the SZ power spectrum model shifts downwards when the mass bias increases, as in Eq. (11), which reduces the S8 discrepancy between the Planck CMB and SZ results and thus requires a smaller amount of DDM or, in other words, a longer decay lifetime.
In addition, we investigated the impact of the pressure profile model on our DDM constraints by replacing P13 with two other models: one based on the combination of XMM-Newton measurements and numerical simulations (Arnaud et al. 2010; A10) and the other based on the analysis with combined data from Planck and ACT (Pointecouteau et al. 2021; PACT21). Table 3 shows a comparison of the effects of these models on Γ−1 and its lower band at 95% confidence level. The result shows that the Γ−1 value of PACT21 is higher than the others. The reason is that the amplitude of the PACT21 pressure profile is slightly lower than the others, as shown in Fig. 5 of Pointecouteau et al. (2021). This shifts the amplitude of the SZ power spectrum model downwards, reduces the S8 discrepancy between the Planck CMB and SZ results, and requires less DDM.
4. Summary and conclusion
To solve the S8 tension between the Planck CMB measurement and low-redshift probes, we extend the ΛCDM model, including a decaying dark matter (DDM) model. Two DDM models are tested in our study: one DDM model (ΛDDM1) where DM decays into a form of noninteracting dark radiation (DR), which is parameterized with the decay rate, Γ, and another model (ΛDDM2), where the DM decays into warm dark matter (WDM) and DR, which is parameterized with the decay rate, Γ, and the mass-energy fraction transferred to the massless component, ε. For the low-redshift probe, we use the Sunyaev Zel’dovich effect and compute the impact of DDM on the SZ power spectrum by varying the DDM parameters, including the background evolution in cosmology and nonlinear prescription in the halo mass function. The result shows the suppression of the SZ power spectrum relative to the ΛCDM model due to DDM. As one expects, the suppression becomes more remarkable as the decay time becomes shorter. We combine this SZ data with other low-redshift probes, namely BAO+SNIa, which constrain the expansion history of the Universe.
We performed a cosmological analysis and compared the results when only the Planck CMB data are used and when the Planck CMB data are combined with the BAO, SNIa, and SZ data from T22. Under the ΛDDM1 model, the result shows a preference for 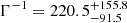 Gyr to resolve the tension between the Planck CMB and SZ measurements on the S8 parameter, in agreement with literature supporting Γ−1 > 160 Gyr. Given the uncertainty on our measurement, we also set a lower bound on the DM decay lifetime of ∼38 Gyr at 95% confidence level. We also performed a cosmological analysis under the ΛDDM2 model using the Planck CMB and BAO+SNIa+SZ measurements. The result shows a preference for
 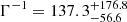 Gyr to resolve the S8 tension. This result provides a lower bound on the DM decay lifetime of ∼24 Gyr at 95% confidence level. As a result, both models give lower S8 values than the value from the Planck CMB measurement and reconcile the S8 tension. Thus, both models may provide a solution for the tension. In addition, we compared the best-fit χ2 values in these cosmological analyses and find a slight preference for the ΛDDM2 model compared to the ΛDDM1 model.
We also checked the systematic uncertainty in our analysis with the SZ power spectrum, which includes the impact of the mass bias and pressure profile model. The lower bound changes depending on the choice of these models. This indicates that the DDM model can only be more accurately constrained if the systematic uncertainties originating from the internal structures in galaxy clusters – such as contributions of nonthermal pressure and baryonic feedback effects – are well understood and modeled.
Finally, current studies based on weak lensing and galaxy clustering as low-redshift probes indicate that a lower S8 value may be caused by a lower σ8, and not a lower Ωm (Di Valentino et al. 2021). To investigate this using the SZ signal, additional high-resolution and high-sensitivity data will be needed, such as those of AdvACT and SPT-3G and the upcoming Simons Observatory and CMB-S4.
and distributed at https://sz-power-spectra.osups.universite-paris-saclay.fr/
Acknowledgments
This research has been supported by the funding for the Baryon Picture of the Cosmos (ByoPiC) project from the European Research Council (ERC) under the European Union’s Horizon 2020 research and innovation programme grant agreement ERC-2015-AdG 695561. The authors acknowledge fruitful discussions with the members of the ByoPiC project (https://byopic.eu/team). This work is supported by World Premier International Research Center Initiative (WPI), MEXT, Japan. Kavli IPMU was established by World Premier International Research Center Initiative (WPI), MEXT, Japan. Kavli IPMU is supported by World Premier International Research Center Initiative (WPI), MEXT, Japan.
References
- Abazajian, K., Addison, G., Adshead, P., et al. 2019, arXiv e-prints [arXiv:1907.04473] [Google Scholar]
- Abbott, T. M. C., Abdalla, F. B., Alarcon, A., et al. 2018, Phys. Rev. D, 98, 043526 [NASA ADS] [CrossRef] [Google Scholar]
- Abellán, G. F., Murgia, R., & Poulin, V. 2021, Phys. Rev. D, 104, 123533 [CrossRef] [Google Scholar]
- Abellán, G. F., Murgia, R., Poulin, V., & Lavalle, J. 2022, Phys. Rev. D, 105, 063525 [CrossRef] [Google Scholar]
- Ade, P., Aguirre, J., Ahmed, Z., et al. 2019, J. Cosmol. Astropart. Phys., 2019, 056 [Google Scholar]
- Alam, S., Ata, M., Bailey, S., et al. 2017, MNRAS, 470, 2617 [Google Scholar]
- Aoyama, S., Sekiguchi, T., Ichiki, K., & Sugiyama, N. 2014, J. Cosmol. Astropart. Phys., 2014, 021 [CrossRef] [Google Scholar]
- Arnaud, M., Pratt, G. W., Piffaretti, R., et al. 2010, A&A, 517, A92 [CrossRef] [EDP Sciences] [Google Scholar]
- Audren, B., Lesgourgues, J., Benabed, K., & Prunet, S. 2013, J. Cosmol. Astropart. Phys., 2013, 001 [NASA ADS] [CrossRef] [Google Scholar]
- Audren, B., Lesgourgues, J., Mangano, G., Serpico, P. D., & Tram, T. 2014, J. Cosmol. Astropart. Phys., 2014, 028 [CrossRef] [Google Scholar]
- Benson, B. A., Ade, P. A. R., Ahmed, Z., et al. 2014, in Millimeter, Submillimeter, and Far-Infrared Detectors and Instrumentation for Astronomy VII, eds. W. S. Holland, & J. Zmuidzinas, SPIE Conf. Ser., 9153, 91531P [NASA ADS] [CrossRef] [Google Scholar]
- Beutler, F., Blake, C., Colless, M., et al. 2011, MNRAS, 416, 3017 [NASA ADS] [CrossRef] [Google Scholar]
- Biffi, V., Borgani, S., Murante, G., et al. 2016, ApJ, 827, 112 [NASA ADS] [CrossRef] [Google Scholar]
- Blas, D., Lesgourgues, J., & Tram, T. 2011, J. Cosmol. Astropart. Phys., 2011, 034 [CrossRef] [Google Scholar]
- Blomqvist, M., du Mas des Bourboux, H., Busca, N. G., et al. 2019, A&A, 629, A86 [NASA ADS] [CrossRef] [EDP Sciences] [Google Scholar]
- Bolliet, B., Comis, B., Komatsu, E., & Macías-Pérez, J. F. 2018, MNRAS, 477, 4957 [NASA ADS] [CrossRef] [Google Scholar]
- Brinckmann, T., & Lesgourgues, J. 2019, Phys. Dark Univ., 24 [Google Scholar]
- Bucko, J., Giri, S. K., & Schneider, A. 2023, A&A, 672, A157 [NASA ADS] [CrossRef] [EDP Sciences] [Google Scholar]
- Chen, A., Huterer, D., Lee, S., et al. 2021, Phys. Rev. D, 103, 123528P [CrossRef] [Google Scholar]
- Clark, S. J., Vattis, K., & Koushiappas, S. M. 2021, Phys. Rev. D, 103, 043014P [CrossRef] [Google Scholar]
- Cooray, A., & Sheth, R. 2002, Phys. Rep., 372, 1 [Google Scholar]
- de Sainte Agathe, V., Balland, C., du Mas des Bourboux, H., et al. 2019, A&A, 629, A85 [NASA ADS] [CrossRef] [EDP Sciences] [Google Scholar]
- Delabrouille, J., Betoule, M., Melin, J. B., et al. 2013, A&A, 553, A96 [NASA ADS] [CrossRef] [EDP Sciences] [Google Scholar]
- DES Collaboration 2022, Phys. Rev. D, 105, 023520P [Google Scholar]
- Di Valentino, E., Melchiorri, A., Mena, O., & Vagnozzi, S. 2020a, Phys. Dark Univ., 30, 100666 [NASA ADS] [CrossRef] [Google Scholar]
- Di Valentino, E., Melchiorri, A., Mena, O., & Vagnozzi, S. 2020b, Phys. Rev. D, 101, 063502 [Google Scholar]
- Di Valentino, E., Anchordoqui, L. A., Akarsu, Ö., et al. 2021, Astropart. Phys., 131, 102604 [NASA ADS] [CrossRef] [Google Scholar]
- Doroshkevich, A. G., Khlopov, M. I., & Klypin, A. A. 1989, MNRAS, 239, 923 [NASA ADS] [CrossRef] [Google Scholar]
- Douspis, M., Salvati, L., Gorce, A., & Aghanim, N. 2022, A&A, 659, A99 [NASA ADS] [CrossRef] [EDP Sciences] [Google Scholar]
- Enqvist, K., Nadathur, S., Sekiguchi, T., & Takahashi, T. 2015, J. Cosmol. Astropart. Phys., 2015, 067 [CrossRef] [Google Scholar]
- Enqvist, K., Nadathur, S., Sekiguchi, T., & Takahashi, T. 2020, J. Cosmol. Astropart. Phys., 2020, 015 [CrossRef] [Google Scholar]
- Fuß, L., & Garny, M. 2022, arXiv e-prints [arXiv:2210.06117] [Google Scholar]
- Gianfagna, G., De Petris, M., Yepes, G., et al. 2021, MNRAS, 502, 5115 [NASA ADS] [CrossRef] [Google Scholar]
- Gorce, A., Douspis, M., & Salvati, L. 2022, A&A, 662, A122 [NASA ADS] [CrossRef] [EDP Sciences] [Google Scholar]
- Górski, K. M., Hivon, E., Banday, A. J., et al. 2005, ApJ, 622, 759 [Google Scholar]
- Haridasu, B. S., & Viel, M. 2020, MNRAS, 497, 1757 [NASA ADS] [CrossRef] [Google Scholar]
- Henderson, S. W., Allison, R., Austermann, J., et al. 2016, J. Low Temperat. Phys., 184, 772 [NASA ADS] [CrossRef] [Google Scholar]
- Heymans, C., Tröster, T., Asgari, M., et al. 2021, A&A, 646, A140 [NASA ADS] [CrossRef] [EDP Sciences] [Google Scholar]
- Hoekstra, H., Herbonnet, R., Muzzin, A., et al. 2015, MNRAS, 449, 685 [NASA ADS] [CrossRef] [Google Scholar]
- Holm, E. B., Herold, L., Hannestad, S., Nygaard, A., & Tram, T. 2023, Phys. Rev. D, 107, L021303 [NASA ADS] [CrossRef] [Google Scholar]
- Hubert, J., Schneider, A., Potter, D., Stadel, J., & Giri, S. K. 2021, J. Cosmol. Astropart. Phys., 2021, 040 [CrossRef] [Google Scholar]
- Hurier, G., Macías-Pérez, J. F., & Hildebrandt, S. 2013, A&A, 558, A118 [NASA ADS] [CrossRef] [EDP Sciences] [Google Scholar]
- Ilić, S., Sakr, Z., & Blanchard, A. 2019, A&A, 631, A96 [NASA ADS] [CrossRef] [EDP Sciences] [Google Scholar]
- Joudaki, S., Hildebrandt, H., Traykova, D., et al. 2020, A&A, 638, L1 [NASA ADS] [CrossRef] [EDP Sciences] [Google Scholar]
- Komatsu, E., & Kitayama, T. 1999, ApJ, 526, L1 [NASA ADS] [CrossRef] [Google Scholar]
- Komatsu, E., Kitayama, T., Refregier, A., Spergel, D. N., & Pen, U. L. 2002, in The Ninth Marcel Grossmann Meeting, eds. V. G. Gurzadyan, R. T. Jantzen, & R. Ruffini, 2189 [CrossRef] [Google Scholar]
- Lambiase, G., Mohanty, S., Narang, A., & Parashari, P. 2019, Eur. Phys. J. C, 79, 141 [NASA ADS] [CrossRef] [Google Scholar]
- Lesgourgues, J., & Tram, T. 2011, J. Cosmol. Astropart. Phys., 2011, 032 [CrossRef] [Google Scholar]
- Maniyar, A., Béthermin, M., & Lagache, G. 2021, A&A, 645, A40 [NASA ADS] [CrossRef] [EDP Sciences] [Google Scholar]
- Mau, S., Nadler, E. O., Wechsler, R. H., et al. 2022, ApJ, 932, 128 [NASA ADS] [CrossRef] [Google Scholar]
- McCarthy, F., & Hill, J. C. 2022, arXiv e-prints [arXiv:2210.14339] [Google Scholar]
- Nagai, D., Kravtsov, A. V., & Vikhlinin, A. 2007, ApJ, 668, 1 [Google Scholar]
- Navarro, J. F., Frenk, C. S., & White, S. D. M. 1997, ApJ, 490, 493 [Google Scholar]
- Nunes, R. C., & Vagnozzi, S. 2021, MNRAS, 505, 5427 [NASA ADS] [CrossRef] [Google Scholar]
- Planck Collaboration V. 2013, A&A, 550, A131 [NASA ADS] [CrossRef] [EDP Sciences] [Google Scholar]
- Planck Collaboration XX. 2014, A&A, 571, A20 [NASA ADS] [CrossRef] [EDP Sciences] [Google Scholar]
- Planck Collaboration XXII. 2016, A&A, 594, A22 [NASA ADS] [CrossRef] [EDP Sciences] [Google Scholar]
- Planck Collaboration XXIV. 2016, A&A, 594, A24 [NASA ADS] [CrossRef] [EDP Sciences] [Google Scholar]
- Planck Collaboration VI. 2020, A&A, 641, A6 [NASA ADS] [CrossRef] [EDP Sciences] [Google Scholar]
- Planck Collaboration Int. LVII. 2020, A&A, 643, A42 [NASA ADS] [CrossRef] [EDP Sciences] [Google Scholar]
- Pointecouteau, E., Santiago-Bautista, I., Douspis, M., et al. 2021, A&A, 651, A73 [NASA ADS] [CrossRef] [EDP Sciences] [Google Scholar]
- Poulin, V., Serpico, P. D., & Lesgourgues, J. 2016, J. Cosmol. Astropart. Phys., 2016, 036 [CrossRef] [Google Scholar]
- Press, W. H., & Schechter, P. 1974, ApJ, 187, 425 [Google Scholar]
- Ross, A. J., Samushia, L., Howlett, C., et al. 2015, MNRAS, 449, 835 [NASA ADS] [CrossRef] [Google Scholar]
- Salvati, L., Douspis, M., & Aghanim, N. 2018, A&A, 614, A13 [NASA ADS] [CrossRef] [EDP Sciences] [Google Scholar]
- Scolnic, D. M., Jones, D. O., Rest, A., et al. 2018, ApJ, 859, 101 [NASA ADS] [CrossRef] [Google Scholar]
- Simon, T., Abellán, G. F., Du, P., Poulin, V., & Tsai, Y. 2022, Phys. Rev. D, 106, 023516 [NASA ADS] [CrossRef] [Google Scholar]
- Sunyaev, R. A., & Zeldovich, Y. B. 1970, Ap&SS, 7, 3 [NASA ADS] [Google Scholar]
- Sunyaev, R. A., & Zeldovich, Y. B. 1972, Comments Astrophys. Space Phys., 4, 173 [NASA ADS] [EDP Sciences] [Google Scholar]
- Takahashi, K., Oguri, M., & Ichiki, K. 2004, MNRAS, 352, 311 [NASA ADS] [CrossRef] [Google Scholar]
- Tanimura, H., Douspis, M., Aghanim, N., & Salvati, L. 2022, MNRAS, 509, 300 [Google Scholar]
- Tinker, J., Kravtsov, A. V., Klypin, A., et al. 2008, ApJ, 688, 709 [Google Scholar]
- Tröster, T., Asgari, M., Blake, C., et al. 2021, A&A, 649, A88 [NASA ADS] [CrossRef] [EDP Sciences] [Google Scholar]
- Vattis, K., Koushiappas, S. M., & Loeb, A. 2019, Phys. Rev. D, 99, 121302 [NASA ADS] [CrossRef] [Google Scholar]
- von der Linden, A., Mantz, A., Allen, S. W., et al. 2014, MNRAS, 443, 1973 [NASA ADS] [CrossRef] [Google Scholar]
- Xiao, L., Zhang, L., An, R., Feng, C., & Wang, B. 2020, J. Cosmology Astropart. Phys., 2020, 045 [CrossRef] [Google Scholar]
All Tables
Best cosmological parameter estimates under the ΛDDM1 and ΛDDM2 models using the Planck CMB data without or with SZ data.
Γ−1 constraints obtained with different mass bias priors and pressure profile models under ΛDDM1.
Γ−1 constraints obtained with different mass bias priors and pressure profile models under ΛDDM2.
All Figures
|
Fig. 1. SZ power spectra with the ΛDDM1 model (DM → DR) with different decay lifetimes of Γ−1 = 30 (dotted line), 100 (dash-dot line), and 300 (dashed line) Gyr. “ΛCDM” represents the ΛCDM model with stable cold dark matter (solid line). Here, the Planck 2018 cosmological parameters are assumed in all cases. |
| In the text | |
|
Fig. 2. SZ power spectra with the ΛDDM2 model (DM → WDM+DR) with different decay lifetimes of Γ−1 = 30 (dotted line), 100 (dash-dot line), and 300 (dashed line) Gyr. “ΛCDM” represents the ΛCDM model with stable cold dark matter (solid line). The mass-energy fractions transferred to DR are ε = 0.1 (blue) in the left panel and 0.01 (green) in the right panel. Here, the Planck 2018 cosmological parameters are assumed in all cases. |
| In the text | |
|
Fig. 3. SZ power spectra with the ΛDDM2 model (DM → WDM+DR) for the lifetime of Γ−1 = 200 Gyr with different values of ε, namely, ε = 0.1 (dotted line), 0.01 (dash-dot line), and 0.001 (dashed line). “ΛCDM” represents the ΛCDM model with stable cold dark matter (solid line). Here, the Planck 2018 cosmological parameters are assumed in all cases. |
| In the text | |
|
Fig. 4. Posterior distributions of the cosmological parameters under the ΛDDM1 model, log10Γ, S8, σ8, and Ωm with 68% and 95% confidence interval contours obtained from our cosmological analysis, when only the Planck CMB data are used (gray) and the Planck CMB data are combined with the BAO + SNIa + SZ data (red). The latest result with the SZ power spectrum from T22 is shown in blue. We note that only Ωm and σ8 parameters are varied in T22, while the six ΛCDM cosmological parameters are varied in our analysis as shown in Table 1. |
| In the text | |
|
Fig. 5. Posterior distributions of the cosmological parameters under the ΛDDM2 model, log10Γ, log10ε, S8, σ8, and Ωm with 68% and 95% confidence interval contours obtained from our cosmological analysis, when only the Planck CMB data are used (gray) and the Planck CMB data are combined with the BAO + SNIa + SZ data (red). The latest result with the SZ power spectrum from T22 is shown in blue. We note that only Ωm and σ8 parameters are varied in T22, while the six ΛCDM cosmological parameters are varied in our analysis as shown in Table. 1. |
| In the text | |
Current usage metrics show cumulative count of Article Views (full-text article views including HTML views, PDF and ePub downloads, according to the available data) and Abstracts Views on Vision4Press platform.
Data correspond to usage on the plateform after 2015. The current usage metrics is available 48-96 hours after online publication and is updated daily on week days.
Initial download of the metrics may take a while.