| Issue |
A&A
Volume 673, May 2023
|
|
|---|---|---|
| Article Number | A99 | |
| Number of page(s) | 10 | |
| Section | Galactic structure, stellar clusters and populations | |
| DOI | https://doi.org/10.1051/0004-6361/202244548 | |
| Published online | 15 May 2023 | |
The Outer spiral arm of the Milky Way using red clump stars
Tracing the asymmetry across the disc
1
Physical Research Laboratory, Ahmedabad, 380009 Gujrat, India
e-mail: This email address is being protected from spambots. You need JavaScript enabled to view it.
; This email address is being protected from spambots. You need JavaScript enabled to view it.
2
Indian Institute of Technology, Gandhinagar, 382355 Gujrat, India
3
Université Côte d’Azur, Observatoire de la Côte d’Azur, CNRS, Laboratoire Lagrange, Bd de l’Observatoire, CS 34229, 06304 Nice Cedex 4, France
Received:
19
July
2022
Accepted:
13
March
2023
Abstract
Aims. Our aim is to provide an observational view of the old disc structure of the Milky Way galaxy using the distribution of red clump (RC) stars. The spiral arms, warp structure, and other asymmetries present in the disc are revisited using a systematic study of RC star counts over the disc of the Galaxy.
Methods. We developed a method for systematically extracting the RC stars from a 2MASS (J − Ks, J) colour-magnitude diagram of 1° ×1° bins in ℓ × b, covering the range 40° ≤ ℓ ≤ 320° and −10° ≤ b ≤ 10°. 2MASS data continue to be important because we are able to identify and trace the RC stars to much farther distances than in any optical survey of the Galactic disc. The foreground star contamination in the selected sample was removed using the accurate astrometric data from Gaia EDR3. We analysed the spiral arms and asymmetry in the Galaxy above and below the Galactic plane in galactocentric coordinates.
Results. We have generated a face-on-view (XY-plane) of the Galaxy depicting the density distribution and count ratio above and below the Galactic plane. The resulting over-density of RC stars traces the continuous morphology of the Outer arm from the second to the third Galactic quadrant. This is the first study to map the Outer arms across the disc using RC stars. Through this study, we are able to trace the Outer arm well into the third Galactic quadrant for the first time. In addition to the spiral structures, we also see a wave-like asymmetry above and below the Galactic plane with respect to longitudes, indicating the warp structure. The warp structure is studied systematically by tracing the ratio of RC stars above and below the Galactic plane. We provide the first direct observational evidence of the asymmetry in the outer spiral arms, confirming that the spiral arms traced by the older population are also warped, similar to the disc.
Key words: Galaxy: disk / Galaxy: structure / methods: data analysis / stars: statistics
© The Authors 2023
 Open Access article, published by EDP Sciences, under the terms of the Creative Commons Attribution License (https://creativecommons.org/licenses/by/4.0), which permits unrestricted use, distribution, and reproduction in any medium, provided the original work is properly cited.
This article is published in open access under the Subscribe to Open model. This email address is being protected from spambots. You need JavaScript enabled to view it. to support open access publication.
1. Introduction
Studying the Galactic structure is crucial for understanding the formation and evolution of the Milky Way galaxy. Our location within the disc makes it challenging to obtain a detailed picture of its structure. Interstellar dust and projection effects, as well as the multifaceted characteristics of the arms themselves, interfere with the determination of the spiral arm properties. Mapping 3D structures using star counts is widely used for this purpose (Paul 1993), and the importance of this tool has increased in past decades with the advent of wide-field surveys. In the past decade, many successful efforts have been dedicated to increasing the understanding of the structure, morphology, and dynamics of our Galaxy using different tracers (e.g., Hou & Han 2014; Nakanishi & Sofue 2016; Xu et al. 2018a; Reid et al. 2019; Skowron et al. 2019; Cantat-Gaudin et al. 2020; VERA Collaboration 2020; Castro-Ginard et al. 2021; Nogueras-Lara et al. 2021; Poggio et al. 2021). It is generally known that a global spiral pattern exists in the Milky Way disc (Shen & Zheng 2020, and references therein). However, the finer details of the spiral arms, that is, the number of spiral arms, their position, orientation, small-scale arm features, their thickness, and the formation mechanisms, are still topics of debate. Measuring precise distances is the key to resolving all problems. Recently, the Gaia space-based telescope (Gaia Collaboration 2016) has provided accurate parallax measurements for billions of stars. This database facilitates studies of the Milky Way Galaxy in 6D phase space to explore the structure and formation of our Galaxy. Xu et al. (2018a,b) have studied the Galactic spiral arm structure within 3 Kpc of the Sun using Gaia DR2 data (Gaia Collaboration 2018) of OB stars and up to 5 kpc using Gaia EDR3 (Gaia Collaboration 2021) data (Xu et al. 2021). However, due to limitations imposed by the uncertainty in parallax measurements, it is possible to study the structure of the Galaxy only in the vicinity of the Sun (Hou 2021). Therefore, it becomes difficult to study the complete morphology of the disc using Gaia data alone.
Various studies have made use of different tracers to study spiral arms. The older population primarily gives an indication of the outer arms (Benjamin et al. 2005; Churchwell et al. 2009; Skowron et al. 2019), while the inner arms are traced by gas, dust, young stars, open clusters, and star-forming regions (e.g., Hou 2021; Gaia Collaboration 2023). This discrepancy poses the question about the formation and evolution of the Milky Way disc. The age gradient across the spiral arms is also observed in external galaxies (e.g., Dobbs & Pringle 2010; Shu 2016; Shabani et al. 2018; Yu & Ho 2018; Peterken et al. 2019). In order to understand the formation mechanism completely, we should study the distribution of different age populations. Earlier results mainly focused on mapping the spiral structure using the younger population (Hou 2021, and references therein) with ages of a few million years, e.g., high-mass star-forming regions (HMSFR), O-B stars, upper main-sequence stars, and open clusters. The systematic study of a large number of older sources is required throughout the whole Galaxy.
In addition to the spiral features, the asymmetry in the disc structure due to the warping of the disc is also observed in various tracers (e.g., Kerr 1957; Henderson 1979; Drimmel & Spergel 2001; Nakanishi & Sofue 2003; López-Corredoira et al. 2002; Yusifov 2004; Marshall et al. 2006; Levine et al. 2006; Poggio et al. 2018; Chen et al. 2019; Chrobáková et al. 2022). However, the asymmetries in the spiral arms due to disc warping have not been studied so far.
In this paper, we present a systematic study to map the red clump (RC) stars over the whole Galactic plane, except for the bulge region, to trace the spiral arms and the asymmetry arising from the warp. The paper is organised as follows. The data used in our study to extract the RC sample are presented in Sect. 2. Section 3 describes the automatic selection procedure to isolate RC stars and the removal of contamination from the selected sample. Sample completeness with respect to other catalogues available in the literature and their distance comparison with our estimated values are discussed in Sect. 4. The results obtained by studying the distribution of the final RC star sample are discussed in Sect. 5. We summarise our study with a discussion and conclusions in Sect. 6.
2. Data
The Two Micron All Sky Survey (2MASS; Skrutskie et al. 2006) maps the entire sky in the near-infrared (NIR) wavebands J (1.25 μm), H (1.65 μm), and Ks (2.17 μm) using similar telescopes and detectors in northern (Mt. Hopkins, Arizona, USA) and southern (CTIO, Chile) hemispheres. The 3σ limiting magnitudes in J, H, and Ks bands are 17.1, 16.4 and 15.3 mag, respectively, with S/N = 10. We used best-quality 2MASS point source data (with qflag = AAA) in order to select RC stars in different lines of sight. Stars with a J magnitude brighter than 14.5 mag and a photometric uncertainty smaller than 0.1 mag (in J, H, and Ks) are considered in our analysis.
We also used data from the Gaia space-based telescope. Gaia early data release 3 (EDR3), (Gaia Collaboration 2021) includes data for the first 34 months of its operational phase. Gaia EDR3 contains information about 1.8 billion sources ranging from 3 to 21 G-band magnitude. This data release contains the full astrometric data (Lindegren et al. 2021) of 1.4 billion sources. We make use of the distance information of Gaia EDR3 stars (Bailer-Jones et al. 2021), and astrophysical parameters from Gaia data release 3 (DR3), (Andrae et al. 2023) to remove contamination by foreground and evolved stars.
3. RC sample selection
The RC stars are low-mass core-helium-burning stars with a narrow range of intrinsic luminosity and colour in this phase (Girardi 2016) of their evolution. This property makes them reliable distance indicators. The luminosity function derived in Hammersley et al. (1999) shows that at the peak of the red clump stars (K giants), there are about ten times more sources than stars either 0.8 mag brighter or fainter. Because they are a good distance indicator and are numerous in the Galaxy, they can be used to probe the structure of the intermediate-to-old Galactic disc. RC stars were selected by analysing 2MASS colour-magnitude diagrams (CMDs) constructed from 40° ≤ℓ≤320°, avoiding the bulge region and −10° ≤b ≤ 10° with 1deg2 binning, thus covering 5600 deg2 fields.
3.1. Extraction of candidate RC stars from 2MASS CMDs
We built 2MASS colour-magnitude diagrams (J − Ks, J) in a region of 1 deg2 around the central ℓ and b with boundaries of  and
and  . The majority of the stars lie on the main sequence or in giant phase in the CMDs. The most common types of giants are K giants; therefore, the redder dense region of the CMD corresponds to RC stars. The RC stars are distributed in the vertical and horizontal directions of the CMD by the effect of distance and extinction along the line of sight. Hence, instead of a clump, they appear as a band in the CMDs. The stars lying on the bluer side of the RC stars are predominantly foreground dwarf stars, and the redder regions contain M giant or AGB-type evolved stars at higher extinction and larger distance.
We made horizontal cuts in the CMD using adaptive binning in J magnitude (see the central panel in Fig. 1 for the 1 deg2 field centred at l = 45° and b = 5°). The RC locus (black points in Fig. 1) was traced by selecting the most probable values corresponding to a second peak in the colour (J − Ks) histogram of each J bin. Panels 1–10 of Fig. 1 show the density histograms of the corresponding J bin. The J − Ks colour corresponding to the second peak represents the RC locus point (black point in the central panel) in that bin. The spread in colour (orange points in the central panel of Fig. 1) around the central peak is determined from the standard deviation in the colour of all the stars present between low and high J − Ks colour cuts in each histogram. Low and high colours were calculated as
shift = colour corresponding to second maximum − colour at first minimum
low = locus point − shift
high = locus point + shift.
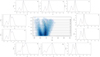 |
Fig. 1. Selection of RC locus (black points) and its colour spread (orange points) from the 2MASS colour-magnitude diagram (J − Ks, J; central panel) for 1° ×1° field centred at ℓ = 45° and b = 5°. The figures labelled 1–10 represent J − Ks density histograms of the corresponding J-magnitude bins. A detailed discussion is presented in the text. The black dots in the central plot show the last 100 points in the lowest-density region. |
Smooth spline functions were then fitted (black lines in Fig. 2) on points 1σ region away from the central RC locus (orange points in the example field) on either side after removing the outliers (green and magenta points). All the stars within the 1σ region are thus considered as candidate RC stars (red points in the example fields shown in Fig. 2). The RC stars have an intrinsic colour spread of ∼0.3 mag (Indebetouw et al. 2005) due to different ages and metallicities. The likelihood of contamination by low-mass dwarfs increases at the faint end of the CMD. Thus, the 1σ region around the central locus is a compromise between the necessity to avoid contamination and at the same time including most of the RC stars. In certain low-extinction fields (e.g., panel a of Fig. 2), the selection colour limits (black lines) become narrower than the intrinsic colour spread in RC stars towards the fainter end. In these cases, a colour cut of 0.15 mag was considered on the redder side of the central locus instead of the method described above. A similar cut on the bluer part was not used in order to avoid contamination from the low-mass main-sequence stars. A glimpse of the RC selection in different directions is provided in panels a: ℓ = 45° , b = 5°, b: ℓ = 75° , b = −1°, c: ℓ = 315° , b = 0°, and d: ℓ = 90° ,b = 0° of Fig. 2.
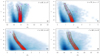 |
Fig. 2. 2MASS colour-magnitude diagram (J − Ks, J) of the 1° ×1° region centred at ℓ = 45° ,b = 5°; 75° b = −1°; 315° ,b = 0°; and 90° ,b = 0° in panels a, b, c, and d, respectively. Red points represent the selected RC star candidates. The black dots in the density plots are used to show the last 100 points in the lowest-density region. |
Assuming  (López-Corredoira et al. 2002; Indebetouw et al. 2005), we calculated the distance (d) and extinction (AJ) of each extracted RC star from Eqs. (1) and (2),
 (1)
(1)
 (2)
(2)
Here, mJ and mKs represent the apparent magnitude in J and Ks bands. We assumed a Dirac delta luminosity function for K giant stars with an absolute magnitude MJ and MKs of −0.945 ± 0.01 and −1.606 ± 0.009 (Ruiz-Dern et al. 2018). The effect of metallicity on the absolute magnitude and intrinsic colours of RC stars observed in the SDSS Apache Point Observatory Galactic Evolution Experiment (APOGEE) and the GALactic Archaeology with HERMES (GALAH) was calculated in Plevne et al. (2020) by using the Bayesian-based distance from Bailer-Jones et al. (2018). The median colours of RC stars in the NIR bands J − Ks = 0.62 ± 0.05 mag are the same for low- and high-metallicity RC stars. However, the median value of absolute magnitude in the J band shows a slight difference, MJ = −1.05 ± 0.21 for low-α RC stars, and MJ = 0.89 ± 0.27 mag for high-α sources. The distance derived using these values of absolute magnitude and colours for the low and high metallicity in APOGEE RC sample (Bovy et al. 2014) shows an offset of only ∼200 pc. Hence, it is safe to assume solar neighbourhood values of absolute magnitude and intrinsic colour in the NIR bands to calculate the distance.
Overall, the errors on the distance determination include the errors in the absolute magnitude (0.5% contribution), extinction, and intrinsic colour (3% contribution) and the errors caused by assuming a Dirac delta luminosity function (5%). The photometric error has a negligible contribution for a mean magnitude in a bin with more than 50 stars. Including all the uncertainties, the error on the distance determination is smaller than 10%. A comparison of the distance estimated by our method with those provided by Gaia and APOGEE is made in Sect. 4.2. Using this method, we selected ∼10.5 million RC star candidates in the 40° ≤ℓ≤320° and −10° ≤b ≤ 10° region.
3.2. Contamination
We chose the 1σ region around the central locus in CMD to extract RC stars. This selection reduced the contamination level, but significant contamination might be left because foreground dwarf or giant stars overlap at the fainter end of CMD. This issue was resolved by using the high-accuracy astrometric data from the Gaia space-based telescope. The Gaia counterparts corresponding to our selected 2MASS RC stars were obtained by matching our sample with the best neighbours of Gaia DR3 and EDR3 using Marrese et al. (2022) through an ADQL query. We found counterparts of 10.3 million RC stars in Gaia DR3 and EDR3 out of 10.5 million selected stars. The RC candidate stars with a fractional Gaia distance (rpgeo) error smaller than 10% and an absolute difference in rpgeo and distance obtained by our method of more than 1.5 kpc were assumed to be foreground low-mass stars. The resulting contamination is thus found to be ∼15% in our sample. We also cross-checked the level of contamination using the current release of Gaia data, that is, Gaia DR3. A total of 14% of the sources are contaminating our sample, that is, stars with a positive parallax, a parallax uncertainty smaller than 10%, and an absolute distance difference 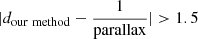 kpc. This contamination was removed from the sample, and the remaining stars were considered pure RC stars. The final sample contains ∼8.8 million RC stars.
A further cross check of the contamination and completeness in the sample was made by considering the latest Besançon model1 (Robin et al. 2004) around a simulated 1° ×1° field centred at ℓ = 45°, b = 5° using Marshall’s extinction map (Marshall et al. 2006) in the 2MASS photometric system. The resulting model CMD has 11 539 stars down to J = 14.5 mag. By comparing the actual number of RC stars present in the field (5154) with our selected value (5133), about 16% of the RC stars are missed by our selection criteria. Moreover, a total of ∼14% of dwarf and giant stars contaminate our sample, which is consistent with the contamination rate determined using Gaia foreground stars. The contamination from foreground dwarf and giant branch star in the final RC sample is further discussed in Appendix A, along with its effect on overall results.
4. Sample validation: Comparison with other available catalogues
In this section, the obtained RC sample is cross-matched with other RC star catalogues available in the literature to verify the completeness and distance determination.
4.1. Sample completeness
Our RC selection criteria are a balance between completeness and contamination. In order to minimise the contamination, we used the 1σ region around the central locus. Considering a perfect Gaussian around the central locus implies that the 1σ region will contain 66.6% of the RC stars. Increasing the completeness limit to 2σ or 3σ will lead to an increase in the contamination by dwarf stars as well as giants. This argument can be verified in panels 7, 8, and 9 of Fig. 1, where an increase in the colour spread will result in the superposition of the second (containing RC stars) and third Gaussian (corresponding to giant population). Even if we are missing 33% (upper bound) of RC stars, we are consistent in our selection criteria to use the 1σ region around the central locus. Eventually, we aim to find the over-densities as compared to the surrounding regions of the disc. The completeness of the sample with respect to other RC catalogues is discussed in the following subsections.
4.1.1. APOGEE value-added RC catalogue
The SDSS APOGEE (Majewski et al. 2017) contains high-resolution NIR spectroscopic data of mainly giant stars. Using these data, Bovy et al. (2014) selected a highly pure (95%) sample of RC stars from the position of the stars in colour-metallicity-surface gravity-temperature space. This sample contains minimal contamination from red giant branch (RGB), secondary RC, and asymptotic giant branch stars. The RC value-added catalogue of the APOGEE recent data release (DR17) lists 50 837 RC stars2 in the entire survey region. The sample size reduces to 20,564 when we consider the stars in the region bounded by 40° ≤ℓ≤320° and −10° ≤b ≤ 10° along with the J < 14.5 mag. Out of 20 564 stars, 16 878 (∼82%) are also selected as RC candidates in our sample. Only 18% of APOGEE RC stars are missing in our sample. In order to investigate the position of missing stars in colour-magnitude space, a J versus J − Ks diagram of 1° ×1° field around l = 251° and b = 0° (containing sufficient APOGEE RC stars) is plotted in the upper panel of Fig. 3. A closer inspection of the figure reveals that the missing sources are present on the redder side of our selection window. However, increasing the selected colour range to include the missing sources may result in higher contamination.
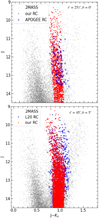 |
Fig. 3. Colour-magnitude (J, J − Ks) diagram of 1° ×1° field centred around ℓ = 251° and b = 0° (upper panel) and ℓ = 45° and b = 5° (lower panel) in grey crosses. RC stars in the APOGEE value-added catalogue and L20 tier1 and tier2 RC stars are over-plotted as open blue circles in the respective panels. RC stars selected by our method are represented by red points. |
4.1.2. Catalogue of Lucey et al. (2020)
Recently, Lucey et al. (2020) have used available photometric data from Gaia DR2, PansTARRS, 2MASS, and ALLWISE to select the RC stars. They provided a sample of 2.6 million RC stars (L20 hereafter). Their method involves predicting astroseismic (ΔP, Δν) and spectroscopic parameters (Teff, log g) obtained from the SED using neural networks. They divided their RC sample into two categories: stars with a contamination rate of 20% and a completeness of 25% as tier1, and stars with a contamination rate of 33% and a completeness rate of 94% as tier2. A cross-match of their catalogue with our candidate stars results in 73% overlap in our survey region. In a sub-classification, we are able to recover 85% of the more reliable stars of tier1 and 71% of tier2 stars. To have a clear idea of completeness, a colour-magnitude diagram of the low-extinction field 2MASS ℓ = 45° and b = 5° is shown in the lower panel of Fig. 3. L20 RC stars of this region and RC candidates from our sample are over-plotted in the same figure with blue and red points, respectively. Similar to the APOGEE RC, the missing L20 RC stars are mostly present on the redder side of the RC locus. The figure shows that increasing our colour selection criteria to 2σ or 3σ will increase the contamination.
4.2. Comparison of the estimated distance
We calculated the distance of RC stars by assuming the constant luminosity function of K-type giants within a 10% uncertainty level (as discussed in Sect. 3.1). The distance information of giant stars can also be obtained from available astrometric, spectroscopic, and photometric data. In this section, the distances obtained by different methods are compared with the estimated distance for RC stars listed in our sample.
4.2.1. APOGEE RC and StarHorse distances
The narrowness of the RC locus in colour-metallicity-luminosity space accounts for the precise measurement of the distance of stars in the APOGEE value-added RC star catalogue. The distance of common stars from the APOGEE value-added catalogue is compared with our estimated distances in the upper left panel of Fig. 4. Most of the stars show the same distance, while a small number deviates slightly from the APOGEE RC distances.
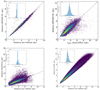 |
Fig. 4. Comparison of the distance obtained from different methods: our method with APOGEE (in the upper left panel), Gaia EDR3 (rpgeo) with APOGEE RC (in the upper right panel), our catalogue with StarHorse (bottom left), and L20 catalogue (bottom right). The inset histograms in each panel represent the difference in respective distances. |
APOGEE has another value-added catalogue named ‘StarHorse’. It is dedicated to finding the distance, extinction, and astrophysical parameters of the stars by combining the high-resolution spectroscopic data from APOGEE with broadband photometric data (Pan-STARRS, 2MASS, and ALLWISE) and parallax (Gaia EDR3) using Bayesian statistics (Santiago et al. 2016; Queiroz et al. 2020). The StarHorse DR17 catalogues list 562 424 (RC as well as non-RC) APOGEE sources with distance uncertainties of ∼5%. The region 39.5° < ℓ≤320° and −10° ≤b ≤ 10° contains 111 438 StarHorse stars. A cross-match of these stars with our catalogue in a 1″ sky region results in 45 580 stars in common. The distance comparison of the cross-matched stars obtained from our method (x-axis) with the StarHorse median distance is shown in the bottom left panel of Fig. 4. Most of the stars lie close to the 1:1 line, with some scattering of the outliers.
The distance of our selected stars matches the two APOGEE catalogues well. However, the APOGEE spectroscopic sample has a brightness limit of H < 13 mag, which corresponds to stars only in nearby regions (d < 3–5 kpc). Hence, the APOGEE sample can be used to confirm the reliability of our catalogue distance to about 5 kpc.
4.2.2. Gaia distances
The distance of selected RC stars can also be obtained from Gaia data, that is, from the geo and photogeo parameters from Bailer-Jones et al. (2021) using Gaia EDR3 data and the GSP-Phot distance from Gaia DR3 (Andrae et al. 2023). The most appropriate distance estimator out of the three listed above was checked in Gaia Collaboration (2023; see Fig. 6 of their paper) by comparison with the RC distance from APOGEE DR17 (Abdurro’uf et al. 2022). They found that the photogeo distance gives a lower dispersion and hence is a better distance estimator than the other two. The APOGEE RC distance of the common sample of 16 878 stars (see Sect. 4.1.1) was then compared with photogeo/rpgeo in the upper right panel of Fig. 4 and the distance obtained by our study in the upper left panel, along with the respective difference in distance histograms (insets). Our method clearly yields a narrower distribution that is closer to the APOGEE distance than the large dispersion in rpgeo distance (see the inset histograms of Fig. 4). This highlights the robustness of our RC selection and distance estimation method.
4.2.3. RC distances from Lucey et al. (2020)
APOGEE and Gaia distances can only be used to compare nearby distances (< 3–5 kpc). On the other hand, The L20 catalogue provides the distances of 2.4 million stars with ∼75 000 stars at distances > 10 kpc by correcting for the extinction in the W1 WISE band. A comparison of the L20 distances with ours (bottom right panel of Fig. 4) shows that the vast majority of the stars are on a one-to-one correlation. The distance to the fainter stars seems to be overestimated in the L20 catalogue, which may result from an uncertain extinction in the W1 band.
5. Results
In this section, we present the distribution of selected RC stars in the Galactic disc with the aim to find an over-density in the spiral arms and to explore the asymmetry above and below the Galactic plane.
5.1. Distribution in the Galactic plane
The complete density map of the selected RC stars in the galactocentric coordinates (X, Y) was obtained by using a kernel density estimation with a band width of 0.1 kpc. The resulting spatial distribution of RC stars is shown in Fig. 5a, where (0, 0) point represents the Galactic centre (black cross) and (−8.3, 0) corresponds to the position of the Sun (orange circle). The lack of stars closer to the Sun is due to the selection criteria we discussed in the previous sections. The spatial distribution of stars shows no arm-like feature, which is expected for older population stars. The density distribution is rather dominated by the global density of stars in the Galactic disc, that is, exponentially decreasing star counts moving away from the Galactic centre. The spiral-arm pattern is thus difficult to disentangle from the old stellar population. In order to reveal the underlying spiral structure, if present, we used the bi-variate kernel density estimator method. The stellar over-density was determined following (Poggio et al. 2021)
 (3)
(3)
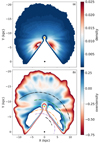 |
Fig. 5. Spatial distribution of RC stars projected onto the Galactic plane in galactocentric coordinates. Panel a represents the overall density distribution of RC stars. Panel b shows the overdensity map of RC stars calculated with local and mean density scale lengths of 0.3 and 2 kpc, respectively. Spiral arms from Castro-Ginard et al. (2021; Scutum: purple, Sagittarius: orange, Local: cyan, Perseus: green) and Reid et al. (2019; Norma-Outer: black) are over-plotted as dash-dotted lines. The solid black line corresponds to the extension of the Outer arm (Reid et al. 2019) in the third Galactic quadrant. The empty regions towards the inner Galaxy in both panels represent the density or over-density above the maximum limit shown in the corresponding colour bars. |
The local density Σ(X, Y) and mean density ⟨Σ(X, Y)⟩ at (X, Y) were calculated using the bi-variate kernel density estimator using a bandwidth of 0.3 and 2 kpc, respectively. The over-density map shown in Fig. 5b reveals some discernible arm-like features. We used the log-periodic spiral arm model from Reid et al. (2019); Eq. (4) to map the spiral arms in the RC over-density plot,
 (4)
(4)
RG and θG in Eq. (4) are the galactocentric radius and azimuth (defined as 0 towards the Sun and increasing in the direction of Galactic rotation) along the arm, respectively. RG, ref, θG, ref, and ψ are the reference galactocentric radius, azimuth, and pitch angle for a given arm. Castro-Ginard et al. (2021) determined the parameters for four arms (Perseus, Local, Sagittarius, and Scutum) by fitting the above model on the distribution of Galactic open clusters in Gaia EDR3 data and high-mass star-forming regions in the Galaxy from Reid et al. (2014). These parameters were used to construct the corresponding arm segments. The parameters of arms that were not considered (Norma and Outer arms) in Castro-Ginard et al. (2021) were taken from Reid et al. (2019). The galactocentric coordinates for corresponding arms were then calculated using the following equations:
 (5)
(5)
 (6)
(6)
Over-plotting the spiral arm as dash-dotted lines in Fig. 5 reveals that the Outer arm (dash-dotted black line) defined in Cantat-Gaudin et al. (2020) coincide with the RC star over-density. We note that the RC stars trace the Outer arm in the third quadrant (solid black line: plotted by extending the same model parameters) from (X, Y)∼(−4, −13) to (−10, −10.5) kpc as well. Most of the earlier studies of the Galactic structure with the star count method using different tracers either do not show this distant Outer arm structure (Poggio et al. 2021; Lin et al. 2022, etc.) or show the Outer arm mainly in the second quadrant, with a small extension into the third quadrant (from (X, Y)∼(10, −3) to (−4, −13) kpc; Reid et al. 2019). However, our selected RC stars are able to probe the Outer arm in farther regions of the third Galactic quadrant. The regions closer to the Perseus arm also show an enhanced number density. Overall, we are able to trace the distant arms in the outer Galaxy, unlike in Lin et al. (2022), where only the Local arm of the Galaxy was traced using RC stars extracted from the 2MASS colour-magnitude diagram. The use of the Gaia parallax to estimate the distance in Lin et al. (2022) and their selection criterion on relative parallax uncertainties  resulted in the confinement of structure towards the nearer regions of the Galaxy, thereby limiting their ability to trace structures beyond the Local arm. However, it should be noted that we excluded the large portion of the inner Galaxy (|ℓ| < 40), which explains why the Local arm feature is not visible in our over-density maps.
5.2. Asymmetry in the Galactic disc
The star counts above and below the Galactic plane should be nearly the same in all the longitudes for a symmetric Galaxy. However, the ratio of the number of RC stars above (Z > 0) and below (Z < 0) the Galactic plane in the longitude range of 40° ≤ℓ≤320° with 1° bins does not show a symmetric structure (see Fig. 6). The large-scale variation of the count ratio clearly represents a wave-like asymmetry, that is, excess of RC stars above the Galactic plane as compared to Z < 0 for ℓ < 180°, and the opposite trend for ℓ > 180°.
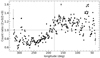 |
Fig. 6. Distribution of the ratio of RC stars above and below the Galactic plane as a function of longitude in 1° bins of ℓ. |
The asymmetry above and below the Galactic plane with respect to longitude has also been observed earlier in a few regions of the Galactic plane using various stellar tracers (e.g., López-Corredoira et al. 2002; Ferguson et al. 2017). We studied the continuous asymmetry, which is a manifestation of the warped disc of the Galaxy, with respect to longitude from 40° ≤ℓ≤320°.
5.3. Asymmetry in the spiral arms
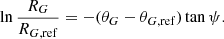
The asymmetry in the stellar densities along the azimuthal direction in the Milky Way as well as in other disc galaxies is well known (e.g., Henry et al. 2003). It is caused by different spiral arms in the galaxies. However, the asymmetry in the spiral arms above and below the Galactic plane has never been studied so far. The distribution of RC stars above (Z > 0, Fig. 7a) and below the Galactic plane (Z < 0, Fig. 7b) does not continuously trace the Outer arm from one quadrant to the next. However, the over-density towards the Outer arm is observed only in the second quadrant for Z > 0, and the distribution of RC stars below the Galactic plane shows ab over-density at the Outer arm in the third Galactic quadrant. The different parts of the Outer arm are thus traced by the RC above and below the Galactic plane, giving the signature of warping in the spiral arm, especially in the outer arm. To better observe the warping in the spiral arms, we determined the ratio of RC stars above and below the Galactic plane and distributed them in the galactocentric XY plane with 200 pc bins in X and Y (see Figs. 7c for −10° ≤b ≤ 10° and 7d for b = ±5°). In each panel, the large-scale wavelike asymmetry is well observed from different colours for ℓ < 180° and ℓ > 180°. A careful inspection of the figures reveals a curvy feature in the count ratios. The log-periodic spiral-arm model described in Eq. (4) along with Eqs. (5) and (6) is over-plotted on the count ratio map to inspect the correlation of spiral arms with these curvy features. The Outer arm coincides with a count ratio greater than one in the second quadrant and a count ratio lower than one in the third quadrant. This suggests an asymmetry in the spiral pattern above and below the Galactic plane. The observed asymmetry in the spiral arms gives direct observational evidence that the spiral arms are warped upward for ℓ < 180° and downward in the southern direction, ℓ > 180°, similar to the Galactic disc.
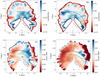 |
Fig. 7. Over-density map of RC stars above (Z > 0) and below (Z < 0) the Galactic plane, in panels a and b, respectively. The bottom panels represent the distribution of the ratio of RC stars above and below the Galactic plane in the galactocentric coordinate system with ℓ range of 40° ≤ℓ≤320° and −10° ≤b ≤ 10° in panel c and |b| = 5° in panel d. The spiral-arm pattern (dot-dashed) follows the same colour codes as in Fig. 5. |
6. Discussion and conclusion
We developed an automated procedure for selecting candidate RC stars from 2MASS colour-magnitude diagrams in the Galactic disc (40° ≤ℓ≤320°, and −10° ≤b ≤ 10°) avoiding the regions closer to the bulge (|ℓ| < 40°). A large sample of RC stars (∼10 million) was retrieved from the 2MASS data with distance uncertainties smaller than 10% and a contamination rate < 20%. The spatial density distribution of RC stars in the Galactic disc is dominated by an exponentially decreasing density. However, we found an over-density in the RC stars that coincides with the Outer arm and Perseus arm. The Outer arm is continuously traced for the first time in the second and third Galactic quadrants up to (X, Y)∼(−10, −10.5) kpc using RC stars. Significant enhancement in the stellar counts is also observed in the Perseus arm. This implies that the RC stars, representing the older population, are good tracers for mapping the outer arms. This is also supported by previous observations (Benjamin et al. 2005; Churchwell et al. 2009). The inner arms might be traced by the younger population alone. The difference in the spiral structure that is traced by the younger and older population might represent the age gradient across the spiral arm, which favours the density wave theory for the spiral arm formation (Vallée 2022).
In addition to the spiral structure, the distribution of RC stars above and below the Galactic plane shows a north-south asymmetry that indicates a warp. Warping of the disc is also observed in dust (Marshall et al. 2006), gas (Nakanishi & Sofue 2003), in stars (Chrobáková et al. 2020), in OB stars (Li et al. 2019), in Cepheids (Chen et al. 2019), and also in the older population (López-Corredoira et al. 2002; Momany et al. 2004; Chrobáková et al. 2022), favouring the gravitational origin of the disc warp. Earlier studies (López-Corredoira et al. 2002) of RC stars showed the warp towards some selected directions only, but we presented a systematic study of the whole Galactic plane that showed the asymmetry in the Galactic disc caused by the warp. Not only does the number of stars increase above or below the Galactic plane in ℓ < 180° and ℓ > 180°, respectively, but an asymmetry of stellar counts is also observed in the spiral arms. This provides the first observational evidence that the spiral arms are also warped in a similar way as the rest of the Galactic disc.
https://model.obs-besancon.fr/
https://www.sdss.org/dr17/dataaccess/value-added-catalogs/?vacid=apogee-red-clump-(rc)-catalog
Acknowledgments
Work at Physical Research Laboratory is supported by Department of Space (DOS), Govt. of India. We would like to thank the anonymous referee for the constructive comments and suggestions that improved the quality of the manuscript. This work presents the results from 2 Micron All Sky Survey (2MASS). 2MASS is a joint project of the University of Massachusetts and the Infrared Processing and Analysis centre/California Institute of Technology, funded by the National Aeronautics and Space Administration and the National Science Foundation. This publication makes use of data products from the European Space Agency (ESA) mission Gaia (https://www.cosmos.esa.int/gaia), processed by the Gaia Data Processing and Analysis Consortium (DPAC; https://www.cosmos.esa.int/web/gaia/dpac/consortium). Funding for DPAC has been provided by national institutions, in particular, the institutions participating in the Gaia Multilateral Agreement.
References
- Abdurro’uf, Accetta, K., Aerts, C., et al. 2022, ApJS, 259, 35 [NASA ADS] [CrossRef] [Google Scholar]
- Andrae, R., Fouesneau, M., Sordo, R., et al. 2023, A&A, in press, https://doi.org/10.1051/0004-6361/202243462 [Google Scholar]
- Bailer-Jones, C. A. L., Rybizki, J., Fouesneau, M., Mantelet, G., & Andrae, R. 2018, AJ, 156, 58 [Google Scholar]
- Bailer-Jones, C. A. L., Rybizki, J., Fouesneau, M., Demleitner, M., & Andrae, R. 2021, AJ, 161, 147 [Google Scholar]
- Benjamin, R. A., Churchwell, E., Babler, B. L., et al. 2005, ApJ, 630, L149 [NASA ADS] [CrossRef] [Google Scholar]
- Bovy, J., Nidever, D. L., Rix, H.-W., et al. 2014, ApJ, 790, 127 [CrossRef] [Google Scholar]
- Cantat-Gaudin, T., Anders, F., Castro-Ginard, A., et al. 2020, A&A, 640, A1 [NASA ADS] [CrossRef] [EDP Sciences] [Google Scholar]
- Castro-Ginard, A., McMillan, P. J., Luri, X., et al. 2021, A&A, 652, A162 [NASA ADS] [CrossRef] [EDP Sciences] [Google Scholar]
- Chen, X., Wang, S., Deng, L., et al. 2019, Nat. Astron., 3, 320 [NASA ADS] [CrossRef] [Google Scholar]
- Chrobáková, Ž., Nagy, R., & López-Corredoira, M. 2020, A&A, 637, A96 [NASA ADS] [CrossRef] [EDP Sciences] [Google Scholar]
- Chrobáková, Ž., Nagy, R., & López-Corredoira, M. 2022, A&A, 664, A58 [NASA ADS] [CrossRef] [EDP Sciences] [Google Scholar]
- Churchwell, E., Babler, B. L., Meade, M. R., et al. 2009, PASP, 121, 213 [Google Scholar]
- Dobbs, C. L., & Pringle, J. E. 2010, MNRAS, 409, 396 [NASA ADS] [CrossRef] [Google Scholar]
- Drimmel, R., & Spergel, D. N. 2001, ApJ, 556, 181 [Google Scholar]
- Ferguson, D., Gardner, S., & Yanny, B. 2017, ApJ, 843, 141 [NASA ADS] [CrossRef] [Google Scholar]
- Gaia Collaboration (Prusti, T., et al.) 2016, A&A, 595, A1 [NASA ADS] [CrossRef] [EDP Sciences] [Google Scholar]
- Gaia Collaboration (Brown, A. G. A., et al.) 2018, A&A, 616, A1 [NASA ADS] [CrossRef] [EDP Sciences] [Google Scholar]
- Gaia Collaboration (Brown, A. G. A., et al.) 2021, A&A, 649, A1 [NASA ADS] [CrossRef] [EDP Sciences] [Google Scholar]
- Gaia Collaboration (Drimmel, R. et al.) 2023, A&A, in press, https://doi.org/10.1051/0004-6361/202243797 [Google Scholar]
- Girardi, L. 2016, ARA&A, 54, 95 [Google Scholar]
- Hammersley, P. L., Cohen, M., Garzón, F., Mahoney, T., & López-Corredoira, M. 1999, MNRAS, 308, 333 [NASA ADS] [CrossRef] [Google Scholar]
- Henderson, A. P. 1979, in The Large-Scale Characteristics of the Galaxy, ed. W. B. Burton, 84, 493 [NASA ADS] [CrossRef] [Google Scholar]
- Henry, A. L., Quillen, A. C., & Gutermuth, R. 2003, AJ, 126, 2831 [NASA ADS] [CrossRef] [Google Scholar]
- Hou, L. G. 2021, Front. Astron. Space Sci., 8, 103 [NASA ADS] [CrossRef] [Google Scholar]
- Hou, L. G., & Han, J. L. 2014, A&A, 569, A125 [NASA ADS] [CrossRef] [EDP Sciences] [Google Scholar]
- Indebetouw, R., Mathis, J. S., Babler, B. L., et al. 2005, ApJ, 619, 931 [NASA ADS] [CrossRef] [Google Scholar]
- Kerr, F. J. 1957, AJ, 62, 93 [NASA ADS] [CrossRef] [Google Scholar]
- Levine, E. S., Blitz, L., & Heiles, C. 2006, ApJ, 643, 881 [NASA ADS] [CrossRef] [Google Scholar]
- Li, C., Zhao, G., Jia, Y., et al. 2019, ApJ, 871, 208 [Google Scholar]
- Lin, Z., Xu, Y., Hou, L., et al. 2022, ApJ, 931, 72 [NASA ADS] [CrossRef] [Google Scholar]
- Lindegren, L., Klioner, S. A., Hernández, J., et al. 2021, A&A, 649, A2 [EDP Sciences] [Google Scholar]
- López-Corredoira, M., Cabrera-Lavers, A., Garzón, F., & Hammersley, P. L. 2002, A&A, 394, 883 [NASA ADS] [CrossRef] [EDP Sciences] [Google Scholar]
- Lucey, M., Ting, Y.-S., Ramachandra, N. S., & Hawkins, K. 2020, MNRAS, 495, 3087 [Google Scholar]
- Majewski, S. R., Schiavon, R. P., Frinchaboy, P. M., et al. 2017, AJ, 154, 94 [NASA ADS] [CrossRef] [Google Scholar]
- Marrese, P. M., Marinoni, S., Fabrizio, M., & Altavilla, G. 2022, https://gea.esac.esa.int/archive/documentation/GDR3/index.html, id. 15 [Google Scholar]
- Marshall, D. J., Robin, A. C., Reylé, C., Schultheis, M., & Picaud, S. 2006, A&A, 453, 635 [NASA ADS] [CrossRef] [EDP Sciences] [Google Scholar]
- Momany, Y., Zaggia, S. R., Bonifacio, P., et al. 2004, A&A, 421, L29 [NASA ADS] [CrossRef] [EDP Sciences] [Google Scholar]
- Nakanishi, H., & Sofue, Y. 2003, PASJ, 55, 191 [Google Scholar]
- Nakanishi, H., & Sofue, Y. 2016, PASJ, 68, 5 [NASA ADS] [CrossRef] [Google Scholar]
- Nogueras-Lara, F., Schödel, R., & Neumayer, N. 2021, A&A, 653, A33 [NASA ADS] [CrossRef] [EDP Sciences] [Google Scholar]
- Paul, E. R. 1993, The Milky Way Galaxy and Statistical Cosmology, 1890-1924 (Cambridge, UK: Cambridge University Press) [Google Scholar]
- Peterken, T. G., Merrifield, M. R., Aragón-Salamanca, A., et al. 2019, Nat. Astron., 3, 178 [Google Scholar]
- Plevne, O., Önal Taş, Ö., Bilir, S., & Seabroke, G. M. 2020, ApJ, 893, 108 [NASA ADS] [CrossRef] [Google Scholar]
- Poggio, E., Drimmel, R., Lattanzi, M. G., et al. 2018, MNRAS, 481, L21 [Google Scholar]
- Poggio, E., Drimmel, R., Cantat-Gaudin, T., et al. 2021, A&A, 651, A104 [NASA ADS] [CrossRef] [EDP Sciences] [Google Scholar]
- Queiroz, A. B. A., Anders, F., Chiappini, C., et al. 2020, A&A, 638, A76 [NASA ADS] [CrossRef] [EDP Sciences] [Google Scholar]
- Reid, M. J., Menten, K. M., Brunthaler, A., et al. 2014, ApJ, 783, 130 [Google Scholar]
- Reid, M. J., Menten, K. M., Brunthaler, A., et al. 2019, ApJ, 885, 131 [Google Scholar]
- Robin, A. C., Reylé, C., Derrière, S., & Picaud, S. 2004, A&A, 416, 157 [NASA ADS] [CrossRef] [EDP Sciences] [Google Scholar]
- Ruiz-Dern, L., Babusiaux, C., Arenou, F., Turon, C., & Lallement, R. 2018, A&A, 609, A116 [NASA ADS] [CrossRef] [EDP Sciences] [Google Scholar]
- Santiago, B. X., Brauer, D. E., Anders, F., et al. 2016, A&A, 585, A42 [NASA ADS] [CrossRef] [EDP Sciences] [Google Scholar]
- Shabani, F., Grebel, E. K., Pasquali, A., et al. 2018, MNRAS, 478, 3590 [NASA ADS] [CrossRef] [Google Scholar]
- Shen, J., & Zheng, X.-W. 2020, Res. Astron. Astrophys., 20, 159 [CrossRef] [Google Scholar]
- Shu, F. H. 2016, ARA&A, 54, 667 [NASA ADS] [CrossRef] [Google Scholar]
- Skowron, D. M., Skowron, J., Mróz, P., et al. 2019, Science, 365, 478 [Google Scholar]
- Skrutskie, M. F., Cutri, R. M., Stiening, R., et al. 2006, AJ, 131, 1163 [NASA ADS] [CrossRef] [Google Scholar]
- Vallée, J. P. 2022, Ap&SS, 367, 26 [CrossRef] [Google Scholar]
- VERA Collaboration (Hirota, T., et al.) 2020, PASJ, 72, 50 [Google Scholar]
- Xu, Y., Bian, S. B., Reid, M. J., et al. 2018a, A&A, 616, L15 [NASA ADS] [CrossRef] [EDP Sciences] [Google Scholar]
- Xu, Y., Hou, L.-G., & Wu, Y.-W. 2018b, Res. Astron. Astrophys., 18, 146 [CrossRef] [Google Scholar]
- Xu, Y., Hou, L. G., Bian, S. B., et al. 2021, A&A, 645, L8 [EDP Sciences] [Google Scholar]
- Yu, S.-Y., & Ho, L. C. 2018, ApJ, 869, 29 [NASA ADS] [CrossRef] [Google Scholar]
- Yusifov, I. 2004, in The Magnetized Interstellar Medium, eds. B. Uyaniker, W. Reich, & R. Wielebinski, 165 [Google Scholar]
Appendix A: Removing contamination using astrophysical parameters from Gaia DR3
Gaia DR3 provides the astrophysical parameters, GSP-Phot (effective temperature, surface gravity, metallicity, absolute MG magnitude, radius, distance, and extinction) for a homogeneous sample of 471 million sources with G < 19 mag (Andrae et al. 2023). This is part of the results from the astrophysical parameter inference system (Apsis) within the Gaia Data Processing and Analysis Consortium. The parameters were calculated by simultaneously fitting BP/RP spectra, parallax, and G mag using Bayesian forward modelling based on isochrone models. One of the caveats of this approach is that the effective temperature-extinction degeneracy cannot be broken for red stars, as shown in Fig. 6a of Andrae et al. (2023). However, high-quality parallax data, that is,  are expected to give reliable Teff and logg estimates for red giants or RC stars. Using only high-quality parallax data corresponding to our RC sample stars, we found a contamination of only ∼2% using log g > 4 dex.
For completeness, we removed the foreground contamination in our RC star sample using log g > 4 dex and Teff < 6000 K for all stars. This cut results in a contamination of ∼5%. The distribution of RC stars in the XY plane after removing the contamination using the Gaia EDR3 distance (∼15%), Gaia DR3 astrophysical parameters (∼11%), and from both (∼20%) are compared in panels (a), (b), and (c) of Fig. A.1, respectively. The large-scale distribution of RC stars in the three panels shows similar structural features.
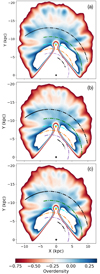 |
Fig. A.1. Comparison of the RC over-density obtained by removing contamination using (a) Gaia EDR3 rpgeo distance and (b) astrophysical parameters from DR3. The bottom panel shows the over-density by taking contributions from panels (a) and (b). |
All Figures
|
Fig. 1. Selection of RC locus (black points) and its colour spread (orange points) from the 2MASS colour-magnitude diagram (J − Ks, J; central panel) for 1° ×1° field centred at ℓ = 45° and b = 5°. The figures labelled 1–10 represent J − Ks density histograms of the corresponding J-magnitude bins. A detailed discussion is presented in the text. The black dots in the central plot show the last 100 points in the lowest-density region. |
| In the text | |
|
Fig. 2. 2MASS colour-magnitude diagram (J − Ks, J) of the 1° ×1° region centred at ℓ = 45° ,b = 5°; 75° b = −1°; 315° ,b = 0°; and 90° ,b = 0° in panels a, b, c, and d, respectively. Red points represent the selected RC star candidates. The black dots in the density plots are used to show the last 100 points in the lowest-density region. |
| In the text | |
|
Fig. 3. Colour-magnitude (J, J − Ks) diagram of 1° ×1° field centred around ℓ = 251° and b = 0° (upper panel) and ℓ = 45° and b = 5° (lower panel) in grey crosses. RC stars in the APOGEE value-added catalogue and L20 tier1 and tier2 RC stars are over-plotted as open blue circles in the respective panels. RC stars selected by our method are represented by red points. |
| In the text | |
|
Fig. 4. Comparison of the distance obtained from different methods: our method with APOGEE (in the upper left panel), Gaia EDR3 (rpgeo) with APOGEE RC (in the upper right panel), our catalogue with StarHorse (bottom left), and L20 catalogue (bottom right). The inset histograms in each panel represent the difference in respective distances. |
| In the text | |
|
Fig. 5. Spatial distribution of RC stars projected onto the Galactic plane in galactocentric coordinates. Panel a represents the overall density distribution of RC stars. Panel b shows the overdensity map of RC stars calculated with local and mean density scale lengths of 0.3 and 2 kpc, respectively. Spiral arms from Castro-Ginard et al. (2021; Scutum: purple, Sagittarius: orange, Local: cyan, Perseus: green) and Reid et al. (2019; Norma-Outer: black) are over-plotted as dash-dotted lines. The solid black line corresponds to the extension of the Outer arm (Reid et al. 2019) in the third Galactic quadrant. The empty regions towards the inner Galaxy in both panels represent the density or over-density above the maximum limit shown in the corresponding colour bars. |
| In the text | |
|
Fig. 6. Distribution of the ratio of RC stars above and below the Galactic plane as a function of longitude in 1° bins of ℓ. |
| In the text | |
|
Fig. 7. Over-density map of RC stars above (Z > 0) and below (Z < 0) the Galactic plane, in panels a and b, respectively. The bottom panels represent the distribution of the ratio of RC stars above and below the Galactic plane in the galactocentric coordinate system with ℓ range of 40° ≤ℓ≤320° and −10° ≤b ≤ 10° in panel c and |b| = 5° in panel d. The spiral-arm pattern (dot-dashed) follows the same colour codes as in Fig. 5. |
| In the text | |
|
Fig. A.1. Comparison of the RC over-density obtained by removing contamination using (a) Gaia EDR3 rpgeo distance and (b) astrophysical parameters from DR3. The bottom panel shows the over-density by taking contributions from panels (a) and (b). |
| In the text | |
Current usage metrics show cumulative count of Article Views (full-text article views including HTML views, PDF and ePub downloads, according to the available data) and Abstracts Views on Vision4Press platform.
Data correspond to usage on the plateform after 2015. The current usage metrics is available 48-96 hours after online publication and is updated daily on week days.
Initial download of the metrics may take a while.