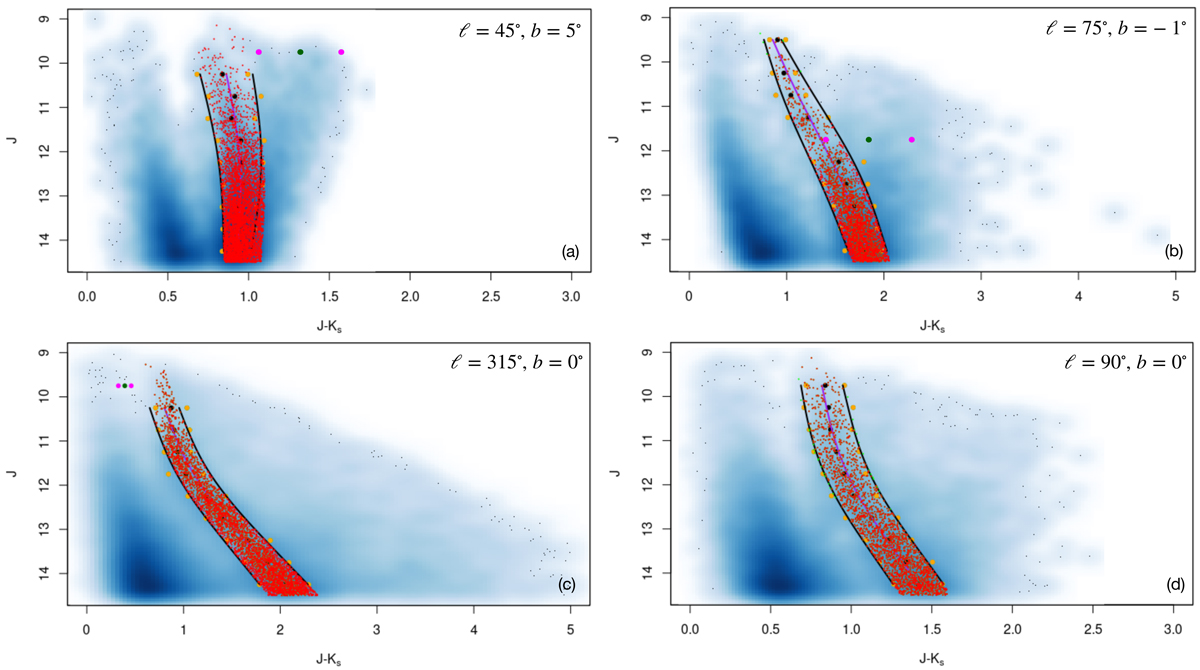
Fig. 2.
Download original image
2MASS colour-magnitude diagram (J − Ks, J) of the 1° ×1° region centred at ℓ = 45° ,b = 5°; 75° b = −1°; 315° ,b = 0°; and 90° ,b = 0° in panels a, b, c, and d, respectively. Red points represent the selected RC star candidates. The black dots in the density plots are used to show the last 100 points in the lowest-density region.
Current usage metrics show cumulative count of Article Views (full-text article views including HTML views, PDF and ePub downloads, according to the available data) and Abstracts Views on Vision4Press platform.
Data correspond to usage on the plateform after 2015. The current usage metrics is available 48-96 hours after online publication and is updated daily on week days.
Initial download of the metrics may take a while.