Fig. 5.
Download original image
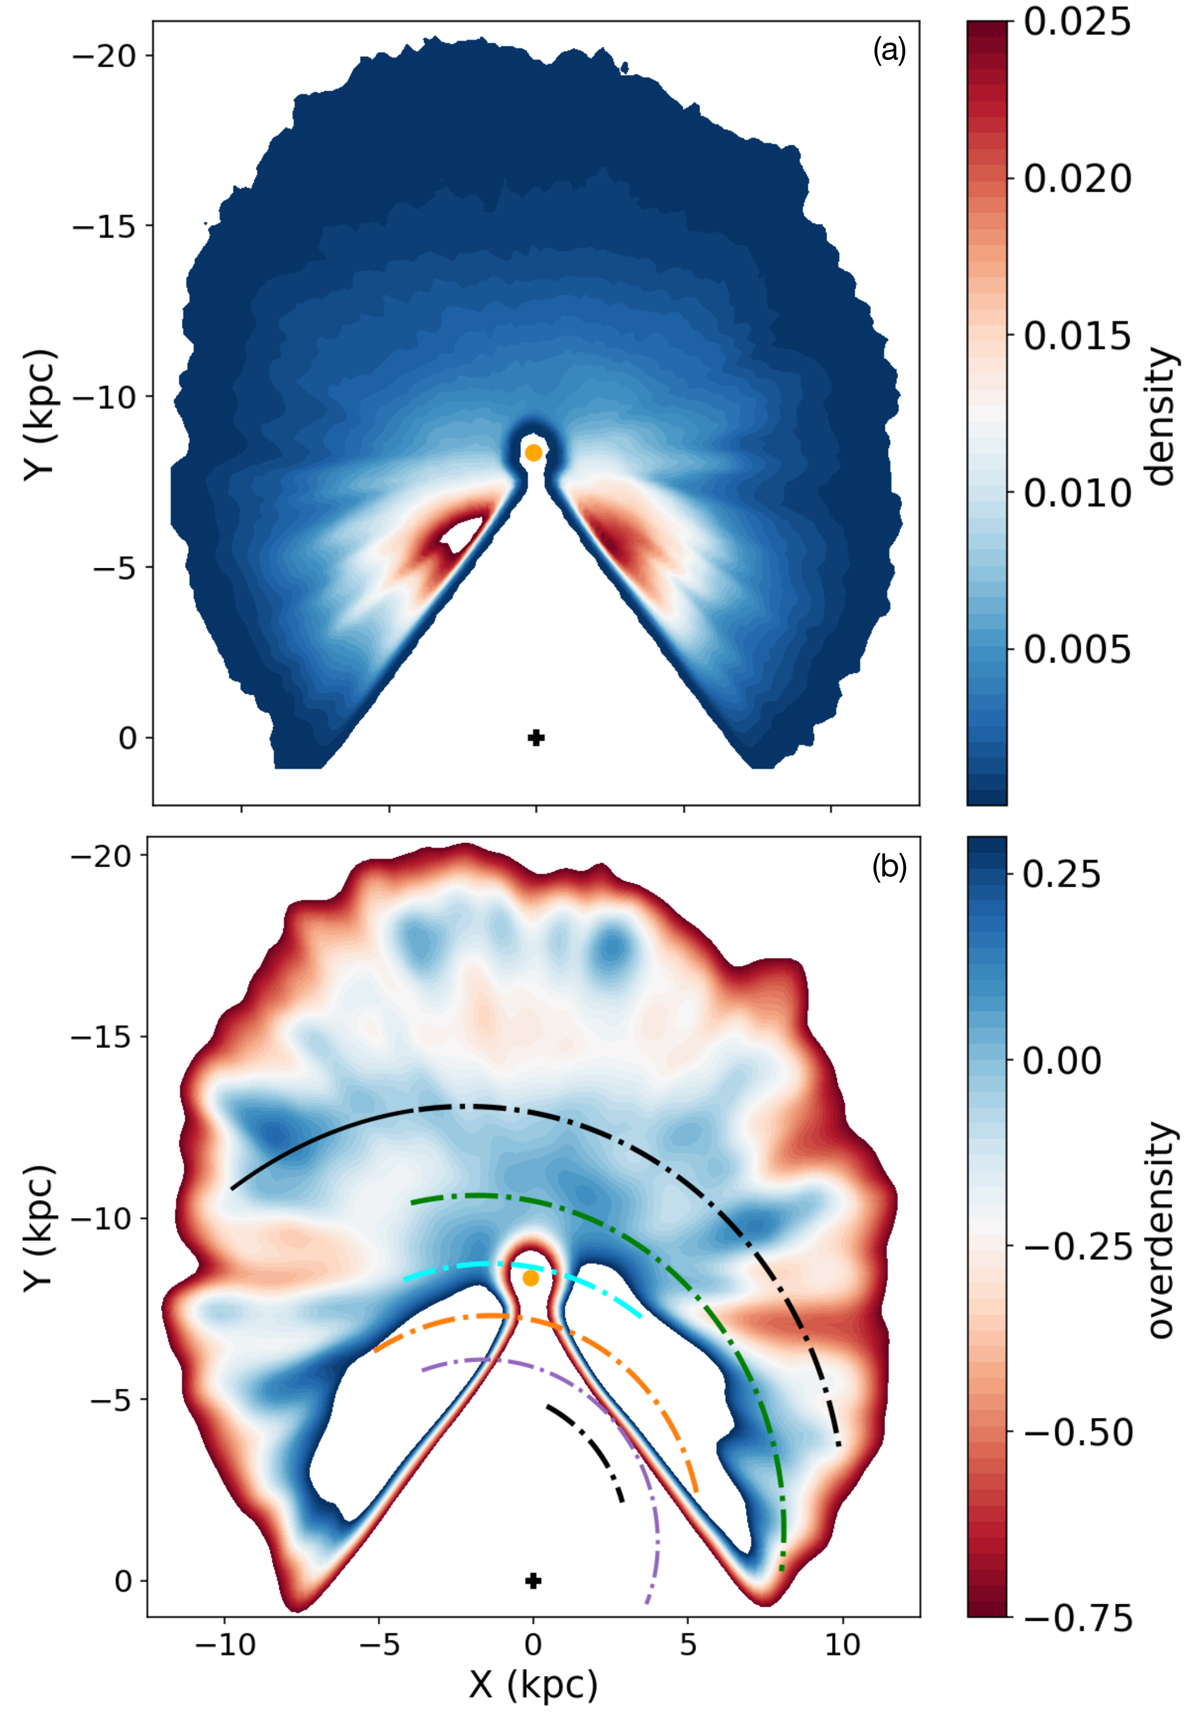
Spatial distribution of RC stars projected onto the Galactic plane in galactocentric coordinates. Panel a represents the overall density distribution of RC stars. Panel b shows the overdensity map of RC stars calculated with local and mean density scale lengths of 0.3 and 2 kpc, respectively. Spiral arms from Castro-Ginard et al. (2021; Scutum: purple, Sagittarius: orange, Local: cyan, Perseus: green) and Reid et al. (2019; Norma-Outer: black) are over-plotted as dash-dotted lines. The solid black line corresponds to the extension of the Outer arm (Reid et al. 2019) in the third Galactic quadrant. The empty regions towards the inner Galaxy in both panels represent the density or over-density above the maximum limit shown in the corresponding colour bars.
Current usage metrics show cumulative count of Article Views (full-text article views including HTML views, PDF and ePub downloads, according to the available data) and Abstracts Views on Vision4Press platform.
Data correspond to usage on the plateform after 2015. The current usage metrics is available 48-96 hours after online publication and is updated daily on week days.
Initial download of the metrics may take a while.