Fig. 3.
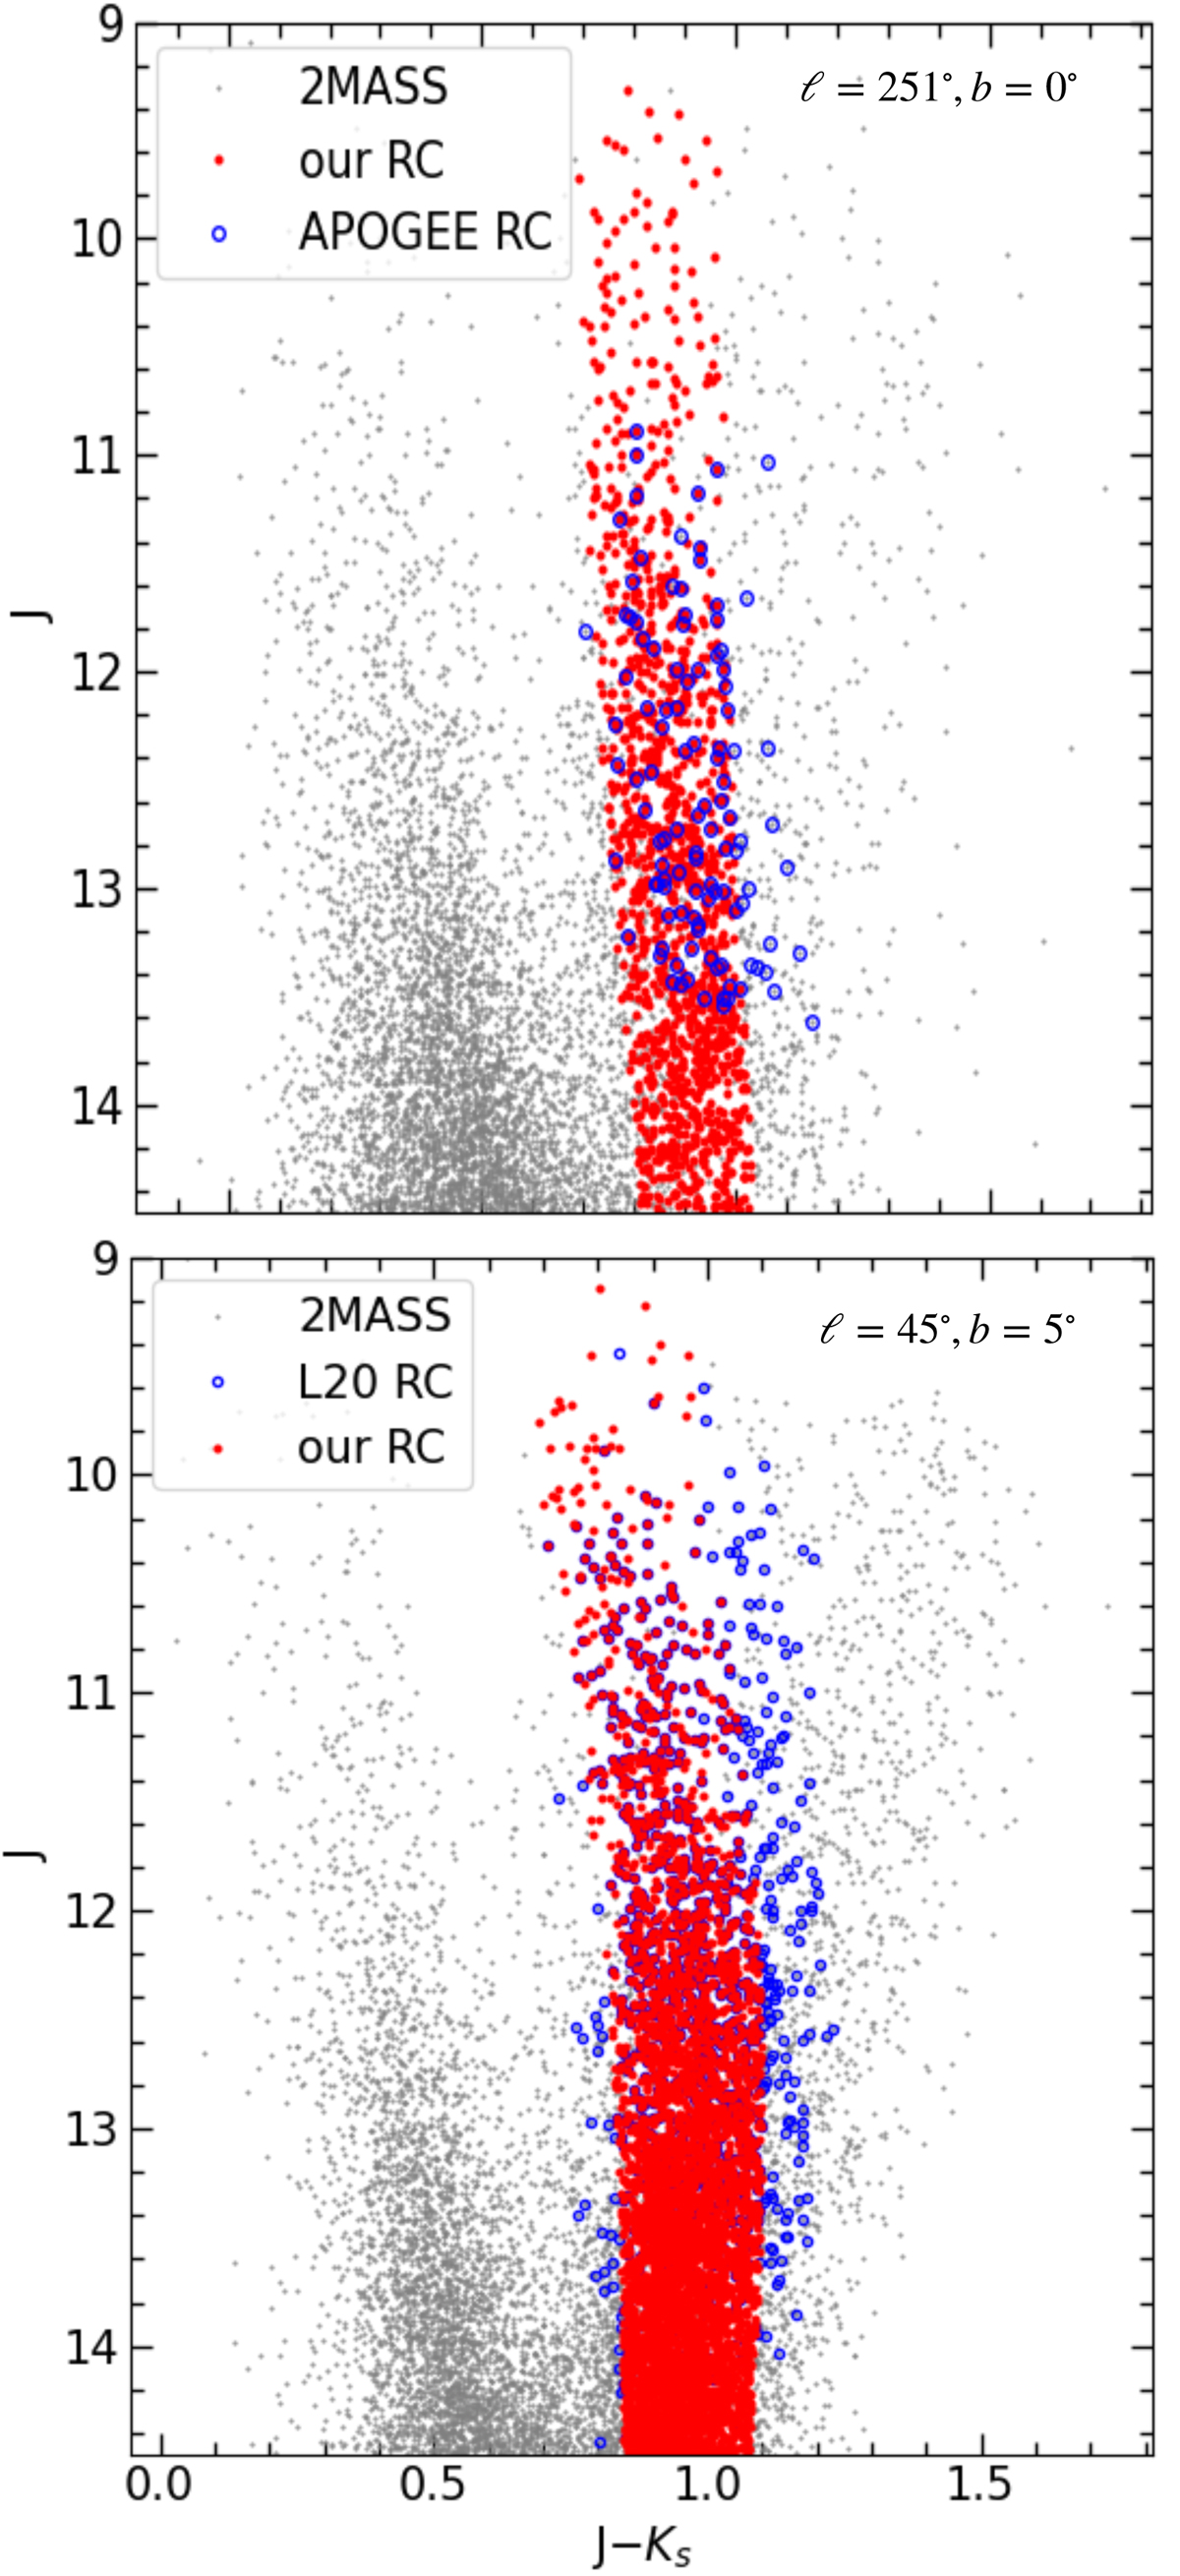
Download original image
Colour-magnitude (J, J − Ks) diagram of 1° ×1° field centred around ℓ = 251° and b = 0° (upper panel) and ℓ = 45° and b = 5° (lower panel) in grey crosses. RC stars in the APOGEE value-added catalogue and L20 tier1 and tier2 RC stars are over-plotted as open blue circles in the respective panels. RC stars selected by our method are represented by red points.
Current usage metrics show cumulative count of Article Views (full-text article views including HTML views, PDF and ePub downloads, according to the available data) and Abstracts Views on Vision4Press platform.
Data correspond to usage on the plateform after 2015. The current usage metrics is available 48-96 hours after online publication and is updated daily on week days.
Initial download of the metrics may take a while.