Fig. 7.
Download original image
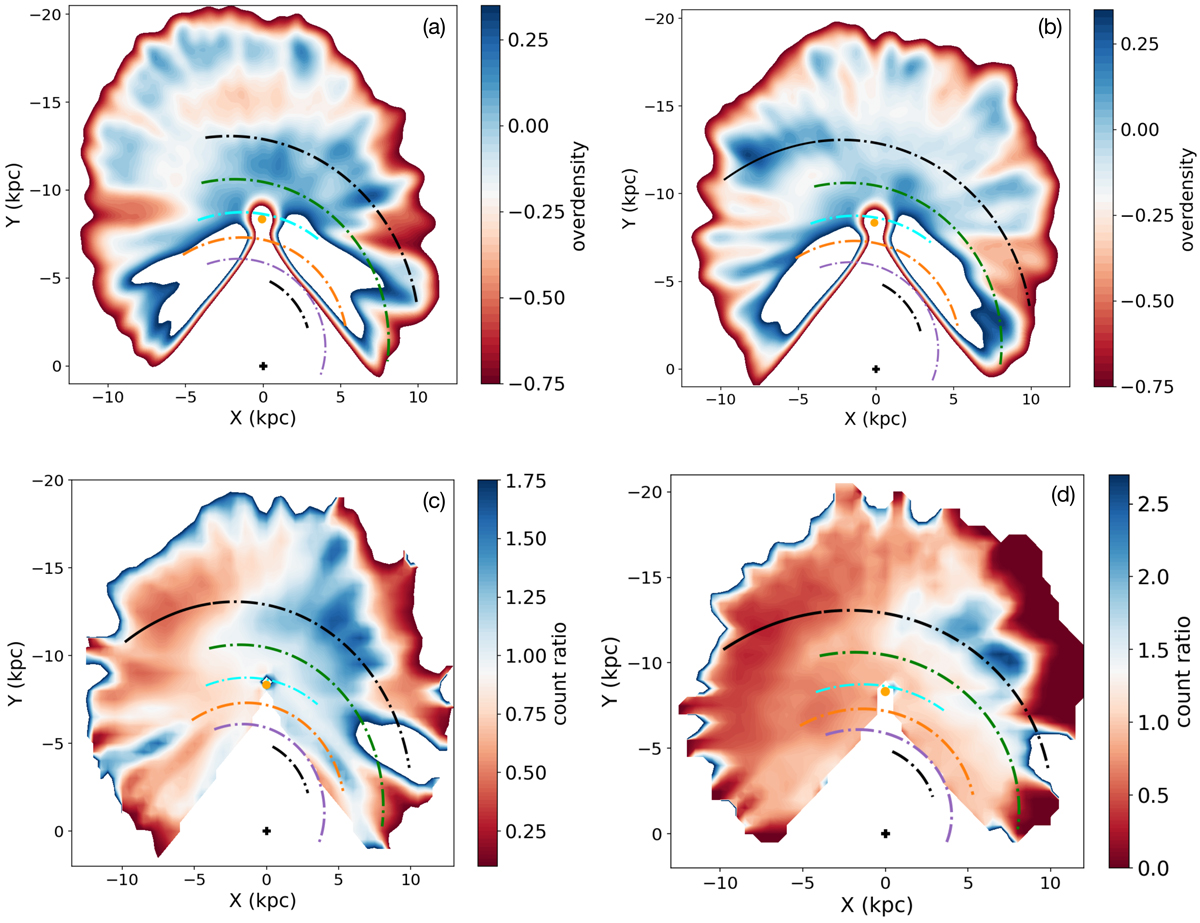
Over-density map of RC stars above (Z > 0) and below (Z < 0) the Galactic plane, in panels a and b, respectively. The bottom panels represent the distribution of the ratio of RC stars above and below the Galactic plane in the galactocentric coordinate system with ℓ range of 40° ≤ℓ≤320° and −10° ≤b ≤ 10° in panel c and |b| = 5° in panel d. The spiral-arm pattern (dot-dashed) follows the same colour codes as in Fig. 5.
Current usage metrics show cumulative count of Article Views (full-text article views including HTML views, PDF and ePub downloads, according to the available data) and Abstracts Views on Vision4Press platform.
Data correspond to usage on the plateform after 2015. The current usage metrics is available 48-96 hours after online publication and is updated daily on week days.
Initial download of the metrics may take a while.