| Issue |
A&A
Volume 673, May 2023
|
|
|---|---|---|
| Article Number | A149 | |
| Number of page(s) | 15 | |
| Section | Interstellar and circumstellar matter | |
| DOI | https://doi.org/10.1051/0004-6361/202244034 | |
| Published online | 24 May 2023 | |
High-angular-resolution NIR view of the Orion Bar revealed by Keck/NIRC2★
1
Université Paris-Saclay, CNRS, Institut d’Astrophysique Spatiale,
91405
Orsay,
France
e-mail: emilie.habart@ias.u-psud.fr
2
Institut de Planétologie et d’Astrophysique de Grenoble (IPAG), Université Grenoble Alpes, CNRS,
38000
Grenoble,
France
3
Institut de Radioastronomie Millimétrique (IRAM),
300 rue de la piscine,
38406
Saint-Martin-d’Hères,
France
4
W.M. Keck Observatory,
65-1120
Mamalahoa Hwy, Kamuela, HI,
USA
5
Department of Physics & Astronomy, The University of Western Ontario,
London ON
N6A 3K7,
Canada
6
Institute for Earth and Space Exploration, The University of Western Ontario,
London ON
N6A 3K7,
Canada
7
Carl Sagan Center, SETI Institute,
339 Bernardo Avenue, Suite 200,
Mountain View,
CA 94043,
USA
8
Institut de Recherche en Astrophysique et Planétologie, Université de Toulouse, CNRS, CNES, UPS,
9 Av. du colonel Roche,
31028
Toulouse Cedex 04,
France
9
Astronomy Department, University of Maryland,
College Park,
MD 20742,
USA
10
Instituto de Física Fundamental (IFF), CSIC,
Calle Serrano 121–123,
28006
Madrid,
Spain
11
Department of Space, Earth and Environment, Chalmers University of Technology, Onsala Space Observatory,
439 92
Onsala,
Sweden
12
LERMA, Observatoire de Paris, PSL Research University, CNRS, Sorbonne Universités,
92190
Meudon,
France
13
I. Physikalisches Institut der Universität zu Köln,
Zülpicher Straße 77,
50937
Köln,
Germany
Received:
16
May
2022
Accepted:
28
June
2022
Context. Nearby photo-dissociation regions (PDRs), where the gas and dust are heated by the far-ultraviolet (FUV) irradiation emitted from stars, are ideal templates with which to study the main stellar feedback processes.
Aims. With this study, we aim to probe the detailed structures at the interfaces between ionized, atomic, and molecular gas in the Orion Bar. This nearby prototypical strongly irradiated PDR are among the first targets of the James Webb Space Telescope (JWST) within the framework of the PDRs4All Early Release Science program.
Methods. We employed the subarcsecond resolution accessible with Keck-II NIRC2 and its adaptive optics system to obtain images of the vibrationally excited line H2 1−0 S(1) at 2.12 µm that are more detailed and complete than ever before. H2 1−0 S(1) traces the dissociation front (DF), and the [FeII] and Brγ lines, at 1.64 and 2.16 µm, respectively, trace the ionization front (IF). The former is a powerful tracer of the FUV radiation field strength and gas density distribution at the PDR edge, while the last two trace the temperature and density distribution from the ionized gas to the PDR. We obtained narrow-band filter images in these key gas line diagnostics over ~40″ at spatial scales of ~0.1″ (~0.0002 pc or ~40 AU at 414 pc).
Results. The Keck/Near Infrared Camera 2 (NIRC2) observations spatially resolve a plethora of irradiated substructures such as ridges, filaments, globules, and proplyds. This portends what JWST should accomplish and how it will complement the highest resolution Atacama Large Millimeter/submillimeter Array (ALMA) maps of the molecular cloud. We observe a remarkable spatial coincidence between the H2 1−0 S(1) vibrational and HCO+ J = 4−3 rotational emission previously obtained with ALMA. This likely indicates the intimate link between these two molecular species and highlights that in high-pressure PDRs, the H/H2 and C+/C/CO transitions zones come closer than in a typical layered structure of a constant density PDR. The H/H2 dissociation front appears as a highly structured region containing substructures with a typical thickness of a few ~10−3 pc.
Key words: infrared: ISM / photon-dominated region / ISM: molecules
Images in FITS format are only available at the CDS via anonymous ftp to cdsarc.cds.unistra.fr (130.79.128.5) or via https://cdsarc.cds.unistra.fr/viz-bin/cat/J/A+A/673/A149
© The Authors 2023
 Open Access article, published by EDP Sciences, under the terms of the Creative Commons Attribution License (https://creativecommons.org/licenses/by/4.0), which permits unrestricted use, distribution, and reproduction in any medium, provided the original work is properly cited.
This article is published in open access under the Subscribe to Open model. Subscribe to A&A to support open access publication.
1 Introduction
Stellar feedback influences star formation activity through molecular cloud dissolution, compression processes, and increased ionization fraction, which slows down ambipolar diffusion. However, the precise nature and importance of all these mechanisms relative to other processes that influence star formation remains largely unknown. Stellar feedback can take the form of radiative heating and pressure, thermal expansion and evaporation, and stellar winds and shocks (e.g., Pabst et al. 2020; Schneider et al. 2020, and reference therein). The combined radiative and dynamical feedback of massive stars on their parental cloud is not yet understood. Therefore, direct observation and quantification of the radiative heating efficiency (e.g., the coupling of gas and dust to the intense stellar-ultraviolet fields) and mechanical energy injection are necessary.
Recent near-infrared (NIR) images obtained with the Gemini telescope at high angular resolution (~0.06−0.11″) revealed, at a spectacular level of detail, unexpected structures within the strongly irradiated molecular cloud at the Western Wall in Carina at a distance of 2.3 kpc (Hartigan et al. 2020). These authors found series of ridges, fragments, and waves with sizes in the ~200–2000 AU range that may result from the complex dynamical and radiative processes that sculpt these systems. Indeed, while regularly spaced ridges that run parallel to the photodissociation front may suggest large-scale magnetic fields are dynamically important (Mackey & Lim 2011), several fragments and waves could resemble Kelvin-Helmholtz instabilities. Berné et al. (2010) reported the presence of a series of five surprisingly regular wavelets (separated by 0.1 pc or 20 000 AU) at the surface of the Orion molecular cloud. These authors proposed that these waves formed by the mechanical interaction between high-velocity plasma and gas produced by massive stars and the dense molecular gas, which provokes hydrodynamical instabilities. Subarcsecond resolution is required to resolve detailed structures even for the nearest regions of massive star formation. This capability now exists with adaptive optics (AO) imaging, and will be further developed and expanded in the near future with James Webb Space Telescope (JWST).
The main goal of the present study is to observe and quantify the stellar feedback in the closest site of ongoing massive star formation: the Orion molecular cloud. This region is located about five times closer than the Carina star forming region. The dominant stellar feedback processes can be probed by observations of photo-dissociation regions (PDRs) where far-ultraviolet (FUV) photons of massive stars create warm regions of gas and dust in the neutral atomic and molecular gas (e.g., for a recent review see Wolfire et al. 2022, and references therein). Nearby, edge-on PDRs such as the Orion Bar are ideal targets because of their wide extension on the sky, bright emission, and proximity, allowing these processes to be probed on a small physical scale. PDRs are particularly bright in the infrared (IR).
However, until now, a very high angular (subarcsecond resolution) IR molecular view of the Orion Bar PDR was missing. In this study, we present observations obtained with Keck/Near Infrared Camera 2 (NIRC2) using AO, which provide the most complete and detailed maps of the complex UV-irradiated region where the conversion from ionized to atomic to molecular gas occurs. We mapped the vibrationally excited line of H2 at 2.12 µm, tracing the dissociation front, and the [FeII] line at 1.64 µm and the Brγ line at 2.16 µm, tracing the ionization front. The proximity of the region1 (414 pc) combined with recent advances in instrumentation allows studies from (sub)parsec scales to the smallest structures of ~100 AU to be conducted for the first time. Observations with AO provide nearly diffraction-limited images in the NIR over a field of view of 1′ in size.
The paper is organized as follows. Our target, the Orion Bar, is described in Sect. 2. The observations and data reduction are described in Sect. 3. In Sect. 4, the spatial morphology of the line intensities is discussed and compared to previous observations. In Sects. 5 and 6, the observed line intensities are corrected for dust extinction and compared to the model predictions. Finally, a short summary and prospects for JWST are given in Sect. 7.
2 The Orion Bar
The Orion Bar, a strongly UV-irradiated PDR, is an escarpment of the Orion molecular cloud (OMC), the closest site of ongoing massive star formation. The bar is illuminated by the O7-type star θ1 Ori C, the most massive and luminous member of the Trapezium cluster at the heart of the Orion Nebula (e.g., O’Dell 2001). The Trapezium cluster creates a blister H II region that is eating its way into the parental cloud. A large cavity has been carved out of the molecular gas and the inner concave structure tilts to form the Orion Bar (Wen & O’dell 1995; O’Dell 2001). Weilbacher et al. (2015) presented Multi Unit Spectroscopic Explorer (MUSE)/Very Large Telescope (VLT) integral spectroscopic data of the central part of the Orion Nebula with an angular resolution of ~0.7–1.2″. These authors derived an extinction map and estimated physical properties (electron temperature and density) of the Orion Nebula HII region. The FUV radiation field incident on the Orion Bar PDR is G0 = 1–4 × 10⁴ in Habing units (e.g., Marconi et al. 1998). Beyond the ionization front (IF), where the gas converts from fully ionized to fully neutral, only FUV photons with energies below 13.6 eV penetrate the cloud. This corresponds to the edge of the PDR. Many previous works have studied the spatial stratification of the Orion Bar PDR. The first PDR layers are predominantly neutral and atomic: [H] > [H2] ≫ [H+]. They display NIR atomic emission lines from low ionization potential elements (Walmsley et al. 2000) as well as carbon and sulfur radio recombination lines (Wyrowski et al. 1997; Cuadrado et al. 2019; Goicoechea & Cuadrado 2021). This warm and moderately dense gas (nH of a few 104 cm−3) is mainly cooled by the very bright far-infrared (FIR) [C+] 158 µm and [O0] 63 and 145 µm fine-structure lines (Tielens et al. 1993; Herrmann et al. 1997; Bernard-Salas et al. 2012; Ossenkopf et al. 2013). The atomic PDR zone also hosts the peak of the mid-IR (MIR) aromatic particle emission (e.g., Bregman et al. 1989; Sellgren et al. 1990; Tielens et al. 1993; Giard et al. 1994; Knight et al. 2021) Schirmer et al. (in prep.).
At about 10–15″ (or 0.02–0.03 pc) from the IF (at AV ≃ 0.5–2 mag of visual extinction into the neutral cloud), the dissociating FUV photons are sufficiently attenuated and most of the hydrogen becomes molecular2 (e.g., van der Werf et al. 2013). This corresponds to the dissociation front (DF) where the H/H2 transition takes place. The DF displays a forest of IR rotational and vibrationally excited H2 lines (e.g., Parmar et al. 1991; Luhman et al. 1994; van der Werf et al. 1996; Allers et al. 2005; Shaw et al. 2009; Zhang et al. 2021), including FUV-pumped levels up to υ = 12 (Kaplan et al. 2017, 2021) and HD rotational lines (Wright et al. 1999; Joblin et al. 2018). FUV-pumped H2 drives the formation of molecular ions such as CH+ and SH+ through reactions of C+ and S+ with vibrationally excited H2 (e.g., Goicoechea et al. 2017; Parikka et al. 2017; Lehmann et al. 2022, and references therein). Analysis of the IR H2 and 21 cm H I lines suggests warm temperatures (Tk ≃ 400–700 K) at the DF. Using stationary PDR models (i.e., PDR models with stationary chemistry and without dynamics), the gas density in the atomic gas of nH = 4–5 104 cm−3 is consistent with the [OI] and [CII] line emission and the separation between the IF and DF (Tielens et al. 1993; Hogerheijde et al. 1995; Marconi et al. 1998).
The IF and DF separation also depends on the dust extinction. Larger grains than those found in diffuse ISM that have lower FUV absorption cross sections need to be invoked in isobaric PDR models in order to be consistent with the observed IF and DF separation of ~ 10–15″ (e.g., Allers et al. 2005). Reduction in the FUV attenuation cross-section is in agreement with the recent work of Schirmer et al. (in prep.), who modeled dust emission and extinction throughout the Orion Bar PDR. Analyzing the Spitzer and Herschel observations with the radiative transfer code SOC (Juvela 2019), together with the dust THEMIS model (Jones et al. 2013, 2017) and Schirmer et al. (in prep.) found that nano-grains are strongly depleted compared to diffuse ISM (by a factor ≥10), leading to a FUV attenuation reduction, and a minimum grain size that is larger than in the diffuse ISM. In their model, the gas density is estimated to be about 4 104 cm−3 at the MIR aromatic nano-dust emission peak, and about 1.5 105 cm−3 on average between the MIR emission peak and the H2 emission peak. This is consistent with previous estimates.
Beyond the DF, between AV = 2 and 4 mag, the C+/C/CO transition takes place (Tauber et al. 1995) and the PDR becomes molecular. Some observations and models suggest the presence of relatively large (0.01–0.02 pc) high-density clumps (nH = 106–107 cm−3) in the molecular PDR (e.g., Burton et al. 1990; van der Werf et al. 1996; Young Owl et al. 2000; Lis & Schilke 2003; Andree-Labsch et al. 2017). These over-dense components must be embedded in a lower density medium mainly responsible for the extended PDR emission. Alternatively, the observed H2 and high-J CO line emission close to the DF may be explained by a roughly isobaric PDR, at high thermal pressure Pth/k ≈ 108 cm−3 K (e.g., Allers et al. 2005; Joblin et al. 2018). We note that high density and pressure appear as a common feature in high-FUV field PDRs, as demonstrated by a number of observations (e.g., Ossenkopf et al. 2010; Sheffer et al. 2011; Köhler et al. 2015; Wu et al. 2018). In the high pressure isobaric model, constant pressure from the atomic to the warm molecular region results in an atomic region and a very narrow emission for the warm molecular tracers. In the Joblin et al. (2018) model with P=2.8 108 cm−3 K the atomic region had a size of ~3.5″ while the emission zone of the H2 (1−0) S(1) line has a width of ~0.25″. The predicted atomic region width is nevertheless significantly smaller than the one observed (~ 10–15″) and the very narrow molecular emission has been unresolved in most tracers until now.
While most of the previous molecular studies relied on observations of modest angular resolution, Atacama Large Millimeter/submillimeter Array (ALMA) has provided ~1″ resolution images of the molecular emission (Goicoechea et al. 2016). Instead of a homogeneous PDR with well-defined and spatially separated H/H2 and C+/C/CO transition zones, ALMA revealed rich small-scale (~0.004 pc) over-dense structures (akin to filaments and globules), sharp edges, and bright emission from an embedded proplyd (object 203–506; Champion et al. 2017). These observations have challenged the traditional view of PDRs (and their models, e.g., Kirsanova & Wiebe 2019) and revealed a steeply varying interface between the atomic and the molecular gas (Fig. 1c, Goicoechea et al. 2016). The observed over-dense substructures may have been induced by UV-radiation-driven compression (Gorti & Hollenbach 2002; Tremblin et al. 2012). Advection of the molecular gas through the DF has been suggested by CO emission observed by ALMA in the form of globules or plumes apparently extending into the atomic gas (Goicoechea et al. 2016).
Recent FIR observations of the dust emission polarization from the Orion Bar PDR suggest a relatively modest plane-of-the-sky magnetic field strength of B0 ≃ 300 µG (e.g., Chuss et al. 2019; Guerra et al. 2021). Magnetic pressure of 3 × 10⁷ K cm−3 (comparable to the ambient and inter-clump thermal pressure of 1–3 × 10⁷ K cm−3) may therefore also play a role in the PDR dynamics (e.g., Pellegrini et al. 2009; Pabst et al. 2020).
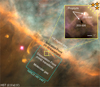 |
Fig. 1 Hubble Space Telescope WFPC2 mosaic of the Orion Bar (Credit: NASA/STScI/Rice Univ./C.O’Dell et al. - Program ID: PRC95-45a). The NIRC2 wide camera FoV is shown with the cyan square. The yellow square zooms into the two proplyds lying in the targeted FoV. |
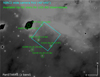 |
Fig. 2 PanSTARRS (z band) image showing the NIRC2 wide camera FoV (cyan square, 40″ × 40″) centered on RA = 05 : 35 : 20.662, Dec = −05 : 25 : 19.38 (J2000). The green circles enclose tip-tilt stars that can be used to perform the LGS observations. |
3 Observations and data reduction
3.1 Observations
On December 4, 2020 (Program ID N004), we used the NIRC2 wide field camera in combination with the Keck-II AO Laser Guide Star (LGS) system to observe a representative field-of-view (FoV) of 40″ × 40″ of the Orion Bar centered on RA = 05:35:20.662, Dec = −05:25:19.38 (J2000) with a pixel size of 0.04″, as illustrated in Figs. 1 and 2. This instrumental setup provides the optimal combination of FoV and diffraction-limited imaging capabilities to fulfill our science goals. The FoV was rotated by 52.5° (north to east). Observations were obtained in the narrow-band filters H2 υ = 1–0 (λc = 2.128 µm, ∆λ = 0.034 µm), [FeII] (λc = 1.645 µm, ∆λ = 0.026 µm), and Br γ (λc = 2.168 µm, ∆λ = 0.0326 µm). We also obtained observations in the Kcont (λc = 2.271 µm, ∆λ = 0.033 µm) and Hcont (λc = 1.580 µm, ∆λ = 0.023 µm) filters to subtract the continuum from the H2 υ = 1−0, Br γ, and [FeII] line maps, respectively.
Figure 2 shows the different point sources within 60″ of the center of the region that can be used as tip-tilt stars for the LGS system. The executed observation sequence was a five-point dither pattern using a ~1″ dither step with H2 υ = 1−0 and Kcont consecutive images on each dither position. The same sequence was executed for the [FeII] and Hcont filters, and the Br γ and Kcont filters. The exposure time per image was 150 s (15 s × 10 coadds) in multiple-correlated double-sampling mode with eight reads per coadd.
We integrated 750 s on-source for each filter. The observing strategy was successful although it was slightly challenging because of the variable nebular background on the tip-tilt star. Indeed, the nebular background can significantly increase the effective magnitude of the tip-tilt star, which in turn can degrade the AO correction. In an environment such as the Orion Bar, with its complex background, the automatic AO acquisition sequence may need to be modified to manually take a background for the tip-tilt sensor away from the nebular region. Such manual background acquisition reduces the efficiency of the AO observations. We took images in the H2 υ = 1−0 and Kcont filters with V377 Ori as the tip-tilt star. However, due to the high nebular background, we used θ2 Ori A as the tip-tilt star for the [FeII]/Hcont and Br-gamma/Kcont sequences. The factor of ~2 larger separation between θ2 Ori A and the science FoV with respect to V377 Ori was compensated by the fact that θ2 Ori A is 7.5 mag brighter on the wave front sensor. Our observations clearly benefited from good seeing conditions and AO correction (K-band Strehl ratio ~30%). The full width at half maximum (FWHM) of the point-spread function (PSF) was ~0.11″. For comparison, JWST will achieve a resolution of 0.085″ in the K-band. In summary, these unusual bright extended source observations for NIRC2 were successful.
3.2 Data reduction
The basic data reduction of the imaging frames (i.e., dark correction, flat field, sky substraction) were performed using standard procedures for NIR imaging with a modified version of the reduction pipeline from the UCLA Galactic Center group based on Pyraf (Lu et al. 2009). The set of frames slightly offset in telescope position were realigned and co-added to produce the final image. We calculated star centroids and offsets from one frame to another using the IRAF task IMALIGN in order to line up the images. Thus, the images were co-added by weighted median which suppresses the ghosts and the diffraction spike due to the bright θ2 Ori A star. The final images are of dimension of 38.64″ × 38.88″ or 0.08 pc × 0.08 pc at 414 pc.
In order to overcome the telescope pointing error (which is of the order of 0.5″) and determine the proper World Coordinate System (WCS), we matched the stars in our NIRC2 image to Gaia coordinates. We used the Gaia catalog early data release 3 (EDR33).
For the flux calibration, we determined the conversion factor between the detector counts and physical units using previous observations of the H2 1−0 S(1) line obtained with NTT/SOFI (Walmsley et al. 2000). We convolved the continuum-subtracted Keck/NIRC2 H2 line emission to the beam of the NTT/SOFI observation (seeing limited ~1″). We estimated the flux conversion factor in regions of the maps with high S/N, and the reduced science maps (in analog digital units per second) were multiplied by this conversion factor to get the flux-calibrated science maps in erg cm−2 s−1 sr−1. We assigned an accuracy of about 25% to the measurements of the line intensity. The same conversion factor was used for the H2 υ = 1−0, Br γ and [FeII] lines maps because they were obtained with almost the same weather conditions and the detector response is similar. We compared the fluxes of each of the lines we obtained with those measured by Walmsley et al. (2000) through the PDR (see their position C, Table 1) and found good agreement considering the different spatial resolution. Maps that are not continuum-subtracted were divided by the filter width and are in units Erg cm−2 s−1 sr−1 µm−1. We must underline that we could have flux-calibrated the observations using the photometric standard FS-7 observed in the H and Ks filters. However, we would have obtained similar uncertainties due to the sky background variations between the standard star observations and the science observations, which were significant in the K band.
4 Spatial distribution
In this section, the spatial morphology of the hydrogen Brackett γ, iron, and molecular hydrogen lines are presented and compared to previous observations.
4.1 Brγ and iron lines
The maps obtained in the Brγ and [FeII] filters and the continuum-subtracted emission are shown in Fig. 3, while the H2 filter maps are shown in Fig. 4. Most of the structures seen in these lines and the continuum are very similar to those visible in the Hα HST map (Fig. 1). The ionization front is clearly seen in the Brγ and [FeII] line emission maps. However, there are some differences between the Brγ and [FeII] line emission morphologies; in particular, in the area surrounding the two identified proplyds near the Bar, 203-506 and 203-504 (Bally et al. 2000 and located in the yellow squares in Fig. 1). Both of these proplyds emit in [FeII] along with bright streamers, whereas only the proplyd 203-504 shows strong Brγ emission as further described in Sect. 4.5.
The surface brightness profiles measured in the [FeII], Brγ, and H2 lines along four cuts perpendicular to the Bar are shown in Fig. 5. These cuts use a three-pixel average corresponding to the typical FWHM of the PSF. Cut 1 goes through the left edge of bar, cut 2 through the position of the JWST/NIRSpec-IFU and MIRI-IFU mosaics of the ERS program (see Fig. 3 in Berné et al. 2022), and cuts 3 and 4 through the right edge of the bar (see Fig. 5). To investigate the stratification of the interfaces from ionized to molecular emission, we also constructed averaged emission cut over the entire FoV and perpendicular to the Orion Bar. As expected for a PDR seen edge-on, we found that the H2 emission is displaced further into the cloud than the Brγ and [FeII] line emission. A precise determination of the distance between the IF delineated by the [FeII] and Brγ lines and the DF delineated by the H2 line can be obtained. From the averaged emission cuts, we estimated that the offset between the IF and the main peak of the H2 vibrational emission is between 12 and 12.5″ (0.024–0.025 pc). Finally, the [FeII] and Brγ surface brightness profiles also show extended emission towards the PDR. This emission may originate in the flattened region beyond the bar that is still illuminated directly by the ionizing star (Wen & O’dell 1995; O’Dell 2001).
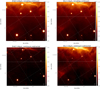 |
Fig. 3 Integrated intensity maps of the [FeII] and continuum-subtracted [FeII] line emission (left column) and of the Brγ and continuum-subtracted Brγ line emission (right column). Units are erg cm−2 s−1 sr−1 µm−1 for the [FeII] and Brγ maps and erg cm−2 s−1 sr−1 for the continuum-subtracted line emission map. The horizontal dashed lines indicate the average position of the ionization and dissociation fronts (as determined from the averaged emission cut over the entire FoV presented in Fig. 5). |
4.2 Vibrationally excited H2 line
The maps obtained in the H2 2.12µm filter and the continuum-subtracted H2 line emission are shown in Fig. 4 and also in Fig. 6 for comparison with the ALMA HCO+ J = 4−3 line emission map (see Sect. 4.4). In the H2 line emission map, several bright H2 emission peaks are spatially resolved and show small-scale structures. The H/H2 dissociation front appears highly structured with several ridges and extremely sharp filaments with a width of 1 to 2″ (0.002–0.004 pc or 400–800 AU, see Figs. 4 and 5). Ridges and filaments run parallel to the dissociation front but a succession of bright substructures in H2 is also observed from the edge of the DF towards the molecular region. The H2 emission peaks appear in an area that starts at about 10″ from the IF and up to 20″ and even 25–30″ in some places from the IF (see Figs. 4 and 5). The bright substructures result in several peaks in the H2 brightness profiles shown in Fig. 5 obtained along the cuts perpendicular to the Orion Bar. The peaks are roughly spaced by a few arcseconds (~0.005–0.01 pc or ~1000–2000 AU). The surface area occupied by the bright substructures (ridges, filaments), that is, with H2 line intensity >2 × 10⁻⁴ ergs−1 cm−2 sr−1, corresponds to about 40–45% of the H2 emission zone in the Bar.
As the H2 emission is very sensitive to both the FUV radiation field and the gas density (as explained below), these very narrow and bright substructures must be due to dense, directly irradiated material. Toward more tenuous material, the H2 emission is spatially much more extended and weaker. The multiple H2 emission peaks along and across the bar may be associated with a multitude of small, highly irradiated and dense PDRs. A single edge-on dense PDR produces one narrow H2 emission peak. The slight tilt of the bar along the line of sight combined with the presence of over-dense structures may explain the observed complex emission distribution, and especially the succession of H2 peaks across the bar.
The intensity variations in the different H2 emission peaks ranging from ~2 to ~10 × 10−4 erg s−1 cm−2 sr−1 (Fig. 5) may result from a combination of effects due to the local gas densities, geometry, and dust extinction. PDR models show that for the conditions prevailing in the Orion Bar, the intensity of the H2 υ = 1−0 S(1) line is approximately proportional to the gas density (e.g., Burton et al. 1990). At equilibrium between the formation of H2 and the photodissociation of H2 by FUV flux, the intensity of the 1−0 S(1) line is proportional to RfnHN(H0) where Rf is the H2 formation rate, nH is the total hydrogen gas density, and N(H0) is the column density of atomic H atoms from the PDR edge. For low values of nH/G0 (<40 cm−3), which is the case in the atomic zone of the Orion Bar with G0 ~ 104 and nH=104–105 cm−3, the H0/H2 is driven by dust opacity and N(H0) is a constant equal to a few 1021 cm−2. The intensity is therefore linearly proportional to the density. Moreover, the H2 and HCO+ J = 4−3 emission show a remarkably similar spatial distribution, as shown in Fig. 6 and further described in Sect. 4.4. This rotational line is a good indicator of dense gas (Goicoechea et al. 2016).
The dense substructures seen in H2 may be surrounded by a lower density gas component producing extended emission. In the H2 data, more widespread and extended emission (with an intensity of about 2 × 10⁻⁴ erg s−1 cm−2 sr−1) seems to be observed at the photodissociation front at about 10–15″ (0.02–0.03 pc) and up to 20–30″ (0.04–0.06 pc) from the IF. Moreover, the H2 map and brightness profiles show some emission in front of the DF (see Fig. 5 and Table 1). Part of this emission likely originates from the surface of the Orion molecular cloud-1 (OMC1). This surface is perpendicular to the line of sight and is illuminated by the Trapezium cluster, making it a face-on PDR. The emission from this background face-on PDR was also observed with Herschel in other PDR tracers, especially in high-J CO lines (Parikka et al. 2018) and [OI] 63 and 145 µm and [CII] 158 µm (Bernard-Salas et al. 2012). An increase in the H2 emission at the IF is also observed. This was also visible in the previous data of Walmsley et al. (2000) and could originate from the background molecular cloud.
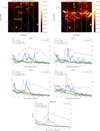 |
Fig. 5 Top row: superposition of the four cuts perpendicular to the Orion Bar described in Sect. 4.1 on the [FeII] 1.64 µmand H2 2.12 µm continuum subtracted emission line maps. Cuts 1, 2, 3, and 4 are positioned from left to right. The square areas are used to compute the line intensities in the key regions presented in Table 1. Second and third rows: H2 (blue), Brγ (red) and [FeII] (green) line intensity (in erg s−1 cm−2 sr−1) profiles shown as a function of the distance from the IF for each cut along with the HCO+ line integrated intensity profile (in K km s−1, grey). The intensity profiles of the Brγ and [FeII] lines have been scaled by the factors indicated in the legends. The line intensities have not been corrected for dust extinction. Bottom row: Averaged emission cut calculated by taking the mean over the entire FoV and perpendicular to the Orion Bar. The vertical dashed lines indicate the average position of the IF, DF, and HCO+ peaks. |
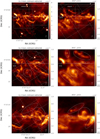 |
Fig. 6 Left panels: integrated intensity maps (continuum-subtracted) of the H2 1−0 S(1) line emission in erg cm−2 s−1 sr−1. Right panels: integrated intensity maps of the HCO+ J = 4−3 lines in K km s−1. |
Observed and predicted line intensities in erg cm−2 s−1 sr−1 in the ionized, IF, atomic, DF, and molecular regions.
4.3 Comparison with previous H2 observations
Our Keck observations convolved at the angular resolution of ~1″ of the previous SOFI/NTT observations by Walmsley et al. (2000) show good agreement in terms of line distribution and intensity (see Table 1). It can be noted that in the SOFI/NTT observations, the brightest substructures were already observed but not spatially resolved. The TEXES observations of the pure rotational H2 0-0 S(1) and S(2) lines by Allers et al. (2005), with a resolution of ~2″, cover the southwest part of our map. The comparison of these observations with the H2 1−0 S(1) line map obtained previously by van der Werf et al. (1996) show that the spatial distribution of the pure rotational lines and the vibrationally excited line agree in remarkable detail (see Fig. 2 in Allers et al. 2005). This is predicted by high pressure models (Allers et al. 2005; Joblin et al. 2018), where a separation between the H2 lines is expected to be very small (≲0.5″). We would therefore expect to observe an overall spatial coincidence on the whole Keck map. Nevertheless, detailed variations are expected because the pure rotational lines that result from collisional excitation have a different dependence on the local physical conditions. Future JWST-ERS observations (Berné et al. 2022) will allow such an investigation in the parts of our maps observed with the IFU-MIRI spectroscopy.
4.4 Comparison between H2 and HCO+ from ALMA
In this section, we present our analysis of the distribution and correlation of the H2 line emission with the ALMA observation of the HCO+ J = 4−3 line. Considering the position of the compact sources (e.g., proplyds 203–506), the ALMA observations showed an offset to our Keck observations in coordinates of RA = −0.15″ and Dec = 0.75″. By correcting this offset, a good overlap of the position of the compact sources and of the bar is obtained.
In Fig. 6, we compare the maps obtained in the H2 1−0 S(1) and HCO+ J = 4−3 lines across the same field of view. The middle and bottom figures show zooms into two parts of the map so that we can compare the spatial distribution of the emission from each of the detected substructures in detail. Most of the substructures are common to both maps and show a very similar distribution. Because of a high dipole moment and a high critical density, the HCO+ 4−3 line (ncritical of a few 106 cm−3) is a good proxy for the gas density (Goicoechea et al. 2016); its integrated intensity is roughly proportional to the density in the nH = 104–106 cm−3 range. The average density that reproduces the mean HCO+ towards the dissociation front (at about 15 from the IF) is about nH = 0.5–1.5 106 cm−3. Therefore, some of the densest portions of the bar lie along the dissociation front. We note that the small H2 and HCO+ structures discussed here, which are localized at the DF, are shifted by about ~20″ relative to the bigger (5″–10″) condensations seen more inside the molecular cloud (Young Owl et al. 2000; Lis & Schilke 2003).
Although there is a very good spatial coincidence between the H2 and HCO+ substructures, the H2 line emission decreases faster in the bar than the HCO+ line emission (see Fig. 5). This can be explained as follows. Firstly, the vibrationally excited H2 line is more sensitive to the FUV field flux and the most intense H2 emission must come from the transition region between the diffuse and very dense medium where the FUV radiation is not yet attenuated. The FUV shielding produced by the ridge of high-density substructures may significantly decrease the vibrational excited H2 in the deeper regions. Secondly, extinction due to dust in the Orion Bar and to foreground dust may affect the apparent morphology of the NIR H2 images. Small-scale dust extinction differences could in fact result in morphological differences between the NIR and millimeter-wave images. Dust extinction effects on the line intensities are discussed in Sect. 5.
The overall remarkable spatial coincidence between the H2 and HCO+ line emission shows that they both come from high densities but also indicates their strong chemical link. Detection of both bright HCO+ and CO emission by ALMA towards the H2 vibrational emission layers (Fig. 2c in Goicoechea et al. 2016) suggests that the C+/CO transition nearly coincides with the H/H2 transition. This fact was predicted in Joblin et al. (2018), where the best-fitting Orion Bar model has a separation between these transitions of ~0.25″. We obtained a precise determination of the average offset between the peak of the H2 vibrational emission (delineating the H/H2 transition) and the edge of the observed HCO+ emission (delineating the C+/C/CO transition). From the averaged emission cuts, we estimated that this average offset is less than 1″, namely about ~0.6″ (or 0.0012 pc). However considering that the angular resolution of the ALMA data is ~1″, higher angular resolution observations are required to measure the exact value of this offset. The presence of a large quantity of irradiated H2 may have important consequences for the chemical structure. Due to the high densities and enhanced H2 gas heating via formation and collisional de-excitation of FUV pumped levels, the chemistry is triggered by high temperature and FUV pumped levels. Endothermic reactions and reactions with energy barriers become faster (Agúndez et al. 2010; Nagy et al. 2013). Reactions of H2 with abundant atoms and ions, such as C+, shift the carbon-bearing molecular gas towards the cloud edge.
We note that although a spatial coincidence is observed between the H2 and HCO+ over-dense substructures, a spatial shift of the emission peak is measured for several substructures (e.g., substructure 3 in the middle panels and substructures 2 and 3 in the bottom panels of Fig. 6). This may essentially result from the fact that the two emission lines vary differently with the local conditions (FUV field flux and gas density) and that the H2 NIR line is affected by dust extinction. The most important differences in the spatial distribution of the H2 and HCO+ emission are found in the atomic region. In fact, the brighter structures seen in the atomic regions in HCO+ (like globulettes) are faintly visible in H2 ro-vibrational emission (e.g., the substructures denoted 1 and 6 in the middle panels and the substructure denoted 1 in the bottom panels of Fig. 6). These structures are probably located in the background or foreground. Indeed, the emission velocity of these HCO+ structures (υlsr = 8–9 km s−1) is more consistent with emission from the background OMC1 than from the bar (υlsr = 10.5 km s−1). Some extended H2 line emission seen in the atomic zone to the southwest part of the bar (see bottom panel of Fig. 6) also has no counterpart in the HCO+ or CO line emission maps. Finally, plume-like CO features seen with ALMA in the atomic zone by Goicoechea et al. (2016), which may be advected from the surface of the molecular cloud, have no evident correspondence with the H2 emission structures observed by Keck/NIRC2.
4.5 Proplyds and collapsing protostars
We are able to spatially resolve the FUV-irradiated Orion Bar PDR edge but also additional compact sources corresponding to over-dense irradiated substructures such as proplyds near the IF, and perhaps collapsing protostars near the DF. In the following, we briefly describe the observations toward these sources.
4.5.1 Proplyds
Figure 7 shows proplyds 203-504 and 203-506 (Bally et al. 2000) which are present in the FoV of our Keck/NIRC2 observations. The star of 203-504 is detected in all filters, but the disk or envelope is not clearly identifiable in these images. The 203-506 proplyd is clearly visible in emission in both the H2 and [FeII] lines, whereas it is not detected in the Brγ line. The absence of Brγ emission could be explained by the fact that 203-506 is supposed to be embedded in neutral atomic gas (Champion et al. 2017), as it is (1) located behind the IF of the Orion Bar (with respect to the Trapezium cluster) and (2) seen in silhouette in the continuum images as well as in the Hα HST map. However, some aspects remain puzzling. One may expect that in order to appear as dark in an emission line, the proplyd should have an emission background. For example, while the proplyd is dark in [OIII] 5007 Å, it does show emission on its outside in [OI] 6300 Å (Bally et al. 2000). Therefore, some stellar radiation, likely from the θ2 Ori A star, is reaching the proplyd. O’Dell et al. (2017) showed that foreground objects near this location are illuminated by θ2 Ori A. Being seen in emission on the northwest boundary, that is, in the direction of θ1 Ori C, the 203-506 pro-plyd remains puzzling. The coming PDR4All JWST data (Berné et al. 2022) will bring additional clues that will help us to better understand this issue.
The H2 emission appears to have a similar morphology to the [OI] 6300 Å line observed by Bally et al. (2000). This is expected because both lines trace warm neutral gas (~1000 K) near the dissociation front, inside the dense PDR that is created at the disk surface (Champion et al. 2017). The [FeII] line shows a very different morphology, with an elongated structure perpendicular to the proplyd disk, and is reminiscent of a jet, such as those identified for proplyds by Bally et al. (2015). The [FeII] emission would then be associated with irradiated shocked gas.
4.5.2 Over-dense substructures
Numerous over-dense small structures (1–2″) appear in the H2 and HCO+ emission that could be self-gravitating or transient turbulently compressed features or compressed by FUV photo-evaporation (Gorti & Hollenbach 2002; Tremblin et al. 2012). Recently, Röllig & Ossenkopf-Okada (2022) showed that the intensity levels of the HCO+ emission map as well as its spatial distribution are consistent with predictions from nonstationary, clumpy PDR model ensembles. Whether these structures can become star-forming clumps (e.g., by merging into massive clumps) is uncertain. Gravitational collapse does not appear to be taking place according to their density distribution (no high-density power-law tail; Goicoechea et al. 2016). Moreover, the mass of a cylinder with a density nH ~ 106 cm−3, a width of 1″, and a length of 2″–6″ is <0.005 M⊙ (Goicoechea et al. 2016), which is much lower than the virial and critical masses needed to make them gravitationally unstable (approximately 5 M⊙ from the inferred gas temperature, density, and velocity dispersion, Inutsuka & Miyama 1997). However, the very bright substructure located in the northeast of our map and denoted “clump” in Fig. 6 shows a very particular structure (with a size of ~1000 AU), likely a young stellar object candidate (Goicoechea et al., in prep).
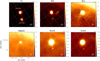 |
Fig. 7 Zoom into proplyds in the H2 2.12 µm, [FeII] 1.64 µm, and Brγ 2.16 µm lines (continuum substracted), as well as, in the Hcont and Kcont filters with the Hα emission in addition using the HST observations from https://archive.stsci.edu/prepds/orion/acs_displaypage.html which was adjusted in positions. |
5 Line intensities and extinction correction
5.1 Line intensities in the key zones
Table 1 gives the intensities of the [FeII], Brγ, and H2 lines measured toward the ionized region, the IF, the PDR atomic region, the DF, and the molecular region. The line intensities of each of these characteristic regions have been estimated in the 2″ by 2″ square areas shown in Fig. 5 (top panels). The areas for the atomic, DF, and molecular zones located at about 5.5″, 12.5″, and 21″ from the IF, respectively, are positioned within the FoV of the NIRSpec-IFU and MIRI-IFU mosaics (see Fig. 3 of Berné et al. 2022), which are along the direction of cut 2 in Fig. 5. On the other hand, the areas chosen for the ionized and IF regions are not aligned along the JWST mosaics (i.e., cut 2) because the Keck maps do not entirely cover these ionized gas and IF regions along the JWST mosaic (i.e., cut 2). We therefore chose areas for the ionized gas and IF regions further southwest (towards the direction of cuts 3 and 4; see Fig. 5).
Comparison with previous measurements of the intensities of these lines with SOFI/NTT by Walmsley et al. (2000) in the ionized, IF, and DF regions are given in Table 1. The measurements are in good agreement within a factor of about 2 for the [FeII] and Brγ lines at the IF and for the H2 line at the DF. However, we find some larger differences for Brγ in the HII and DF regions and H2 in the HII and IF regions. This might be mostly due to the fact that the position regions of Walmsley et al. (2000) (shown as A, B, C in their Fig. 1) do not correspond to our positions. Their HII and IF regions are outside of the Keck/NIRC2 FoV.
5.2 Extinction correction
Corrections for extinction due to the foreground dust and internal dust in the bar itself of the line intensities were estimated and reported in Table 1. The foreground visual extinction AV produced by the Veil was estimated to be not greater than about 2 mag by O’Dell & Yusef-Zadeh (2000) based on a radio-to-optical surface brightness comparison. Using flux measurements of the Balmer lines (Hα to Hβ flux ratio), Weilbacher et al. (2015) estimated that the foreground extinction is about AV ~ 1.3 mag (or AK ~ 0.15 mag) toward the ionized gas in the line of sight of the Orion Bar (see their Fig. 15). The foreground dust structure appears smooth and devoid of significant substructure. By this dust screen, the line emission will be attenuated by  with τλ = 0.921 Aλ being the optical depth at the wavelength of the line. To adopt a dust reddening appropriate for Orion, we followed Goicoechea et al. (2015) and used the extinction curve of Cardelli et al. (1989) as refined by Blagrave et al. (2007) with Rv = Av/E(B – V) = 5.5. The reddening factors are 0.216, 0.143, and 0.138 at 1.64, 2.12, and 2.16 µm, respectively. Given this degree of foreground extinction, we estimated that the [FeII], Br γ, and H2 lines are approximately 23%, 15%, and 16% brighter, respectively, if foreground extinction correction is taken into account.
For the H2 line in the PDR, internal extinction due to the dust in the bar itself may significantly attenuate the emission. An additional magnitude of extinction due to dust in the bar between the ionized gas and the region of excited H2 may result in a stronger increase in line intensity. In order to estimate this extinction, we assumed that the column density of gas along the line of sight is equal to the column density between the IF and the region of excited H2. We therefore used the density profile toward the bar as constrained from comparison between Spitzer and Herschel observations and a radiative transfer code with the THEMIS dust model (Schirmer et al., in prep.). The corresponding calculated column density is 1.5 × 10²¹ H cm−2 from the IF to the beginning of the H2 emission (at 10″ or 0.02 pc from the IF) and 10 × 1021 H cm−2 from the IF to the end of the H2 emission (at 20″ or 0.04 pc from the IF). Adopting the same dust reddening as described before from Cardelli et al. (1989) and AV/NH = 3.5 × 10⁻²² mag cm−2, we estimated an extinction of AV = 1 to 4 or AK = 0.13 to 0.54. If this internal dust extinction correction is taken into account and a correction factor of  is applied, the H2 line is approximately 12% to 40% brighter. Regarding the assumed extinction law, the Cardelli extinction curve with RV = 5.5 is similar to that calculated by the THEMIS dust model in the Orion Bar with nano-grain depletion (Schirmer et al., in prep.). For this model, the reddening factors are 0.224, 0.139, and 0.134 at 1.64, 2.12, and 2.16 µm, respectively. The correction factor on the line intensities assuming their extinction law will differ by less than 3%.
We must underline that if we assume that the gas and the dust are well mixed in the H2 emission zone, one must apply a correction factor of  (e.g., Thronson et al. 1990). Assuming a visual extinction of AV = 3 for the total H2 emission zone (including the succession of H2 peaks) as calculated using the dust density model, we computed the corresponding correction factor. This visual extinction is equivalent to considering a gas density of 1–1.5 105 cm−3 and a length of 0.02 pc (as the width of the H2 emission zone in Fig. 5). This visual extinction corresponding to a large column density of UV-pumped H2 can be considered an upper limit. With these assumptions, the line is approximately 18% brighter after extinction correction in the H2 emission zone. Considering the increase of 12% due to the extinction correction of the atomic zone from the IF to the beginning of the H2 emission zone, the line will be 30% brighter. This is relatively close to what we found previously assuming no mixing, namely an increase in brightness of 40% (due to the internal extinction correction from the IF to the end of the H2 emission zone).
In Table 1 and for comparison to the model predictions in the following section, we assumed that the H2 line will be 56% brighter in total after correcting for foreground (16%) and internal extinction (40%) in the bar. Our total (foreground and internal) extinction corrections for H2 are therefore about AK = 0.17 + 0.54 = 0.71 which is very close to that derived by Kaplan et al. (2021) of AK = 0.72 ± 0.1. These authors used an effective way to measure extinction which consists of comparing the observed-to-theoretical H2 ro-vibrational line flux ratios from pairs of lines arising from the same upper level that are widely separated in wavelength. The errors on AK were estimated by these latter authors from the assumptions made on the color correction. Their IGRINS observations at high spectral resolution were made along a slit positioned across the bar and centered on the southwest of the bar (corresponding to the position of substructure 5 in the bottom zoom of Fig. 6). However, we must underline that their extinction measurement is lower than the values derived by Luhman et al. (1998) also using H2 rovibrational transitions with common upper levels but observed along a slit passing roughly through the center of our Keck maps. Luhman et al. (1998) found average values of AK=2.6±0.7 and 2.3±0.8 respectively for the H2 peak and beyond. The H2 line is approximately 90% brighter if an extinction correction of AK = 2.6 (or AV = 19) is taken into account. The internal extinction might be variable depending on the sightline and the density of the region crossed. From the radio and NIR H2 line maps, Walmsley et al. (2000) suggest that extinction can vary rapidly as a function of position in the bar. Specifically, precise spatial estimates of the internal PDR extinction are needed. This will be possible with the high-angular-resolution NIR line maps that will be obtained with JWST’s NIRCAM and NIRSpec IFUs. This will tightly constrain how dust extinction affects the apparent morphology of the H2 line emission.
In summary, we estimated that the [FeII], Br γ, and H2 lines will be ~23%, 15%, and 16% brighter if foreground extinction correction is taken into account. For the H2 line in the PDR, internal extinction due to the bar itself may also significantly attenuate the emission and the line could be about ~56% brighter in total. However, the extinction might vary in the bar due to density variations along the line of sight.
6 Comparison to model predictions
To guide our interpretation, in this section, we compare our extinction-corrected observations of the emission gas lines to the model predictions in the HII region, the IF, the atomic region, the DF, and the molecular zone. The model predictions are those we used to make the template spectra described in Berné et al. (2022) and to predict line intensities for the JWST exposure-time calculator. We computed the gas line intensities using (i) the Cloudy code for the ionized gas in the H II region and the ionization front (Ferland et al. 2017); and (ii) the Meudon PDR code for the contribution from the atomic and molecular lines in the neutral PDR gas (Le Petit et al. 2006). The parameters and calculation requirements used for each model and region are described in detail in Berné et al. (2022). In the following subsections, we only provide the computational results that are important for the comparison of predictions and observations.
In this comparison with model predictions, our primary goal was to ensure that the models reproduce the observed intensity peak of the ionised and neutral gas line emission by Keck. This allowed us to adjust the required JWST integration time in order to get a high S/N and avoid saturation problems, which are challenging when observing bright targets with JWST. We emphasize that our model predictions were obtained by making simple assumptions and by separately estimating the ionized and neutral molecular gas lines. The radiative transfer and the thermal balance were not calculated continuously from the HII region to the molecular region. We have not attempted to reproduce the separation between the IF and the DF.
6.1 Predicted Brγ and [FeII] lines emission
The input parameters of Pellegrini et al. (2009) and Shaw et al. (2009) were adopted for the Cloudy model of the Orion Bar. This is an isobaric model with initial electron density of ne ~ 3500 cm−3 and temperature of Te ~ 9000 K. The electron density reaches a maximum of ne ~ 6600 cm−3 before the IF and drops sharply at the IF. At the IF, the total proton density increases to n = 28 000 cm−3 while the electronic temperature decreases to Te ~ 4000 K. The Brγ 2.16 µm line emissivity is spatially extended in the HII region, following the electronic density profile, and then decreases strongly when H+ becomes H0 at the IF. On the other hand, the [FeII] 1.64µm line emissivity peaks strongly at the IF.
In Table 1, we report the predicted intensities of the lines. The [FeII] 1.64 µm and Brγ 2.16 µm line model predictions are in good agreement with the observations at the IF front (by a factor of less than 1.4). On the other hand, the emission of these lines in the HII region is significantly lower in the model predictions. This difference applies for several other ionized gas lines predicted by Cloudy. The observations may overlap the IF where the observed intensities are bright.
6.2 Predicted H2 line emission
For the Meudon code, we considered an isobaric model with a thermal pressure P = 4 × 10⁸ Kcm−3. This model exhibits gas physical conditions expected near the dissociation front of the Orion Bar (e.g., Goicoechea et al. 2016; Joblin et al. 2018). We fixed the radiation field impinging on the PDR so that, at the edge of the PDR, G0 = 2 × 10⁴ in Mathis units. We adopted the extinction curve of HD 38087 of Fitzpatrick & Massa (1990) and Rv = 5.62 which is close to the value determined for the Orion Bar of 5.5 (Marconi et al. 1998). The model includes an exact radiative transfer calculation for the UV pumping lines originating from the first 30 levels of H2, while the other lines are treated using the FGK approximation. This allows mutual shielding effects between overlapping H2 lines to be accounted for which can significantly affect the position of the H/H2 transition. The H2 1−0 S(1) line emissivity peaks near the H/H2 transition layer where the gas density is of the order of a few 105 cm−3. As in Joblin et al. (2018), the model does not reproduce the observed width of the atomic region, that is, the distance between the position of the IF and the DF. It is significantly smaller than in the observation. We note that as suggested by Allers et al. (2005), a PDR model with a lower gas pressure in the atomic zone (i.e., a lower gas density) and a reduction of the FUV dust cross section will better match the observed spatial position of the H2 emission peak. In the (Schirmer et al., in prep.) dust model with nano-grain depletion (i.e., FUV extinction reduction), the visual extinction integrated from the PDR edge to the observed H2 emission peak position at 12–12.5″ (or 0.024–0.025 pc) is of AV ~ 1. The required model medium density in the atomic zone is of 5 × 104 cm−3, close to the inter-clump density.
We calculated the cumulative line intensities from the atomic and H0/H2 transition region (0 < AV < 0.4 and 0.4 < AV < 2.5) and from the molecular region (which starts at the C/CO transition, 2.5 < AV < 8.5). The optically thin line surface brightness is enhanced by a geometrical factor of 1/cos(θ) = 2 relative to the face-on surface brightness. The viewing angle θ between the line-of-sight and the normal to the PDR is taken equal to ~60º which gives an approximation of a nearly edge-on PDR and is the maximum inclination that can be used to derive line intensities in the 1D PDR Meudon code. The uncertainty on this angle could lead to an additional scaling factor on the line intensity.
The H2 2.12 µm line intensity as predicted by the model in the DF is in agreement with the measured peak intensity at the DF by a factor of 1.6 (too high for the model). This could partly be due to a geometrical factor but also to the fact that the isobaric model considered here with a high pressure of P = 4 × 10⁸ K cm−3 gives an overly high density and overestimates the H2 1−0 S(1) line (see Sect. 6.3). The H2 1−0 S(1) line emissivity width predicted by the model is of ~0.0006 pc or ~0.3″. This is lower that the observed thickness of the sharpest H2 filaments (see Fig. 5). The observed width of the bright H2 ridge (about 1″ to 2″) may be increased by geometrical effects or a lower thermal pressure.
In the atomic zone, the model predicts a much lower intensity, that is, lower by a factor of approximately ten with respect to the DF, because the H2 density is much lower. This is in agreement with the data but the large uncertainties on the measured intensity make a quantitative comparison difficult. In the molecular zone, the predicted intensities are extremely low, that is, lower than the DF by a factor >104. The measured intensity decreases by much less, and is comparable to the intensity measured in the HII region divided by a factor of two. The observed H2 emission in the molecular zone originates from the flattened region behind the main ionization front on the far side of the Orion Bar.
6.3 Thermal pressure and dynamic effects
Considering the TEXES H2 0-0 S(1) line observation with an angular resolution of 2″ (Allers et al. 2005) and the 1−0 S(1) line Keck observation convolved at the same resolution and corrected for extinction, the 1−0 S(1)/0-0 S(1) line ratio is estimated to be about ~1 ± 0.4 at the DF (position A in Allers et al. 2005). The ratio predicted by the model is about 2.5 times higher. A pressure of 4 × 10⁸ K cm−3 is probably too high to reproduce this ratio and more detailed modeling would be needed. The previous H2 study by Allers et al. (2005) shows that an isobaric model with P = 8 × 10⁷ K cm−3 (with a pressure five times lower that the one we assumed) matches the observed intensities of the ground-state rotational lines, the H2 1−0 S(1) and 2−1 S(1) lines.
To determine the pressure and density variations at the PDR edge, future detailed spatial studies of both the H2 pure rotational and rovibrational lines are required. An excitation diagram from the numerous H2 lines observable by JWST MIRI and NIRSpec will allow the warm and hot (UV-pumped) excitation temperatures, local gas density, and pressure gradients to be traced at small spatial scales. It will be possible to probe the physical conditions in most of the dense substructures detected with Keck or ALMA. On the other hand, it is possible to marginally spatially resolve the temperature gradient inside the over-dense substructures themselves. For a high-pressure PDR, the H2 emission thickness is predicted to be <1″ and spatial shift between the H2 rotational line emission peaks is comparable to or smaller than the JWST diffraction limit which is about 0.2″ to 1″ in the 5–28 µm range where the pure rotational lines are found.
These constraints on the physical conditions may allow us to better understand the dynamical effects in PDRs, such as compression waves, photo-evaporative flows, and IF and DF instabilities. Recently, Maillard et al. (2021) modeled the dynamical effects of the radiative stellar feedback on the H-to-H2 transition. These authors built a semi-analytical model of the H/H2 transition in a 1D plane-parallel PDR illuminated by FUV radiation with advancing IF resulting from the photoevaporation mechanism. However, for the high-excitation PDRs such as the Orion Bar, moderate effects are predicted. The H0/H2 transition will be slightly closer to the IF and sharper. Much stronger effects of the advection dynamics with merged or almost merged IF and DF are predicted for low-excitation PDRs illuminated by late O stars such as the Horsehead nebula.
7 Summary
In this section, we provide a short summary and outline the prospects for JWST.
We used Keck/NIRC2 in conjunction with AO to obtain the most complete and detailed maps of the complex UV-irradiated region of the Orion Bar so far, where the conversion from ionized to atomic to molecular gas occurs. We mapped the vibrationally excited line of H2 at 2.12 µm, tracing the dissociation front (DF), and the [FeII] line at 1.64µm and the Brγ line at 2.16 µm, tracing the ionization front (IF). This allowed us for the first time to spatially resolve the DF with a resolution of 0.1 (40 AU) and obtain a very precise determination of the offset between the peaks of the IF and DF of between 12″ and 12.5″ (0.024-0.025 pc).
The H0/H2 DF appears highly structured with several ridges and extremely sharp filaments with a width of 1-2″ (0.002–0.004 pc or 400–800 AU). Ridges and filaments run parallel to the DF but a succession of bright substructures in H2 is also observed from the edge of the DF towards the molecular region. The multiple H2 emission peaks along and across the bar may be associated with a multitude of small highly irradiated and dense PDRs.
The comparison with ALMA data of the HCO+ J = 4−3 line emission, which is a good indicator of dense gas, show a remarkably similar spatial distribution between the H2 and HCO+ emission. This suggests that they both come from high densities but also indicates their strong chemical link and that the H/H2 and C+/C/CO transition zones are very close.
We spatially resolved additional compact sources corresponding to over-dense irradiated substructures such as pro-plyds near the IF, and perhaps collapsing protostars near the DF.
We compared our extinction-corrected observations of the emission gas lines to the model predictions using the Cloudy code for the ionized gas and the Meudon PDR code for the neutral PDR gas. The models reproduce the observed intensity peak of the gas lines emission well (less than a factor two difference).
This work confirms without ambiguity that one of the densest portions of the bar lies along the DF and that the Orion Bar edge is composed of small, dense substructures at high thermal pressure with P of about 108 K cm−3 immersed in a more diffuse environment. Further studies are required to accurately determine the physical gas conditions (pressure and density gradients) and the dynamics of these over-dense irradiated substructures and better understand their physical origin and evolution.
The JWST ERS proposal on the Orion Bar PDR (Berné et al. 2022) will very soon give access to multiple spectroscopic images with a similar spatial resolution to the Keck/NIRC2 observations but with a gain in S\N that will increase contrast and allow a sharper detection of all the less bright substructures. JWST with IFU spectroscopy will provide insight into the local gas physical conditions (temperature, density, and pressure) and the chemical composition of the warm very structured irradiated medium. It will be possible to probe the physical conditions in most of the dense substructures detected with Keck or ALMA. Furthermore, JWST will spatially resolve dust emission and scattering at NIR and MIR wavelengths simultaneously with the gas lines. Variation of the dust properties (e.g., size distribution and extinction) as a function of PDR depth will be constrained and taken into account in the UV shielding, thermal balance, and H2 formation process.
Acknowledgements
We thank our referee, Robert ODell, for the care and quality of his comments and suggestions that improved the clarity of this paper. The data presented herein were obtained at the W.M. Keck Observatory, which is operated as a scientific partnership among the California Institute of Technology, the University of California and the National Aeronautics and Space Administration. The Observatory was made possible by the generous financial support of the W.M. Keck Foundation. The authors wish to recognize and acknowledge the very significant cultural role and reverence that the summit of Maunakea has always had within the indigenous Hawaiian community. We are most fortunate to have the opportunity to conduct observations from this mountain. This research has made use of the Keck Observatory Archive (KOA), which is operated by the W.M. Keck Observatory and the NASA Exoplanet Science Institute (NExScI), under contract with the National Aeronautics and Space Administration. Mark G. Wolfire acknowledges partial support from a NASA-Keck data analysis grant (contract 1653861). Javier R. Goicoechea thanks the Spanish MCIYU for funding support under grant PID2019-106110GB-I00.
References
- Agúndez, M., Goicoechea, J. R., Cernicharo, J., Faure, A., & Roueff, E. 2010, ApJ, 713, 662 [Google Scholar]
- Allers, K. N., Jaffe, D. T., Lacy, J. H., Draine, B. T., & Richter, M. J. 2005, ApJ, 630, 368 [NASA ADS] [CrossRef] [Google Scholar]
- Andree-Labsch, S., Ossenkopf-Okada, V., & Röllig, M. 2017, A&A, 598, A2 [NASA ADS] [CrossRef] [EDP Sciences] [Google Scholar]
- Bally, J., O’Dell, C., & McCaughrean, M. J. 2000, AJ, 119, 119 [Google Scholar]
- Bally, J., Ginsburg, A., Silvia, D., & Youngblood, A. 2015, A&A, 579, A130 [NASA ADS] [CrossRef] [EDP Sciences] [Google Scholar]
- Bernard-Salas, J., Habart, E., Arab, H., et al. 2012, A&A, 538, A37 [NASA ADS] [CrossRef] [EDP Sciences] [Google Scholar]
- Berné, O., Marcelino, N., & Cernicharo, J. 2010, Nature, 466, 947 [CrossRef] [Google Scholar]
- Berné, O., Habart, É., Peeters, E., et al. 2022, PASP, 134, 054301 [CrossRef] [Google Scholar]
- Blagrave, K. P. M., Martin, P. G., Rubin, R. H., et al. 2007, ApJ, 655, 299 [NASA ADS] [CrossRef] [Google Scholar]
- Bregman, J. D., Allamandola, L. J., Tielens, A. G. G. M., Geballe, T. R., & Witteborn, F. C. 1989, ApJ, 344, 791 [NASA ADS] [CrossRef] [Google Scholar]
- Burton, M. G., Hollenbach, D. J., & Tielens, A. G. G. M. 1990, ApJ, 365, 620 [NASA ADS] [CrossRef] [Google Scholar]
- Cardelli, J. A., Clayton, G. C., & Mathis, J. S. 1989, ApJ, 345, 245 [Google Scholar]
- Champion, J., Berné, O., Vicente, S., et al. 2017, A&A, 604, A69 [NASA ADS] [CrossRef] [EDP Sciences] [Google Scholar]
- Chuss, D. T., Andersson, B. G., Bally, J., et al. 2019, ApJ, 872, 187 [Google Scholar]
- Cuadrado, S., Salas, P., Goicoechea, J. R., et al. 2019, A&A, 625, A3 [Google Scholar]
- Ferland, G. J., Chatzikos, M., Guzmán, F., et al. 2017, Rev. Mexicana Astron. Astrofis., 53, 385 [Google Scholar]
- Fitzpatrick, E. L., & Massa, D. 1990, ApJS, 72, 72 [Google Scholar]
- Giard, M., Bernard, J. P., Lacombe, F., Normand, P., & Rouan, D. 1994, A&A, 291, 239 [NASA ADS] [Google Scholar]
- Goicoechea, J. R., & Cuadrado, S. 2021, A&A, 647, L7 [NASA ADS] [CrossRef] [EDP Sciences] [Google Scholar]
- Goicoechea, J. R., Teyssier, D., Etxaluze, M., et al. 2015, ApJ, 812, 75 [Google Scholar]
- Goicoechea, J. R., Pety, J., Cuadrado, S., et al. 2016, Nature, 537, 537 [Google Scholar]
- Goicoechea, J. R., Cuadrado, S., Pety, J., et al. 2017, A&A, 601, A9 [Google Scholar]
- Gorti, U., & Hollenbach, D. 2002, ApJ, 573, 215 [Google Scholar]
- Großschedl, J. E., Alves, J., Meingast, S., et al. 2018, A&A, 619, A106 [Google Scholar]
- Guerra, J. A., Chuss, D. T., Dowell, C. D., et al. 2021, ApJ, 908, 98 [NASA ADS] [CrossRef] [Google Scholar]
- Hartigan, P., Downes, T., & Isella, A. 2020, ApJ, 902, L1 [NASA ADS] [CrossRef] [Google Scholar]
- Herrmann, F., Madden, S. C., Nikola, T., et al. 1997, ApJ, 481, 343 [CrossRef] [Google Scholar]
- Hogerheijde, M. R., Jansen, D. J., & van Dishoeck, E. F. 1995, A&A, 294, 792 [NASA ADS] [Google Scholar]
- Inutsuka, S.-I., & Miyama, S. M. 1997, ApJ, 480, 681 [NASA ADS] [CrossRef] [Google Scholar]
- Joblin, C., Bron, E., Pinto, C., et al. 2018, A&A, 615, A129 [NASA ADS] [CrossRef] [EDP Sciences] [Google Scholar]
- Jones, A. P., Fanciullo, L., Köhler, M., et al. 2013, A&A, 558, A62 [NASA ADS] [CrossRef] [EDP Sciences] [Google Scholar]
- Jones, A. P., Köhler, M., Ysard, N., Bocchio, M., & Verstraete, L. 2017, A&A, 602, A46 [NASA ADS] [CrossRef] [EDP Sciences] [Google Scholar]
- Juvela, M. 2019, A&A, 622, A79 [NASA ADS] [CrossRef] [EDP Sciences] [Google Scholar]
- Kaplan, K. F., Dinerstein, H. L., Oh, H., et al. 2017, ApJ, 838, 152 [CrossRef] [Google Scholar]
- Kaplan, K. F., Dinerstein, H. L., Kim, H., & Jaffe, D. T. 2021, ApJ, 919, 27 [NASA ADS] [CrossRef] [Google Scholar]
- Kirsanova, M. S., & Wiebe, D. S. 2019, MNRAS, 486, 2525 [CrossRef] [Google Scholar]
- Knight, C., Peeters, E., Stock, D. J., Vacca, W. D., & Tielens, A. G. G. M. 2021, ApJ, 918, 8 [NASA ADS] [CrossRef] [Google Scholar]
- Köhler, M., Ysard, N., & Jones, A. P. 2015, A&A, 579, A15 [NASA ADS] [CrossRef] [EDP Sciences] [Google Scholar]
- Kounkel, M., Hartmann, L., Loinard, L., et al. 2017, ApJ, 834, 142 [Google Scholar]
- Lehmann, A., Godard, B., Pineau des Forêts, G., Vidal-García, A., & Falgarone, E. 2022, A&A, 658, A165 [CrossRef] [EDP Sciences] [Google Scholar]
- Le Petit, F., Nehmé, C., Le Bourlot, J., & Roueff, E. 2006, ApJS, 164, 506 [NASA ADS] [CrossRef] [Google Scholar]
- Lis, D. C., & Schilke, P. 2003, ApJ, 597, L145 [NASA ADS] [CrossRef] [Google Scholar]
- Lu, J. R., Ghez, A. M., Hornstein, S. D., et al. 2009, ApJ, 690, 1463 [NASA ADS] [CrossRef] [Google Scholar]
- Luhman, M. L., Jaffe, D. T., Keller, L. D., & Pak, S. 1994, ApJ, 436, L185 [NASA ADS] [CrossRef] [Google Scholar]
- Luhman, K. L., Engelbracht, C. W., & Luhman, M. L. 1998, ApJ, 499, 799 [NASA ADS] [CrossRef] [Google Scholar]
- Mackey, J., & Lim, A. J. 2011, MNRAS, 412, 2079 [NASA ADS] [CrossRef] [Google Scholar]
- Maillard, V., Bron, E., & Le Petit, F. 2021, A&A, 656, A65 [NASA ADS] [CrossRef] [EDP Sciences] [Google Scholar]
- Marconi, A., Testi, L., Natta, A., & Walmsley, C. M. 1998, A&A, 330, 696 [NASA ADS] [Google Scholar]
- Menten, K. M., Reid, M. J., Forbrich, J., & Brunthaler, A. 2007, A&A, 474, 515 [NASA ADS] [CrossRef] [EDP Sciences] [Google Scholar]
- Nagy, Z., Van der Tak, F. F. S., Ossenkopf, V., et al. 2013, A&A, 550, A96 [NASA ADS] [CrossRef] [EDP Sciences] [Google Scholar]
- O’Dell, C. R. 2001, ARA&A, 39, 99 [Google Scholar]
- O’Dell, C. R., & Yusef-Zadeh, F. 2000, AJ, 120, 382 [CrossRef] [Google Scholar]
- O’Dell, C. R., Kollatschny, W., & Ferland, G. J. 2017, ApJ, 837, 151 [CrossRef] [Google Scholar]
- Ossenkopf, V., Röllig, M., Simon, R., et al. 2010, A&A, 518, A79 [Google Scholar]
- Ossenkopf, V., Röllig, M., Neufeld, D. A., et al. 2013, A&A, 550, A57 [NASA ADS] [CrossRef] [EDP Sciences] [Google Scholar]
- Pabst, C. H. M., Goicoechea, J. R., Teyssier, D., et al. 2020, A&A, 639, A2 [NASA ADS] [CrossRef] [EDP Sciences] [Google Scholar]
- Parikka, A., Habart, E., Bernard-Salas, J., et al. 2017, A&A, 599, A20 [NASA ADS] [CrossRef] [EDP Sciences] [Google Scholar]
- Parikka, A., Habart, E., Bernard-Salas, J., Köhler, M., & Abergel, A. 2018, A&A, 617, A77 [NASA ADS] [CrossRef] [EDP Sciences] [Google Scholar]
- Parmar, P. S., Lacy, J. H., & Achtermann, J. M. 1991, ApJ, 372, L25 [CrossRef] [Google Scholar]
- Pellegrini, E.W., Baldwin, J. A., Ferland, G. J., Shaw, G., & Heathcote, S. 2009, ApJ, 693, 285 [CrossRef] [Google Scholar]
- Röllig, M., & Ossenkopf-Okada, V. 2022, A&A, 664, A67 [NASA ADS] [CrossRef] [EDP Sciences] [Google Scholar]
- Schneider, N., Simon, R., Guevara, C., et al. 2020, PASP, 132, 104301 [NASA ADS] [CrossRef] [Google Scholar]
- Sellgren, K., Tokunaga, A. T., & Nakada, Y. 1990, ApJ, 349, 120 [NASA ADS] [CrossRef] [Google Scholar]
- Shaw, G., Ferland, G. J., Henney, W. J., et al. 2009, ApJ, 701, 677 [NASA ADS] [CrossRef] [Google Scholar]
- Sheffer, Y., Wolfire, M. G., Hollenbach, D. J., Kaufman, M. J., & Cordier, M. 2011, ApJ, 741, 741 [Google Scholar]
- Tauber, J. A., Lis, D. C., Keene, J., Schilke, P., & Buettgenbach, T. H. 1995, A&A, 297, 567 [Google Scholar]
- Thronson, J., Harley, A., Majewski, S., Descartes, L., & Hereld, M. 1990, ApJ, 364, 456 [NASA ADS] [CrossRef] [Google Scholar]
- Tielens, A. G. G. M., Meixner, M. M., van der Werf, P. P., et al. 1993, Science, 262, 86 [NASA ADS] [CrossRef] [Google Scholar]
- Tremblin, P., Audit, E., Minier, V., Schmidt, W., & Schneider, N. 2012, A&A, 546, A33 [CrossRef] [EDP Sciences] [Google Scholar]
- van der Werf, P. P., Stutzki, J., Sternberg, A., & Krabbe, A. 1996, A&A, 313, 633 [NASA ADS] [Google Scholar]
- van der Werf, P. P., Goss, W. M., & O’Dell, C. R. 2013, ApJ, 762, 101 [NASA ADS] [CrossRef] [Google Scholar]
- Walmsley, C. M., Natta, A., Oliva, E., & Testi, L. 2000, A&A, 364, 301 [NASA ADS] [Google Scholar]
- Weilbacher, P. M., Monreal-Ibero, A., Kollatschny, W., et al. 2015, A&A, 582, A114 [NASA ADS] [CrossRef] [EDP Sciences] [Google Scholar]
- Wen, Z., & O’dell, C. R. 1995, ApJ, 438, 784 [NASA ADS] [CrossRef] [Google Scholar]
- Wolfire, M. G., Vallini, L., & Chevance, M. 2022, ARA&A, 60, 247 [NASA ADS] [CrossRef] [Google Scholar]
- Wright, C. M., van Dishoeck, E. F., Cox, P., Sidher, S. D., & Kessler, M. F. 1999, ApJ, 515, L29 [NASA ADS] [CrossRef] [Google Scholar]
- Wu, R., Bron, E., Onaka, T., et al. 2018, A&A, 618, A53 [NASA ADS] [CrossRef] [EDP Sciences] [Google Scholar]
- Wyrowski, F., Schilke, P., Hofner, P., & Walmsley, C. M. 1997, ApJ, 487, L171 [NASA ADS] [CrossRef] [Google Scholar]
- Young Owl, R. C., Meixner, M. M., Wolfire, M., Tielens, A. G. G. M., & Tauber, J. 2000, ApJ, 540, 886 [Google Scholar]
- Zhang, Z. E., Cummings, S. J., Wan, Y., Yang, B., & Stancil, P. C. 2021, ApJ, 912, 116 [NASA ADS] [CrossRef] [Google Scholar]
The most commonly adopted distance to the Bar is 414 pc (Menten et al. 2007) although more recent observations, including Gaia, point to slightly lower values (Kounkel et al. 2017; Großschedl et al. 2018).
All Tables
Observed and predicted line intensities in erg cm−2 s−1 sr−1 in the ionized, IF, atomic, DF, and molecular regions.
All Figures
|
Fig. 1 Hubble Space Telescope WFPC2 mosaic of the Orion Bar (Credit: NASA/STScI/Rice Univ./C.O’Dell et al. - Program ID: PRC95-45a). The NIRC2 wide camera FoV is shown with the cyan square. The yellow square zooms into the two proplyds lying in the targeted FoV. |
| In the text | |
|
Fig. 2 PanSTARRS (z band) image showing the NIRC2 wide camera FoV (cyan square, 40″ × 40″) centered on RA = 05 : 35 : 20.662, Dec = −05 : 25 : 19.38 (J2000). The green circles enclose tip-tilt stars that can be used to perform the LGS observations. |
| In the text | |
|
Fig. 3 Integrated intensity maps of the [FeII] and continuum-subtracted [FeII] line emission (left column) and of the Brγ and continuum-subtracted Brγ line emission (right column). Units are erg cm−2 s−1 sr−1 µm−1 for the [FeII] and Brγ maps and erg cm−2 s−1 sr−1 for the continuum-subtracted line emission map. The horizontal dashed lines indicate the average position of the ionization and dissociation fronts (as determined from the averaged emission cut over the entire FoV presented in Fig. 5). |
| In the text | |
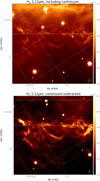 |
Fig. 4 Same as Fig. 3 but for the H2 1−0 S(1) line emission. |
| In the text | |
|
Fig. 5 Top row: superposition of the four cuts perpendicular to the Orion Bar described in Sect. 4.1 on the [FeII] 1.64 µmand H2 2.12 µm continuum subtracted emission line maps. Cuts 1, 2, 3, and 4 are positioned from left to right. The square areas are used to compute the line intensities in the key regions presented in Table 1. Second and third rows: H2 (blue), Brγ (red) and [FeII] (green) line intensity (in erg s−1 cm−2 sr−1) profiles shown as a function of the distance from the IF for each cut along with the HCO+ line integrated intensity profile (in K km s−1, grey). The intensity profiles of the Brγ and [FeII] lines have been scaled by the factors indicated in the legends. The line intensities have not been corrected for dust extinction. Bottom row: Averaged emission cut calculated by taking the mean over the entire FoV and perpendicular to the Orion Bar. The vertical dashed lines indicate the average position of the IF, DF, and HCO+ peaks. |
| In the text | |
|
Fig. 6 Left panels: integrated intensity maps (continuum-subtracted) of the H2 1−0 S(1) line emission in erg cm−2 s−1 sr−1. Right panels: integrated intensity maps of the HCO+ J = 4−3 lines in K km s−1. |
| In the text | |
|
Fig. 7 Zoom into proplyds in the H2 2.12 µm, [FeII] 1.64 µm, and Brγ 2.16 µm lines (continuum substracted), as well as, in the Hcont and Kcont filters with the Hα emission in addition using the HST observations from https://archive.stsci.edu/prepds/orion/acs_displaypage.html which was adjusted in positions. |
| In the text | |
Current usage metrics show cumulative count of Article Views (full-text article views including HTML views, PDF and ePub downloads, according to the available data) and Abstracts Views on Vision4Press platform.
Data correspond to usage on the plateform after 2015. The current usage metrics is available 48-96 hours after online publication and is updated daily on week days.
Initial download of the metrics may take a while.