Fig. 3
Download original image
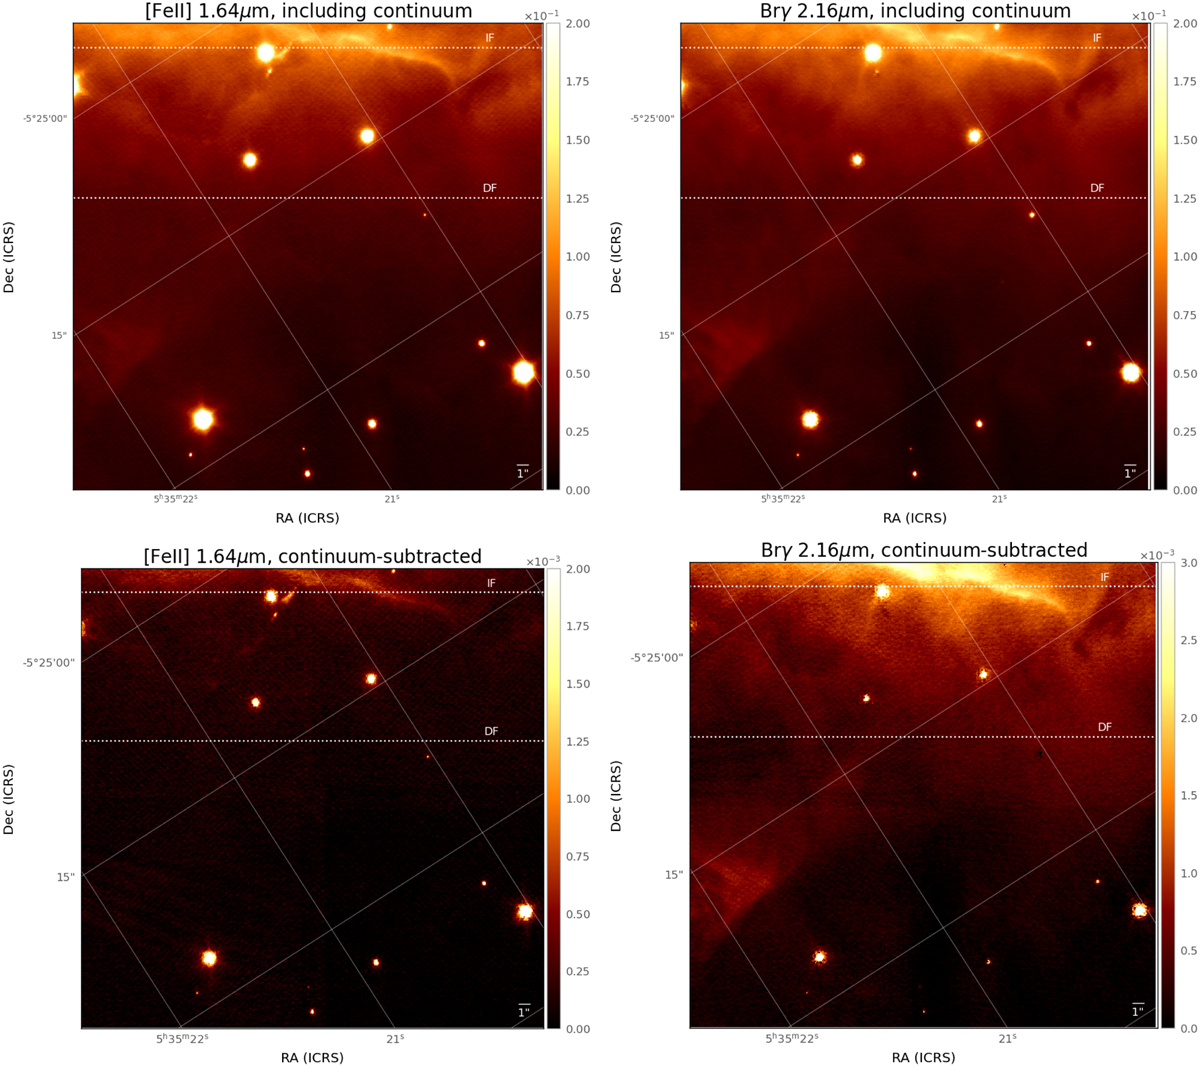
Integrated intensity maps of the [FeII] and continuum-subtracted [FeII] line emission (left column) and of the Brγ and continuum-subtracted Brγ line emission (right column). Units are erg cm−2 s−1 sr−1 µm−1 for the [FeII] and Brγ maps and erg cm−2 s−1 sr−1 for the continuum-subtracted line emission map. The horizontal dashed lines indicate the average position of the ionization and dissociation fronts (as determined from the averaged emission cut over the entire FoV presented in Fig. 5).
Current usage metrics show cumulative count of Article Views (full-text article views including HTML views, PDF and ePub downloads, according to the available data) and Abstracts Views on Vision4Press platform.
Data correspond to usage on the plateform after 2015. The current usage metrics is available 48-96 hours after online publication and is updated daily on week days.
Initial download of the metrics may take a while.