Fig. 5
Download original image
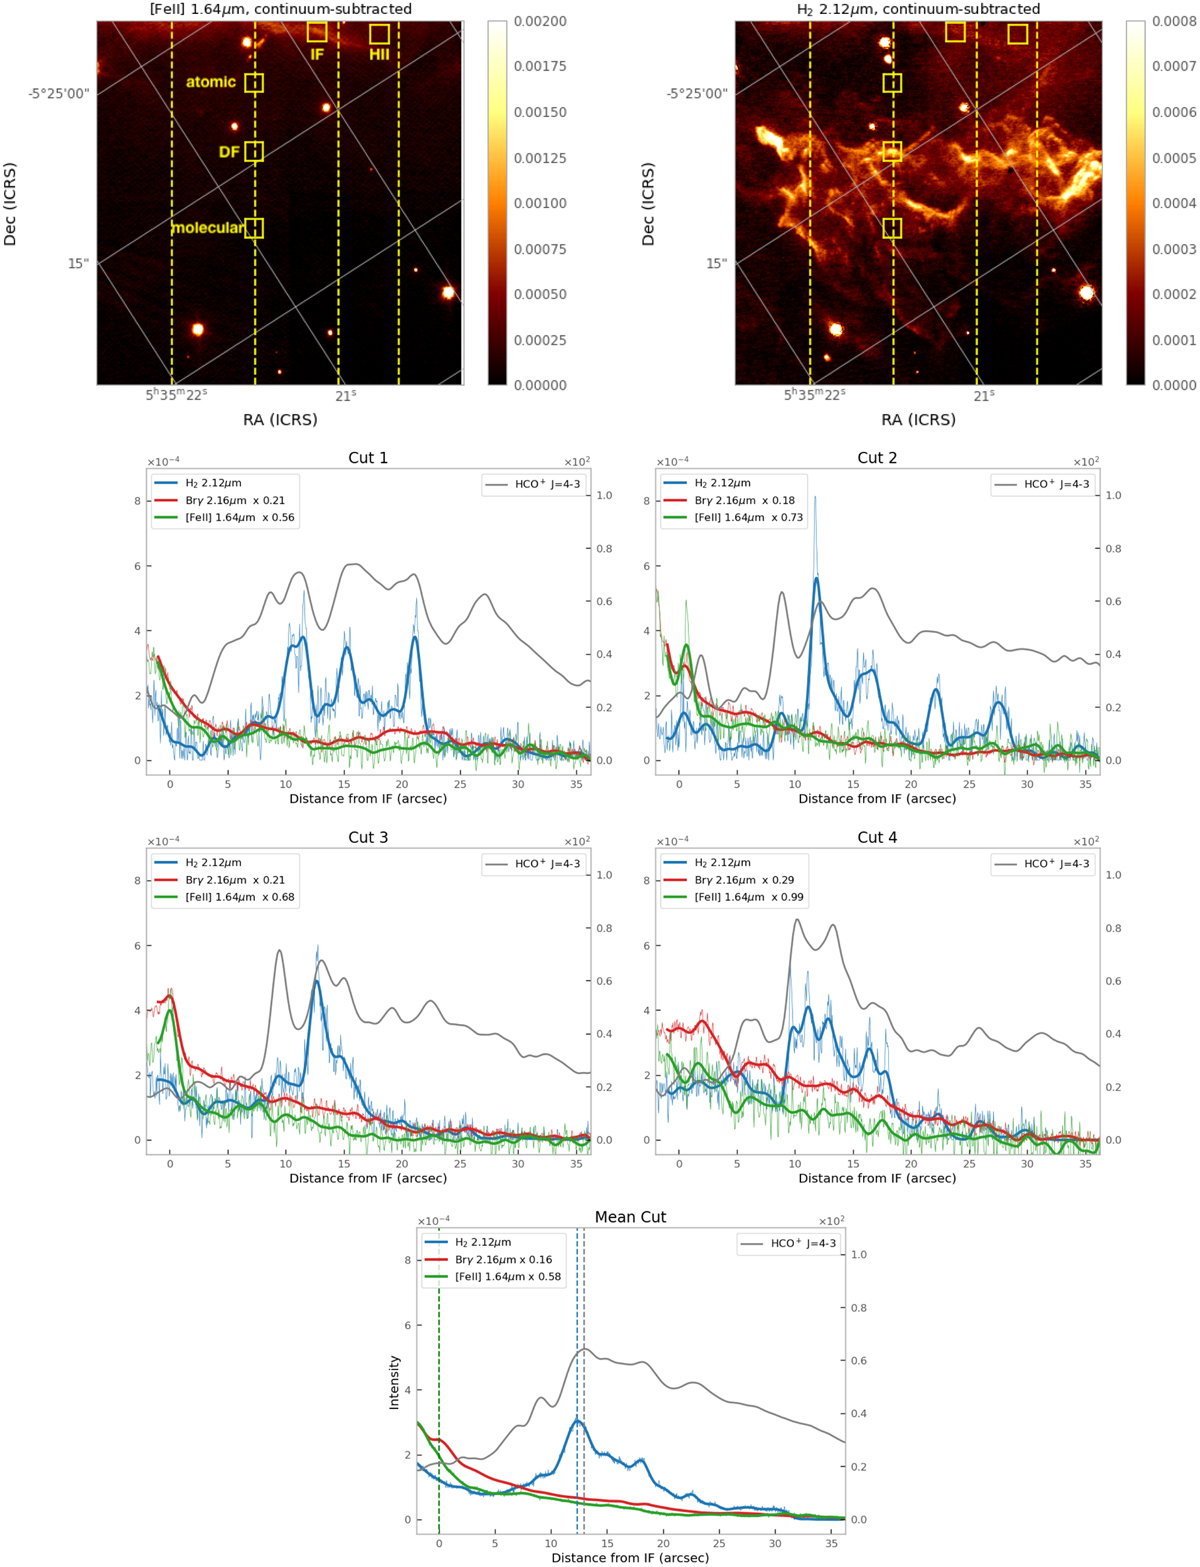
Top row: superposition of the four cuts perpendicular to the Orion Bar described in Sect. 4.1 on the [FeII] 1.64 µmand H2 2.12 µm continuum subtracted emission line maps. Cuts 1, 2, 3, and 4 are positioned from left to right. The square areas are used to compute the line intensities in the key regions presented in Table 1. Second and third rows: H2 (blue), Brγ (red) and [FeII] (green) line intensity (in erg s−1 cm−2 sr−1) profiles shown as a function of the distance from the IF for each cut along with the HCO+ line integrated intensity profile (in K km s−1, grey). The intensity profiles of the Brγ and [FeII] lines have been scaled by the factors indicated in the legends. The line intensities have not been corrected for dust extinction. Bottom row: Averaged emission cut calculated by taking the mean over the entire FoV and perpendicular to the Orion Bar. The vertical dashed lines indicate the average position of the IF, DF, and HCO+ peaks.
Current usage metrics show cumulative count of Article Views (full-text article views including HTML views, PDF and ePub downloads, according to the available data) and Abstracts Views on Vision4Press platform.
Data correspond to usage on the plateform after 2015. The current usage metrics is available 48-96 hours after online publication and is updated daily on week days.
Initial download of the metrics may take a while.