| Issue |
A&A
Volume 672, April 2023
|
|
|---|---|---|
| Article Number | A112 | |
| Number of page(s) | 18 | |
| Section | Interstellar and circumstellar matter | |
| DOI | https://doi.org/10.1051/0004-6361/202245704 | |
| Published online | 10 April 2023 | |
Resonant infrared irradiation of CO and CH3OH interstellar ices
1
Laboratory for Astrophysics, Leiden Observatory, Leiden University,
PO Box 9513,
2300 RA
Leiden, The Netherlands
e-mail: This email address is being protected from spambots. You need JavaScript enabled to view it.
2
FELIX Laboratory, Radboud University,
Toernooiveld 7,
6525 ED
Nijmegen, The Netherlands
3
School of Electronic Engineering and Computer Science, Queen Mary University of London,
London
E1 4NS, UK
4
Institute for Molecules and Materials, Radboud University,
Heyendaalseweg 135,
6525 AJ
Nijmegen, The Netherlands
5
Center for Interstellar Catalysis, Department of Physics and Astronomy, Aarhus University,
Ny Munkegade 120,
Aarhus
C 8000, Denmark
Received:
16
December
2022
Accepted:
20
February
2023
Abstract
Context. Solid-phase photo-processes involving icy dust grains greatly affect the chemical evolution of the interstellar medium by leading to the formation of complex organic molecules and by inducing photodesorption. So far, the focus of laboratory studies has mainly been on the impact of energetic ultraviolet (UV) photons on ices, but direct vibrational excitation by infrared (IR) photons is expected to influence the morphology and content of interstellar ices as well. However, little is still known about the mechanisms through which this excess vibrational energy is dissipated, as well as its implications for the structure and ice photochemistry.
Aims. In this work, we present a systematic investigation of the behavior of interstellar relevant CO and CH3OH ice analogs following the resonant excitation of vibrational modes using tunable IR radiation. We seek to quantify the IR-induced photodesorption and gain insights into the impact of vibrational energy dissipation on ice morphology.
Methods. We utilized an ultrahigh vacuum setup at cryogenic temperatures to grow pure CO and CH3OH ices, as well as mixtures of the two. We exposed the ices to intense, near-monochromatic mid-IR (MIR) free-electron-laser radiation using the LISA end-station at the FELIX free electron laser facility to selectively excite the species. Changes to the ice are monitored by means of reflection-absorption IR spectroscopy combined with quadrupole mass-spectrometry. These methods also allowed us to characterize the photodesorption efficiency.
Results. The dissipation of vibrational energy is observed to be highly dependent on the excited mode and the chemical environment of the ice. All amorphous ices undergo some degree of restructuring towards a more organized configuration upon on-resonance irradiation. Moreover, IR-induced photodesorption is observed to occur for both pure CO and CH3OH ices, with interstellar photodesorption efficiencies on the order of 10 molecules cm−2 s−1. This result is comparable to or higher than what is found for UV-induced counterparts. An indirect photodesorption of CO upon vibrational excitation of CH3OH in ice mixtures is also observed to occur, particularly in environments that are rich in methanol. Here, we discuss the astrochemical implications of these IR-induced phenomena.
Key words: astrochemistry / methods: laboratory: solid state / infrared: ISM / ISM: molecules / molecular processes
© The Authors 2023
 Open Access article, published by EDP Sciences, under the terms of the Creative Commons Attribution License (https://creativecommons.org/licenses/by/4.0), which permits unrestricted use, distribution, and reproduction in any medium, provided the original work is properly cited.
This article is published in open access under the Subscribe to Open model. This email address is being protected from spambots. You need JavaScript enabled to view it. to support open access publication.
1 Introduction
Interstellar icy dust grains are continuously exposed to both energetic and non-energetic triggers that initiate solid-state processes, such as chemical reactions. The consequent association of induced fragments (e.g., in exothermic reactions) has been reported to result in larger molecules containing excess energy. The ejection of solid-state chemical products to the gas phase through so-called “reactive desorption” and “photo-induced chemical desorption” is a direct consequence of this process (Minissale & Dulieu 2014; Minissale et al. 2016; Muñoz Caro & Martín Doménech 2018; Chuang et al. 2018; Oba et al. 2018). This extra energy (which can take a vibrational form) must, in turn, be dissipated within the ice itself. Understanding the mechanisms through which this energy is dissipated and its consequences for the content and morphology of the ice is of special relevance when constructing accurate astrochemical models. Over recent decades, the focus has been on ultraviolet (UV) photons, given their ability to break chemical bonds. However, impacting infrared (IR) photons are also expected to have substantial effects, specifically in dense molecular clouds.
The infrared interstellar radiation field (ISRF) is most intense in the inner galaxy, generated both by stellar emission (mainly for λ ≲ 8 µm) and by re-emission from dust grains (dominant for λ ≳ 8 µm). The former is accounted for by a combination of blackbody radiation fields, while the latter requires a model of the interstellar dust as described in Draine & Li (2001) and Li & Draine (2001). Within clouds, the integrated flux of secondary UV photons resulting from the excitation of H2 upon interactions with cosmic rays is expected to be on the order of ~104 photons cm−2 s−1 (Cecchi-Pestellini & Aiello 1992). However, that of IR photons with wavelengths in the range of 1–10 µm is currently estimated to be substantially higher and on the order of ≳109 photons cm−2 s−1 (e.g., Mathis et al. 1983; Porter & Strong 2005; Roueff et al. 2014). The response of ices upon direct vibrational excitation has been scarcely investigated in the laboratory and is typically not included in models (e.g., Cuppen et al. 2017). For instance, vacuum ultraviolet radiation is known for resulting in a rich photochemistry (see, e.g., the review by Öberg 2016 and references therein), transforming the ice structure (Kouchi & Kuroda 1990), as well as leading to photodesorption induced by electronic transitions (Fayolle et al. 2011, 2013; van Hanert et al. 2015), whereas laboratory investigations of potential photodesorption and structural changes upon direct vibrational excitation are still limited. Structural changes are typically reflected in the spectral appearance of such ices (e.g., Cuppen et al. 2011; Cooke et al. 2016; Müller et al. 2021) and therefore changes in ice morphology and content due to energy-dissipation processes will play a part in interpreting observational data from IR facilities, such as the James Webb Space Telescope (McClure et al. 2023).
Silicates and carbonaceous materials are the main components of (sub)micron-sized dust grains present in the interstellar medium (ISM; Millar & Williams 1993). During the earlier stages of star formation, H and O atoms adsorbed onto these grains react to form H2O, resulting in a water-rich “polar-ice” layer (Ioppolo et al. 2010; Cuppen et al. 2010; Linnartz et al. 2015). In addition to water, carbon dioxide (CO2) is a very abundant solid-phase ISM species, and is mainly present in the aforementioned interstellar polar-ice layer mixed with H2O (Goumans et al. 2008; Oba et al. 2010; Ioppolo et al. 2011; Noble et al. 2011). As the density of the collapsing cloud increases, carbon monoxide (CO) molecules present in the gas phase (catastrophically) freeze-out on top of the polar ice, forming a second coating known as the “apolar-ice” layer (Tielens et al. 1991; Boogert et al. 2002; Pontoppidan et al. 2003). Through hydrogenation reactions of solid-state CO, methanol (CH3OH) is efficiently formed (Tielens & Hagen 1982; Charnley et al. 1992; Hiraoka et al. 1994; Watanabe & Kouchi 2002; Fuchs et al. 2009; Santos et al. 2022). This alcohol is abundantly present in interstellar ices mixed with CO, as shown by various laboratory and observational works (e.g., Bottinelli et al. 2010; Cuppen et al. 2011; Penteado et al. 2015). Follow-up studies have shown that along the same hydrogenation scheme also larger complex organic molecules (COMs), such as glycerol, can be formed involving radical reactions (Chuang et al. 2016; Fedoseev et al. 2017). Alternatively, CH3OH can also be formed less efficiently during stages prior to CO-freeze out through reactions involving CH4 and OH (Qasim et al. 2018).
The IR irradiation of crystalline water ice has been previously studied with a focus on its resonant desorption at elevated temperatures (≳100K; Krasnopoler & George 1998; Focsa et al. 2003). These first studies suggested that on-resonance irradiation of crystalline ices leads to selectivity effects, with a strong wavelength-dependent H2O desorption as a result of IR-photon absorption. Infrared-induced matrix-assisted laser desorption and ionization (MALDI) experiments ensued, evincing the photodesorption of polycyclic aromatic hydrocarbons (PAHs), as well as their hydrated clusters, embedded in water ice matrices and subjected to resonant vibrational excitation (Focsa et al. 2006; Mihesan et al. 2006; Henderson & Gudipati 2014). More recently, porous amorphous solid water (pASW) has been studied in works combining IR-free electron laser (FEL) irradiation experiments and molecular dynamics simulations, which revealed a reorganization of the ice structure towards a more ordered configuration upon the absorption of photons in the broad IR regime (Noble et al. 2020; Coussan et al. 2022; Cuppen et al. 2022). Amorphous CO2 ices have shown a similar behavior as a result of IR-FEL irradiation, whereas this effect was barely observed in the crystalline counterparts (Ioppolo et al. 2022). Moreover, both Noble et al. (2020) and Ioppolo et al. (2022) hint at possible photodesorption upon resonant irradiation of the pure ices.
Vibrational energy pooling (VEP) is also an interesting phenomenon that takes place as a result of vibrational excitation. In VEP, vibrationally excited CO molecules pool their energy through a base-camp mechanism, resulting in highly excited CO species that constitute a small portion of the group (DeLeon & Rich 1986; Corcelli & Tully 2002; Chen et al. 2017, 2019; DeVine et al. 2022). DeVine et al. (2022) have explored the effects of VEP of crystalline CO under interstellar conditions in a combined laboratory and theoretical work, and reported the formation of CO2 and C2O3 species as a result of spin-forbidden reactions involving highly vibrationally excited CO molecules. The reaction pathways they explored also led to CO desorption due to the energy release from the dissociation of an intermediate CO dimer species only accessible at extremely high vibrational excitation levels.
Infrared spectroscopic properties such as band width and peak position can provide powerful information on the mixing and layering conditions of ices (Boogert et al. 2015). With the James Webb Space Telescope (JWST), IR observations of interstellar ices are available at a wide spectral range (0.6–28.3 µm) and with unprecedented spatial resolution and sensitivity, enabling us to focus on specific areas in a proto-planetary disk or to investigate dense interstellar clouds for extinction values as high as 90 (McClure et al. 2023). The interpretation of these observations requires highly detailed laboratory data on the spectroscopic properties, morphology, and dynamics of ices. Moreover, understanding the effects of vibrational energy on the structure and dynamics of the CO-rich ice layer plays a key role in developing thorough models of the chemical evolution of the interstellar medium.
In the present work, we explore the effects of IR-photon irradiation and the consequences of vibrational-energy release in interstellar apolar ice analogues. We provide the first selective IR-FEL irradiation study on pure amorphous and crystalline CO ices (henceforth aCO and cCO), as well as pure amorphous CH3OH ices and mixtures of the two species. In Sect. 2, the experimental setup and procedures employed in this work are detailed. The main results are described and discussed in Sect. 3. In Sect. 4 we explore the astrophysical implications and our main findings are summarized in Sect. 5.
2 Experimental methods
The experiments are performed at the HFML-FELIX laboratory at Radboud University, the Netherlands, directing tunable free electron laser radiation towards the laboratory ice surface astrophysics (LISA) ultrahigh vacuum (UHV) end station. At HFML-FELIX, LISA is connected to FELIX-2 and -1 to perform selective irradiation experiments in the broad IR (3700−220 cm−1, 2.7–45 µm) and terahertz (THz, 10–2 THz, 30–150 µm) spectral ranges, respectively, shedding light on the relaxation mechanisms that follow the excitation of particular vibrational modes within solid matter. LISA has been described in detail elsewhere (Noble et al. 2020; Ioppolo et al. 2022) and here we provide a brief explanation of the experimental procedure. The experiments described here have been obtained during four 7.5-h-long beam shifts, focusing on the basic concept of (off/on) resonant IR photodesorption of interstellar ices. Extended measurements are scheduled for later this year in another run of four beam shifts.
A gold-plated optically-flat copper substrate in the center of the UHV chamber is in thermal contact with the head of a closed-cycle helium cryostat, which allows to control the substrate temperature in the range of 20–300 K through resistive heating. The temperature is monitored by a silicon diode thermal sensor fixed at the bottom of the substrate. At room temperature, the base pressure in the chamber is ~2 × 10⁻⁹ mbar. Gaseous CO (Hoekloos/Praxair, purity 99.9%) and CH3OH (Sigma-Aldrich, purity 99.9%) vapor are introduced in the dosing line, either separately (in the case of pure ices) or simultaneously for a binary ice. Beforehand, the methanol sample is purified through multiple freeze-pump-thaw cycles. The ices are then grown on the substrate through background deposition by admitting the pure species or mixtures into the main chamber via an all-metal leak valve that faces the walls of the chamber. This deposition method leads to more uniform ices and better simulates the deposition conditions on interstellar dust grains. Amorphous CO ice is deposited at the lowest substrate temperature of 20 K, while crystalline CO is grown at 29 K (see, e.g., Kouchi 1990). The different solid-state configurations are confirmed by the clearly sharper CO-stretching feature of the cCO IR spectra. After deposition, all ices are maintained at 20 K during the irradiations.
The ice growth and the effects of the IR irradiation are monitored in situ through reflection-absorption IR spectroscopy (RAIRS) using a Fourier Transform IR spectrometer. The FTIR spectra cover a range of 5000−600 cm−1 with a resolution of 0.5 cm−1. To calculate the column density (NX) of the species in the ice, a modified Beer–Lambert law is applied to convert the IR integrated absorbance ( ∫ Abs(v)dv) to the absolute abundance:
 (1)
(1)
where  is the absorption band strength of a given species. Since the band strengths of CO and CH3OH have not been estimated for the LISA setup in reflection mode, we use the transmission values from the literature instead. Specifically, we have
  cm molecule−1 (Jiang et al. 1975) and
  cm molecule−1 (Hudgins et al. 1993). Since the RAIRS technique is more sensitive than transmission IR spectroscopy, the column densities derived here should be regarded as upper limits. The details of each experiment performed in this work are listed in Table 1.
For the IR irradiation of the ice, we used the IR-FEL source FELIX-2 to generate nearly monochromatic mid-IR photons in the ranges of 2.9–4.5 µm (fundamental mode) and 4.5–9.7 µm (third harmonic mode). The photons are bunched in 5–10 µs-long macropulses with a repetition rate of 5 Hz, consisting of a train of micropulses of several picoseconds spaced out by 1 ns. Unless otherwise specified, at longer wavelengths (≳4.5 µm), the energy of the macropulses is attenuated to a constant value of ~20 mJ, as measured at the diagnostic station located before the LISA end-station area of the facility. At shorter wavelengths (≲4.5 µm), the laser energy is kept at its highest attainable value of ~5 mJ, as it is generated in the third harmonic mode. The fluence of IR photons with wavelength À in each experiment can be calculated via the expression:
 (2)
(2)
where Eλ is the energy and r is the repetition rate of the macropulses, S is the area of the FELIX-2 beam spot on the substrate, and t is the duration of the irradiation. The FEL beam impinges the gold-plated flat substrate at an angle of 45° with respect to the surface, resulting in an elliptical spot size of ~1.0 × ~1.5 mm in semi-axes. In comparison, the FTIR beam angle with the gold substrate is of 13°, resulting in an elliptical spot size of ~1.5 × ~6.5 mm in semi-axes. Consequently, the FTIR RAIRS beam fully covers the region irradiated by the FEL beam, with a FTIR/FEL area ratio of ≳6. The spectral FWHM of FELIX-2 is estimated to be ~0.8% δλ/λ for the entire wavelength range.
A z-translator allows the movement of the substrate in height, providing multiple ice spots for systematic IR irradiation. In this work, we utilize seven different substrate positions, each separated by 4 mm from the neighboring spot. Each FEL irradiation is thereby performed at an unirradiated ice spot (unless otherwise specified). With the exception of the long aCO and cCO experiments, the irradiations are subsequently repeated, on average, two additional times for each spot. This is done to ensure reproducible results. As stated above, the FTIR beam is ≳6× larger in area than the FEL beam, thus part of the ice probed by the FTIR is not exposed to FEL irradiation. As a result, the difference FTIR spectra acquired before and after FEL irradiation are utilized to visualize changes in the ice. During the irradiation experiments, any possible desorption of species from the ice was monitored by a quadrupole mass spectrometer (QMS). Control temperature-programmed desorption (TPD) experiments with analogous deposition conditions and a ramping rate of 2.5 K min−1 were performed to assist in interpreting the IR-FEL irradiation results. In this work, we discuss FEL irradiations in terms of wavelength and FTIR spectra in wavenumbers (both in vacuum) to reflect the higher spectral resolution of the FTIR data, as opposed to the transform-limited bandwidth of the FEL photons.
Overview of the experiments performed in this work.
3 Results and discussion
Figure 1 shows the spectra of the ices of pure CH3OH (panel a), pure CO (both aCO and cCO, panel b), and 1:0.3 and 1:3.0 mixtures of CO:CH3OH in panels c and d, respectively. Also indicated in this figure are the involved vibrational modes. The wavelengths of FELIX-2 used during the irradiations are marked by the dashed vertical lines and their respective FWHMs are shown by the shadowed areas. Given the broad wavelength coverage of the FTIR measurements, the laser bandwidths are hard to see in panels a, c, and d, but the shadowed area is substantially larger in panel b because of the smaller spectral range shown here. For each experiment (i.e., pure CO, pure CH3OH, and mixtures), we use the same color scheme throughout the paper. The individual ices are discussed below.
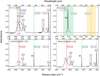 |
Fig. 1 Spectra and irradiation maps of the ices explored in this work, all taken at 20 K. Panel a: pure amorphous CH3OH. Panel b: pure amorphous and crystalline CO. Panel c: mixture of CH3OH and CO with a CO:CH3OH ratio of 1:0.3. Panel d: same as panel c, but with a 1:3.0 ratio. All spectra are taken after deposition and before irradiation. The wavelengths of FELIX-2 used later for on and off-resonance irradiation are shown with dashed lines, and the FWHM is visible from the shadowed areas. The fundamental mode of CO is denoted in boldface, and the other labels correspond to the (vX) vibrational modes of CH3OH. |
3.1 CH3OH
3.1.1 Morphology
Figure 2 shows the difference spectra obtained before and after continuous exposure for 5 min, of pure CH3OH ice to the FEL light at 2.96 (v1), 3.07 (v1), 3.14 (v1), 4.67 (off-resonance), and 9.62 (v8) µm. Intermolecular interactions give rise to the OH-stretching features of CH3OH at 3.07 and 3.14µm (see, e.g., Jakobsen et al. 1967; Hudgins et al. 1993), while the shoulder feature at 2.96 µm has been suggested to originate from molecules with weakly bound O–H bonds, or potentially dangling bonds, due to pores in the ice (Luna et al. 2018). The macropulse energies of all irradiations are adjusted to a constant value of ~5mJ. Modifications to the CH3OH band profiles are clearly observed for all exposures in which the IR wavelength is on resonance with absorption bands of methanol. Comparatively, no differences are observed after the off-resonance irradiation (i.e., at 4.67 µm). Thus, the observed spectral changes are a consequence of the absorption of IR radiation by the methanol ice, and not by the golden substrate underneath–in agreement with what has been previously observed for pASW and CO2 ices (Noble et al. 2020; Ioppolo et al. 2022). Overall, each CH3OH absorption feature shows similar spectral changes in the difference spectra of all on-resonance irradiations, with variations only appearing in their intensities. The most pronounced effects are observed for the irradiations at the OH-stretching region. Indeed, we may expect that irradiations at the OH-stretch – which has a higher band strength – would result in more photon-absorption events than those on resonance with the CO-stretching mode. Furthermore, the exposure at the CH3OH v1 band at 2.96 µm, in particular, yields changes that are significantly stronger than the other OH stretches. The fact that neighboring irradiations in the OH-stretching region yield such varying results highlights the high dependence of the energy-dissipation mechanisms on the type of vibrational mode excited, even within similar energy ranges. Irradiations at the CH-stretching modes of CH3OH are also performed (not shown) and result in similar spectral changes to the other on-resonance spectra, albeit with lower intensities.
The features around the OH- and CO-stretching bands of methanol in the difference spectra show both positive and negative components that yield a negligible net integral absorbance. Those features are thus attributed to the restructuring of the ice upon exposure to the IR-FEL with a power of ~5 mJ, leading to an overall loss of the weakly bound O–H modes at 2.96 µm and corresponding gain of bulk O–H modes at 3.07 and 3.14 µm. A similar behavior was observed for O–H dangling modes versus bulk modes of IR-FEL irradiated pASW (Coussan et al. 2022). Moreover, the CO-stretching band profiles show an overall narrowing trend, typically on the order of 0.2%. It should be noted that the significantly larger area of the FTIR beam in comparison with the IR-FEL beam results in an appreciable (≳6×) dilution of the laser effect on the recorded IR band shapes, meaning that the aforementioned percentage is, in fact, a lower limit.
To investigate the character of the morphological changes induced by the IR-FEL, we performed a control TPD experiment of unirradiated pure CH3OH ice deposited under the same conditions as in the irradiation study. Such an experiment allows to compare controlled thermally induced morphology changes with those induced upon IR irradiation. The IR spectra acquired during the TPD experiments are reported in Appendix A. The spectra, as obtained for different temperatures, were compared to the difference spectra before and after irradiation. The best qualitative fit to the most effective irradiation at v1 (i.e., the TPD result that best reproduces the irradiation) is obtained by the difference between the spectra taken at 80 K and 20 K, as shown in Fig. 2. The profile of the IR spectrum obtained during the TPD experiment reproduces that of the irradiation spectrum for the OH-stretching modes quite well, whereas discrepancies arise in the intensity of the changes for the CO-stretching counterpart. Nonetheless, the overall profiles of both difference spectra acquired during irradiation and the TPD experiment are remarkably similar. This is a strong indication that for pure methanol ices, the excess vibrational energy is efficiently dissipated throughout the bulk of the ice in an equivalent manner to thermal heating of an extended area. This energy dissipation leads to restructuring toward a more organized morphology, as observed previously for pASW and CO2 ices (Noble et al. 2020; Ioppolo et al. 2022; Coussan et al. 2022).
The polarity of the ice could play a role in the effectiveness of the vibrational energy dissipation through restructuring: similarly to the case of methanol ice reported here, Noble et al. (2020) observed that the difference spectra upon IR-FEL irradiation of pASW can be satisfactorily reproduced by the subtraction of the-oretical spectra simulating a restructuring of the ice. However, Ioppolo et al. (2022) found that for CO2 ices, local restructuring alone is not sufficient to explain the changes induced by the IR-FEL. Alternatively, this difference could also be related to the type of intermolecular interactions within the ice, in which H-bonding networks could potentially facilitate the vibrational energy dissipation through restructuring, while generally weaker van der Waals interactions could be less efficient in doing so. Indeed, transfer of vibrational energy has been shown to occur in H2O ices through hydrogen-bonded water molecules with resonant O–H stretches, which leads to local heating and restructuring of the ice (Cuppen et al. 2022).
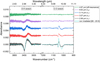 |
Fig. 2 Difference spectra obtained before and after 5 min of IR-FEL irradiation on methanol ice at 20 K. The difference between spectra acquired at 80 K and 20 K (without IR irradiation) during a TPD control experiment is also shown in cyan and included in the 2.96 µm plot. To allow for a direct comparison, all spectra are plotted for the same scale; the differences in the noise level between 3 µm and 9 µm are due to the intrinsic wavelength-dependent S/N of the FTIR. The irradiation spectra are offset for clarity. |
3.1.2 Power-dependence analysis and photodesorption
It is possible to assess whether the changes to the CH3OH ice are due to single- or multi-photon processes through a power-dependence analysis. We performed IR-FEL irradiations of a pure CH3OH ice sample at 9.62 µm with three different power settings (5.76 mJ, 57.6 mJ, and 115 mJ) for 5 min and compared the resulting integrated net areas around the v8 absorption band of methanol as a function of IR-FEL power. Figure 3 shows a fairly linear (R2 = 0.98) correlation between beam power and area, further suggesting that the effect of the IR-FEL laser on the ice morphology is due to single-photon processes (Noble et al. 2020; Ioppolo et al. 2022; Coussan et al. 2022). The decreasing trend in the integrated absorption signal at the v8 band with increasing beam power suggests that photodesorption might be observed in the IR spectra once enough vibrational excitations take place in the ice. The extent of the desorption is however not high enough to be detectable with the sensitivity of the current QMS. From the integrated absorption signal of the CH3OH v8 band lost after the 115 mJ irradiation and the total beam fluence (~ 1.8 × 10²³ photons cm−2), we derived a tentative upper limit to the photodesorption rate of r = (1.6 ± 0.5) × 1012 molecules J−1, or r = (3 ± 1) × 10−8 molecules photon−1. We considered only the uncertainties in the band strength to derive the errors in the photodesorption rates, although other error sources could also have an influence. The restructuring of the ice is expected to have a minor effect on the band strength of CH3OH, as it was shown to only change appreciably at temperatures above the crystallization of methanol (Luna et al. 2018).
The resulting rate is several orders of magnitude lower than typical (non-dissociative) CH3OH UV photodesorption counterparts, of 10−5 molecules photon−1 (Bertin et al. 2016), but it is still measurable because of the much higher IR flux of FELIX-2 compared to the UV-broadband flux of a microwave H2 discharge lamp (Ligterink et al. 2015; Cruz-Diaz et al. 2016) or monochromatic radiation of a synchrotron VUV beam (Fayolle et al. 2011). At a first glance, the astronomical relevance of such a low photodesorption rate may be considered negligible, but it is important to realize that in dense interstellar clouds, the IR photon fluxes are ≳104 times higher than that of the secondary UV, resulting in comparable efficiencies for IR-induced photodesorption phenomena in the interstellar medium. These efficiencies and their impacts on astrochemical models are further discussed in Sect. 4. Furthermore, while UV studies show that CH3OH largely fragments upon electronic excitation (Bertin et al. 2016), it is likely that upon IR excitation desorption follows a non-dissociative pathway, further influencing the predicted abundance of CH3OH in the gas phase.
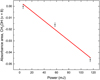 |
Fig. 3 Power-dependence analysis of the IR-FEL effect on CH3OH ice. The three different power settings, i.e., 5.76, 57.6, and 115 mJ, are controlled by attenuating a 115 mJ beam with 13, 3, and 0 dB, respectively. Error bars correspond to the three sigma limit of the instrumental error as derived from the integrated noise signal of the off-resonance difference spectrum in the same band width. |
3.2 CO
3.2.1 Morphology
The difference spectra obtained before and after 10 min of IR-FEL exposure of amorphous and crystalline CO ice at 4.67 and 5.2 µm are shown in Fig. 4. Since there is only one vibrational absorption band available to resonant irradiation in the CO-ice case, thereby limiting the number of excitations to perform and leaving more time to perform longer irradiations, we opted for a higher IR-FEL fluence (i.e., ten instead of 5 min of irradiation) in order to further increase the signal-to-noise ratio (S/N) in the IR difference spectra. Irradiations of CO ice at wavelengths off-resonance (i.e., at 5.20 µm) show a feature that turns out to be due to the ongoing stabilization of the ice – a process that extends to a time frame of several hours after deposition. This is confirmed by recording spectra taken 10 min apart (without any exposure to the IR-FEL) directly before performing the irradiations. Their difference spectra show similar features with identical intensities to the one observed in the 5.20 µm case. For direct comparison, the IR spectra of the 4.67 µm and 5.20 µm irradiations (corrected for the artifacts due to ice stabilization) are shown in Appendix B.
Due to the intrinsic bandwidth, the irradiation at 4.67 µm overlaps with both the longitudinal optical (LO) and transverse optical (TO) phonons of the vibrational mode of CO at ~2142 and ~2138 cm−1, respectively. The on-resonance FEL exposure at 4.67 µm yields more pronounced (~2×) modifications to the ice in the amorphous case than in the crystalline counterpart. This is in line with the hypothesis that the ice undergoes some degree of restructuring toward a more organized configuration, in which case cCO would reach a saturation point more quickly, as its structure is already largely organized. Similar saturation effects have been reported in previous studies on crystalline H2O and CO2 ices (Noble et al. 2020; Ioppolo et al. 2022).
The beam exposure at 4.67 µm is compared to the TPD difference spectrum between 25 K and 20 K, also shown in both panels in Fig. 4. As shown by the difference spectrum from the TPD experiment, heating of the ice causes the CO molecules to reorganize in a more compact configuration, resulting in a narrower band profile. Additionally to the narrowing effect, the irradiation spectrum also shows a slight overall blueshift of the CO band, suggesting that repulsive interactions between the molecules might become more prominent upon restructuring. Concomitant ice stabilization could contribute to the apparent blueshift, albeit to a smaller extent. Ultimately, the spectral changes induced by the IR-FEl cannot be simply reproduced by the TPD-IR results – in contrast to the case of CH3OH shown in Fig. 2. This suggests that the dissipation of vibrational energy throughout the CO ice is not as efficient as for CH3OH and thus the effects of the IR-FEL exposure in the former case cannot be described solely by an extended heating that transforms the structure of the ice.
3.2.2 Photodesorption
To thoroughly investigate the temporal effects of vibrational energy injection into pure CO ice and the possibility of photodesorption, we systematically irradiated both the amorphous and crystalline samples at 4.67 µm for different irradiation durations. In Fig. 5, the integrated net area around the CO stretching mode obtained from the difference spectra before and after each irradiation are shown as a function of irradiation time (i.e., fluence). The error bars include the fluctuations in integrated absorbance area due to the stabilization of the ice, such as the artifacts seen after the irradiation at 5.20 µm in Fig. 4.
The overall absorbance area of the stretching feature of aCO decreases linearly with irradiation fluence, strongly suggesting a continuous loss of material upon exposure to the beam due to IR-induced photodesorption. On the contrary, there is no significant loss in the intensity of the stretching mode of crystalline CO due to irradiation for the fluences explored in this work. Thus, cCO does not seem to photodesorb (as effectively) as a result of IR-photon absorption to the same extent that aCO does. This contrasts with results on H2O ices irradiated by IR-FEL reported by Noble et al. (2020), in which case pASW was observed to mainly restructure upon vibrational excitation, with only a minor potential contribution from photodesorption. On the other hand, irradiated cubic crystalline ices underwent pure photodesorption, totaling a loss of ~15% of the deposited material. The different nature of the intermolecular interactions among CO and H2O ices could be the reason behind this discrepancy. van Hemert et al. (2015) predicted the UV-induced photodesorption probability of cCO to be around five times smaller than that of aCO, which they attributed to the stronger binding of the molecules in the crystalline structure. This value is remarkably consistent with experimental measurements of CO photodesorption as a function of deposition temperature (Öberg et al. 2009). Likewise, the same effect could also contribute to the significantly lower desorption efficiency of cCO upon FEL irradiation. Since the observed decrease in the CO band intensity does not happen at the precise wavelength of irradiation (which is shifted from the CO peak), we can rule out the contribution from hole-burning effects to the negative integrated areas.
The transfer of vibrational energy to translational energy (i.e., vibrationally induced photodesorption) by CO molecules has been previously predicted to be inefficient (van Hemert et al. 2015; Fredon et al. 2021). In this work, we observe a total absolute loss of ~2.6 × 10¹⁵ molecules cm−2 of aCO as a result of 80 min of irradiation, which yields a relatively small amount of desorbed species that is below the detection limit of the QMS, rendering the mass spectrometry data inconclusive. Nonetheless, our IR spectroscopy data provide clear evidence of a CO photodesorption process that has not been predicted by the aforementioned models. From the total column density loss of aCO after 80 min of irradiation and the total beam fluence integrated over the entire exposure time (~2.4 × 10²³ photons cm−2), we derive a tentative upper limit to the photodesorption rate of r ~ (2.6 ± 0.8) × 1011 molecules J−1 or ~(1.1 ± 0.3) × 10−8 molecules photon−1 . The errors were estimated from the band strength uncertainties. Similarly to CH3OH, changes in the band strength of CO due to restructuring are expected to be minor, and the derived rate translates to a CO desorption efficiency induced by IR photons comparable to the UV value under interstellar conditions (see Sect. 4). Moreover, the linear trend between the decrease in integrated absorption signal and photon fluence is further evidence of a zeroth-order, single-photon interaction of the IR beam with the ice leading to desorption, as has been observed before for the UV-induced photodesorption of CO (Öberg et al. 2007; Muñoz Caro et al. 2010, 2016; Fayolle et al. 2011; Chen et al. 2014; Paardekooper et al. 2016). Similar to this work, other studies of FEL exposure to pASW and CO2 ices suggest the occurrence of IR-induced photodesorption (see, e.g., Noble et al. 2020; Ioppolo et al. 2022; Coussan et al. 2022).
In the case where multiple CO species are vibrationally excited simultaneously, effects such as VEP phenomena can arise. In the interstellar medium this is rather unlikely, but for the high fluxes used in the laboratory this should not be a priori neglected. As a consequence, some desorption mechanisms could in principle become accessible to CO molecules that collect energy from their neighbors and reach higher vibrational levels (DeVine et al. 2022). Differently from DeVine et al. (2022), however, we do not detect any photoinduced products upon irradiation of aCO nor cCO. This is likely due to the differences between the experimental conditions of both studies (e.g., ice morphology, thickness, IR-photon generation method) that result in a significant quenching of the pooling effect during our experiments in comparison to DeVine et al. (2022). Indeed, simultaneously excited species at any given time are expected to be very diluted within the ice in this work, as the number of absorption events per IR-FEL pulse is estimated to be much lower (~0.1%) than the total ice column density. Excited species are therefore expected to be sufficiently apart to prohibit effective interactions. Moreover, it is worth emphasizing that multi-photon excitations are unlikely under our experimental conditions, as shown by the linear trend in Fig. 3.
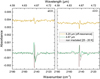 |
Fig. 4 Difference spectra obtained before and after 10 min of IR-FEL irradiation on aCO ice (left panel) and cCO ice (right panel), both at 20 K. The difference between spectra acquired at 25 K and 20 K during a TPD control experiment is shown in brown. The irradiation spectra are offset for clarity. |
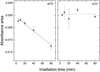 |
Fig. 5 Plot of the integrated area of the stretching mode of CO in the difference spectra obtained as a function of irradiation time. Left panel: irradiation of amorphous CO ice. The solid line shows the linear fit to the points. Right panel: irradiation of crystalline CO ice. The averaged integrated noise is denoted by the dashed line. |
3.3 Mixtures
3.3.1 Morphology
To further explore the impact of the chemical environment on the dissipation of vibrational energy, we performed irradiation experiments on ice mixtures of CO and CH3OH with ratios of CO:CH3OH = 1:0.3 (CO-rich) and 1:3.0 (CH3OH-rich). As methanol is expected to form through CO hydrogenation, such mixtures are of direct astronomical relevance (Watanabe & Kouchi 2002; Fuchs et al. 2009; Cuppen et al. 2011). The difference spectra of both mixtures obtained before and after 5 min of FEL exposure at 20 K are shown in Fig. 6. For comparison, we maintain the same absolute column densities of CO in both CO-rich and methanol-rich ices (see Table 1).
The FEL exposures of the CO-rich ice do not result in any significant changes around the methanol features (i.e., CO and OH stretches), namely, above the detection limit (top panel of Fig. 6). This is likely because the impact of restructuring changes of the deposited amount of methanol remains within the spectral noise level. The CO feature, conversely, is modified by the IR-FEL irradiation at both 4.67 and 9.62 µm, displaying the same spectral profile in both cases. After 5 min of irradiation with ~20 mJ, the ice becomes saturated to the IR-FEL effects (see Fig. C.1). This indicates that the absorption of photons by either CO or CH3OH molecules (at 4.67 and 9.62 µm, respectively) leads to similar modifications of the ice, which result in a slight redshift of the overall CO band profile. The IR difference spectrum obtained during TPD between 25 K and 20 K reproduces the CO shape reasonably well (see upper graph in the top panel), meaning that most ice changes can be explained by an extended heating-like event upon photon absorption that leads to a more organized configuration. However, the negative features in the irradiation spectra are not completely reproduced by the TPD control experiment, which suggests that additional desorption could also be taking place. It is worth noting that both the irradiation and TPD difference spectra of the CO-rich mixture display a different profile around the CO band compared to the pure aCO ice. In the TPD experiments, pure amorphous CO becomes narrower with higher temperatures as a result of an increasingly ordered configuration, but no change in peak position is observed. In the binary ice, conversely, the CO stretching mode becomes slightly redshifted at higher temperatures, indicating that (more) attractive interactions dominate the new CO sites. These observations highlight the crucial role played by the surrounding species on solid-state IR band shapes. Moreover, the on-resonance irradiation at the v1 vibrational mode of CH3OH at 3.07 µm results in no apparent changes around the CO feature, despite it yielding the most pronounced effects in the case of pure methanol ice. These observations provide further evidence of the strong dependence of the dissipation of vibrational energy on the involved excited vibrational mode and on interactions with the surrounding ice matrix.
In the case of the methanol-rich ice, modifications to both species’ bands upon irradiation are observed above the detection limit of the instrument (bottom panel of Fig. 6). The higher absolute abundance of methanol in this case compared to the CO-rich ice allows for more IR photons to be absorbed when irradiation is on resonance with methanol absorption wavelengths. As a consequence, the exposures at 9.62 µm and especially at 3.07 µm result in significantly more intense changes to the CO band than in the CO-rich ice. In the latter case, the irradiation at the v1 mode of CH3OH leads to no differences in the CO band, while in a more methanol-rich environment (likewise in pure methanol ice), it yields the most pronounced profile changes. The methanol features in this mixture, however, display a remarkably different behavior upon irradiation at its OH stretching mode in comparison to the pure methanol case. Clearly, the changes in the band profiles of both CH3OH and CO species are highly dependent on the excited vibrational mode, as found by the differences of the shapes resulting from the three irradiation frequencies. Interestingly, when irradiated at 3.07 µm and 4.67 µm, the profile of the stretching feature of CO in the methanol-rich mixture is the inverse of what is observed for the CO-rich counterpart: while the IR excitation of the former leads to a blueshift of the peak, in the latter it results in its redshift. In fact, the blueshifted profile better resembles the one observed in the irradiation of pure aCO, despite their very different surrounding conditions. These profiles are repeatedly observed during additional measurements of the CH3OH-rich ice mixture (see Fig. C.2). However, the mechanisms that result in such effects are still unclear. Further systematic investigation of the dissipation of vibrational energy by CO:CH3OH ice mixtures with various ratios are warranted to fully understand these observations.
Both irradiations at 3.07 and 4.67 µm lead mainly to a decrease in the area of the OH-stretching band of methanol, as well as a narrowing of its CO stretching mode. Comparatively, the irradiation at 3.07 µm results in a more complex difference spectrum, which shows methanol vibrational modes that do not follow a clear trend in overall band shift nor width change. Furthermore, despite both ices containing the same column density of CO molecules, the higher abundance of surrounding CH3OH species in the methanol-rich ice results in more intense changes to the CO band, even upon irradiation at 4.67 µm. As was observed by Cuppen et al. (2022) in H2O ices, it is likely that the higher fraction of hydrogen-bonded species in the CH3OH-rich mixture facilitates the vibrational energy transfer in comparison to the CO-rich counterpart, thus resulting in more intense spectral changes. In both ice mixtures, irradiations at the CH-stretching bands of methanol (not shown) yield similar changes to the other modes, but less intense.
Fredon et al. (2021) have explored the dissipation of different types of energy (i.e., vibrational, rotational and translational) by admolecules on top of an ASW surface using molecular dynamics simulations. They observed that the distribution of vibrational energy among the species’ vibrational modes heavily impacts the energy dissipation channels, in agreement with our experimental results and those of previous IR-FEL exposure works (Noble et al. 2020; Ioppolo et al. 2022; Coussan et al. 2022; Cuppen et al. 2022). They also concluded that the dissipation of vibrational energy from the admolecule to the surface occurs through the excitation of a surface-admolecule bond. Thus, intermolecular interactions clearly play a key role in this process and this is corroborated by our experimental results. Further theoretical works on the dissipation of vibrational energy in ice mixtures are needed to fully understand the profile changes observed in Fig. 6.
As for the CO-rich case, the irradiation spectrum of the methanol-rich ice at 9.62 µm is best reproduced by the corresponding TPD difference spectrum between 25 and 20 K. Yet, neither the band profiles nor the relative intensities can satisfactorily match that of the 9.62 µm irradiation spectrum, which displays more negative features than the TPD control experiment overall. This indirectly implies that consumption of the ice material should take place, for instance, through the photodesorption of CO, CH3OH, or both. We do not detect any new signals in the IR spectra after irradiation, and therefore IR-induced photochemistry is unlikely to contribute to this effect. Additionally, the irradiations at 3.07 µm and 4.67 µm yield difference spectra that cannot be reproduced by any combination of the TPD control spectra and, thus, it must be dominated by a process other than extended heating.
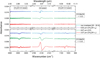 |
Fig. 6 Difference spectra obtained before and after 5 min of IR-FEL irradiation on ice mixtures of CO and CH3OH at 20 K. Upper panel: mixture ratio of CO:CH3OH = 1:0.3. Lower panel: mixture ratio of CO:CH3OH = 1:3.0. The control TPD difference spectra between 25 K and 20 K are also shown in cyan. The irradiation spectra are offset for clarity. |
3.3.2 Photodesorpion
As discussed above, the 9.62 µm difference spectrum of the methanol-rich mixture hints at the possibility of photodesorption taking place. We further investigate this hypothesis by performing successive FEL 5-min exposures at 9.62 µm on a same spot and varying the power settings. For the first irradiation, the ~60mJ beam is attenuated by 5 dB to yield a total power of ~20 mJ. The second irradiation is performed at the full beam power of ~60 mJ. The resulting difference IR spectra and corresponding QMS data are presented in Fig. 7.
The difference spectrum of the first irradiation is consistent with the 9.62 µm irradiation spectrum shown in the lower panel of Fig. 6, which was performed at similar conditions. In the case of UV experiments, photo-induced codesorption (i.e., the excitation of one species leading to the desorption of another) has been observed in the past for CO:N2 and CO:CO2 ice mixtures (Bertin et al. 2013; Fillion et al. 2014), but did not proceed following the excitation of CO in CO:CH3OH mixtures (Bertin et al. 2016). In contrast, both CH3OH and CO seem to potentially desorb from the ice to some extent upon IR excitation of methanol, given by the decrease in the intensity of their vibrational modes after the exposure to the free-electron laser. This desorption, however, is expected to be small, as no signals of CO nor CH3OH were detected in the QMS (see the right panel in Fig. 7). From the areas of the negative peaks in the IR difference spectrum, we estimated an absolute loss in column density of ~1.1 × 10¹⁵ and ~0.6 × 10¹⁵ molecules cm−2 for CO and CH3OH, respectively. Upon increasing the beam power to its highest attainable value of ~60 mJ, the second irradiation results in a difference spectrum with much more pronounced features. The CO stretching mode decreases in intensity drastically, as shown by its prominently negative peak. Moreover, we detected an increase in the mass signal of CO clearly above noise level upon the start of the irradiation. Comparatively, no increase in mass signal was detected for CH3OH (not shown), and no new signals were observed in the IR spectrum. These two techniques together confirm the IR-induced photodesorption of CO from the methanol-rich ice. The negative peaks in the IR difference spectrum after the 5-min irradiation yield CO and CH3OH absolute losses, respectively, of ~8.7 × 10¹⁵ and ~1.3 × 10¹⁵ molecules cm−2 for a fluence of ~9.2 × 10²² photons cm−2. This corresponds to photodesorption rates of ~(9 ± 3) × 10−8 molecules photon−1 and ~(1.4 ± 0.4) × 10−8 molecules photon−1, respectively. The former is ~8× higher than the estimated photodesorption rate of pure CO, whereas the latter is ~2× lower than pure CH3OH. Since the irradiation frequency (9.62 µm) is on resonance with the v8 vibrational mode of CH3OH, its energy dissipation mechanisms must lead to the desorption of CO in a more effective way than by direct vibrational excitation. This can happen, for instance, as a result of the reorganization of the methanol species towards a more stable configuration, which might spatially force CO species out of the ice. Alternatively, energy transfer effects between interacting neighboring CO and CH3OH could also play a part in the sublimation of CO; for example, through the higher density of H-bond interactions among species in a CH3OH-rich ice. In contrast, the photodesorption of methanol becomes less effective in the mixture than in the pure ice. These hypotheses will be investigated more deeply in future IR-FEL studies with interstellar ice analogues.
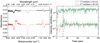 |
Fig. 7 IR and QMS data obtained for two successive 9.62 µm FEL exposures of the methanol-rich ice performed at the same substrate position (i.e., without moving the translation stage) and at 20 K. The first (black) irradiation was attenuated to a power of ~20 mJ, whereas the second (red) is performed at the full attainable power of ~60 mJ. Left panel: difference of the spectra acquired before and after the irradiations. The spectra are offset for clarity. Right panel: superposition of the QMS data for the mass signal of CO (m/z = 28) measured concomitantly to the IR spectra during the FEL exposures (green lines) and their corresponding smoothed signal (black and red lines). The dashed line indicates the beginning of the irradiations. |
4 Astrophysical implications
In this work, we have focused on the IR irradiation of interstellar ice analogues. We observe that, upon resonant vibrational irradiation, the ices of pure CO, pure CH3OH, and mixtures of the two will generally undergo restructuring towards a more compact configuration as a result of vibrational energy dissipation. Thus, even in regions with low typical temperatures (such as dense molecular clouds), we would nonetheless expect the icy grains to contain some degree of organization, either as a result of IR photon absorption or other phenomena leading to vibrational excitation in the ice. This could potentially influence not only the IR band profiles of the species in the mantle, but also their diffusion, adsorption, desorption, and reaction rates, which in turn can significantly impact astrochemical models and observations. Evidently, the extent of this effect strongly depends on how localized the changes are in the ice and how frequently it is being processed. The implications of this will therefore be increasingly intense in regions with higher radiation fluxes.
We also provide compelling evidence of the desorption of carbon monoxide induced by both vibrationally excited CO and CH3OH molecules, as well as the IR-induced photodesorption of pure CH3OH ice. Those species are the main constituents of the apolar ice layer that shrouds interstellar dust grains and therefore their photoprocesses are of great relevance to the chemistry of the interstellar medium. Given the available specific fluxes of IR photons with ~4.7 and ~9.6 µm inside interstellar clouds: ~3 × 10⁹ and ~4 × 10⁸ photons cm−2 s−1, respectively (Mathis et al. 1983), and the upper limits to the photodesorption rates for pure aCO and CH3OH ices estimated here, we derived tentative IR-induced photodesorption efficiencies of ~3.3 × 101 molecules cm−2 s−1 for carbon monoxide and ~1.2 × 101 molecules cm−2 s−1 for methanol in molecular cloud conditions. Comparatively, the total UV flux (i.e., integrated for all frequencies) inside molecular clouds is estimated to be on the order of ~104 photons cm−2 s−1 (Cecchi-Pestellini & Aiello 1992). When multiplied by the derived UV-induced non-dissociative photodesorption rates of CO and CH3OH, this result yields respective efficiencies of ~(1.4–89) × 101 and ~1.0 × 10⁻¹ molecules cm−2 s−1. These values are summarized in Table 2. Notably, the UV-induced photodesorption efficiencies for CO are comparable to the IR-induced counterparts and for CH3OH, they are two orders of magnitude lower. The former values are, on the one hand, presented as upper limits due to the utilization of transmission instead of reflection band strengths to derive the photodesorption rates. On the other hand, the fact that the specific IR fluxes at the species’ peak absorption frequencies (instead of the integrated flux over the IR absorption width) are used in the calculations leads to an underestimation of the photodesorption efficiencies. The values listed in Table 2 should be considered tentative and a more thorough quantification of such efficiencies is warranted.
A caveat to these estimations is that the density of excitations (i.e., the number of simultaneously excited species in the ice) is considerably higher in laboratory experiments compared to the interstellar medium, which could play a part in the mechanisms that lead to IR-induced desorption. Still, only ~0.1% of the species in the ice are estimated to be excited per IR-FEL pulse, and therefore they should be sufficiently diluted that their interactions will have a minor effect. Moreover, the total photon fluence employed here correspond to 106–107 years of exposure in interstellar conditions, thus within molecular cloud timescales. Therefore, we expect that IR-induced photodesorption can greatly affect the abundance of CO and CH3OH in both the solid and gas phase, and we advise for this aspect to be taken into consideration when modeling the chemistry of interstellar environments. In particular, IR-induced photodesorption can potentially lead to an enhanced abundance of larger species, possibly even COMs, being preserved as they are ejected to the gas-phase from the ice, since the lower-energy IR photons are less likely to result in dissociation compared to UV rays. This could then help explain the observed abundances of CH3OH in the gas phase. More systematic works focused on the quantification of the IR-induced photodesorption rates of interstellar ice analogues are evidently of high interest and more research is needed, both to learn about the processing taking place at a molecular level and to extrapolate these findings to interstellar environments and timescales.
Comparison of the estimated fluxes, desorption rates, and desorption efficiencies of CH3OH and CO species induced by IR and UV photons.
5 Conclusions
In the present work, we use FELIX-2 with the LISA end station at the HFML-FELIX Laboratory to perform selective MIR irradiations of CO and CH3OH ices, as well as mixtures of the two, under interstellar conditions. The results are monitored using both reflection-absorption IR spectroscopy and mass spectrometry techniques. Additionally, control temperature-programmed desorption experiments on identical ices are performed to assist in the data interpretation. This study, using both resonant and off-resonance IR irradiation, offers tools to elucidate the physico-chemical processes that take place in the ice as a result of vibrational energy dissipation. Our main findings are summarized below:
The vibrational excitation of the species in the ice and the subsequent dissipation of this excess energy affects the ice morphology;
The ices explored here are restructured to a more organized configuration upon irradiation;
In the case of pure CH3OH ice, most of the changes in the irradiation spectra can be attributed to restructuring. However, for the pure CO ices and mixtures with methanol, additional phenomena such as photodesorption are needed to fully explain the difference spectra;
The changes in band shape upon irradiation are highly dependent on the FEL wavelength and the composition of the ice. Thus, the excited vibrational mode and the surrounding species must strongly affect the mechanism through which the excess vibrational energy is dissipated;
We find compelling evidence of IR-induced photodesorption of pure CO ice with a tentative estimated rate of ~(1.1 ± 0.3) × 10−8 molecules photon−1 upon excitation of its stretching mode. The photodesorption of CH3OH is also suggested upon excitation of it v8 mode, with a tentative estimated rate of ~(3 ± 1) × 10−8 molecules photon−1. Both (low) rates yield desorption efficiencies up to two orders of magnitude higher than UV-induced counterparts inside molecular clouds, because of the much higher IR fluxes in such environments. So even though the absolute rate is lower in the IR, the overall effect is expected to be around the same order of magnitude or greater;
Furthermore, the indirect photodesorption of CO upon IR irradiation on resonance with CH3OH is strongly suggested.
Given the influence of the ice morphology and composition in the rates of the processes that take place on icy grains, chemical models that involve solid-phase reactions would especially benefit from the inclusion of vibrational-energy dissipation mechanisms into the network. The tentative rates presented here will be further investigated in a follow-up study whereby time is made available to derive accurate absorption cross-sections for the applied reflection mode settings.
Acknowledgements
The authors thank the HFML-FELIX Laboratory team for their experimental assistance and scientific support, Prof. Liv Hornekær’s group for sharing data for comparison, and Dr. Thanja Lamberts for the insightful discussion on the interpretation of the data presented here. The LISA end station is designed, constructed, and managed at the HFML-FELIX Laboratory by the group of S. Ioppolo and the group of B. Redlich. This work was supported by the Danish National Research Foundation through the Center of Excellence “InterCat” (Grant agreement no.: DNRF150); the Netherlands Research School for Astronomy (NOVA); the Dutch Astrochemistry Network II (DANII); the Royal Society University Research Fellowships Renewals 2019 (URF/R/191018); the Royal Society University Research Fellowship (UF130409); the Royal Society Research Fellow Enhancement Award (RGF/EA/180306); and the Royal Society Research Grant (RSG/R1/180418). Travel support was granted by the UK Engineering and Physical Sciences Research Council (UK EPSRC Grant EP/R007926/1 – FLUENCE: Felix Light for the UK: Exploiting Novel Characteristics and Expertise). K.-J.C. is grateful for support from NWO via a VENI fellowship (VI. Veni.212.296).
Appendix A Control IR spectra
The difference IR spectra of the CO, CH3OH, CO:CH3OH = 1:0.3, and CO:CH3OH = 1:3 ices acquired during the control TPD experiments are shown in Figures A.1, A.2, A.3, and A.4, respectively. Differences are taken between a temperature T (as labeled in the legend) and the deposition temperature of 20 K.
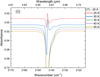 |
Fig. A.1 Control IR difference spectra of pure CO ice acquired during TPD. |
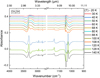 |
Fig. A.2 Control IR difference spectra of pure CH3OH ice acquired during TPD. |
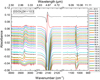 |
Fig. A.3 Control IR difference spectra of the CO:CH3OH = 1:0.3 ice mixture acquired during TPD. |
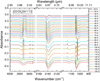 |
Fig. A.4 Control IR difference spectra of the CO:CH3OH =1:3 ice mixture acquired during TPD. |
Appendix B aCO ice stabilization
The difference IR spectra before and after irradiation of aCO ice corrected for stabilization are shown in Figure B.1. The correction is made by subtracting the signal due to ice stabilization,as obtained from two spectra taken 10 min apart and without IR-FEL exposure, from the irradiation difference spectra.
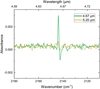 |
Fig. B.1 Difference spectra obtained before and after 10 min of IR-FEL irradiation on aCO ice at 20 K, corrected for ice stabilization. |
Appendix C Repeated irradiations on ice mixtures
The irradiations of the ice mixtures were performed a total of three times in a same substrate position each, namely, the translator stage was only used when the irradiation wavelength was changed. The difference spectra of the CO-rich and CH3OH-rich ice mixtures are shown in Figures C.1 and C.2, respectively. In the CO-rich case, the ice becomes saturated after the first irradiation at each frequency, and no significant effect (besides ice stabilization) can be seen in the repeated measurements. The irradiation at 9.62 µm was performed significantly later in the experiment shift, in which case the ice had had appreciably more time to stabilize, hence the smaller signal in its second and third measurements. In the CH3OH-rich ice case, saturation takes higher fluences to occur and the effects of the IR-FEL are still observable in the repeated irradiations.
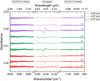 |
Fig. C.1 Difference irradiation spectra of repeated measurements on the CO-rich ice mixture. Irradiations at the same frequency were performed at the same substrate position and the ice is already saturated on each second and third measurements. |
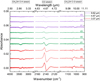 |
Fig. C.2 Difference irradiation spectra of repeated measurements on the CH3OH-rich ice mixture. Irradiations at the same frequency were performed at the same substrate position. |
References
- Bertin, M., Fayolle, E. C., Romanzin, C., et al. 2013, ApJ, 779, 120 [Google Scholar]
- Bertin, M., Romanzin, C., Doronin, M., et al. 2016, ApJ, 817, L12 [NASA ADS] [CrossRef] [Google Scholar]
- Boogert, A. C. A., Hogerheijde, M. R., & Blake, G. A. 2002, ApJ, 568, 761 [NASA ADS] [CrossRef] [Google Scholar]
- Boogert, A. C. A., Gerakines, P. A., & Whittet, D. C. B. 2015, ARA&A, 53, 541 [Google Scholar]
- Bottinelli, S., Boogert, A. C. A., Bouwman, J., et al. 2010, ApJ, 718, 1100 [NASA ADS] [CrossRef] [Google Scholar]
- Cecchi-Pestellini, C., & Aiello, S. 1992, MNRAS, 258, 125 [NASA ADS] [CrossRef] [Google Scholar]
- Charnley, S. B., Tielens, A. G. G. M., & Millar, T. J. 1992, ApJ, 399, L71 [Google Scholar]
- Chen, Y. J., Chuang, K. J., Muñoz Caro, G. M., et al. 2014, ApJ, 781, 15 [Google Scholar]
- Chen, L., Schwarzer, D., Verma, V. B., et al. 2017, Acc. Chem. Res., 50, 1400 [CrossRef] [Google Scholar]
- Chen, L., Lau, J. A., Schwarzer, D., et al. 2019, Science, 363, 158 [NASA ADS] [CrossRef] [Google Scholar]
- Chuang, K. J., Fedoseev, G., Ioppolo, S., van Dishoeck, E. F., & Linnartz, H. 2016, MNRAS, 455, 1702 [Google Scholar]
- Chuang, K. J., Fedoseev, G., Qasim, D., et al. 2018, ApJ, 853, 102 [NASA ADS] [CrossRef] [Google Scholar]
- Cooke, I. R., Fayolle, E. C., & Öberg, K. I. 2016, ApJ, 832, 5 [NASA ADS] [CrossRef] [Google Scholar]
- Corcelli, S. A., & Tully, J. C. 2002, J. Chem. Phys., 116, 8079 [NASA ADS] [CrossRef] [Google Scholar]
- Coussan, S., Noble, J. A., Cuppen, H. M., Redlich, B., & Ioppolo, S. 2022, J. Phys. Chem. A, 126, 2262 [NASA ADS] [CrossRef] [Google Scholar]
- Cruz-Diaz, G. A., Martín-Doménech, R., Muñoz Caro, G. M., & Chen, Y. J. 2016, A&A, 592, A68 [NASA ADS] [CrossRef] [EDP Sciences] [Google Scholar]
- Cuppen, H. M., Ioppolo, S., Romanzin, C., & Linnartz, H. 2010, Phys. Chem. Chem. Phys., 12, 12077 [Google Scholar]
- Cuppen, H. M., Penteado, E. M., Isokoski, K., van der Marel, N., & Linnartz, H. 2011, MNRAS, 417, 2809 [Google Scholar]
- Cuppen, H. M., Walsh, C., Lamberts, T., et al. 2017, Space Sci. Rev., 212, 1 [Google Scholar]
- Cuppen, H. M., Noble, J. A., Coussan, S., Redlich, B., & Ioppolo, S. 2022, J. Phys. Chem. A, 126, 8859 [NASA ADS] [CrossRef] [Google Scholar]
- DeLeon, R. L., & Rich, J. W. 1986, Chem. Phys., 107, 283 [NASA ADS] [CrossRef] [Google Scholar]
- DeVine, J. A., Choudhury, A., Lau, J. A., Schwarzer, D., & Wodtke, A. M. 2022, J. Phys. Chem. A, 126, 2270 [NASA ADS] [CrossRef] [Google Scholar]
- Draine, B. T., & Li, A. 2001, ApJ, 551, 807 [NASA ADS] [CrossRef] [Google Scholar]
- Fayolle, E. C., Bertin, M., Romanzin, C., et al. 2011, ApJ, 739, L36 [Google Scholar]
- Fayolle, E. C., Bertin, M., Romanzin, C., et al. 2013, A&A, 556, A122 [NASA ADS] [CrossRef] [EDP Sciences] [Google Scholar]
- Fedoseev, G., Chuang, K. J., Ioppolo, S., et al. 2017, ApJ, 842, 52 [Google Scholar]
- Fillion, J.-H., Fayolle, E. C., Michaut, X., et al. 2014, Faraday Discuss., 168, 533 [Google Scholar]
- Focsa, C., Chazallon, B., & Destombes, J. 2003, Surf. Sci., 528, 189 [NASA ADS] [CrossRef] [Google Scholar]
- Focsa, C., Mihesan, C., Ziskind, M., et al. 2006, J. Phys. Condensed Matter, 18, S1357 [NASA ADS] [CrossRef] [Google Scholar]
- Fredon, A., Groenenboom, G. C., & Cuppen, H. M. 2021, ACS Earth Space Chem., 5, 2032 [NASA ADS] [CrossRef] [Google Scholar]
- Fuchs, G. W., Cuppen, H. M., Ioppolo, S., et al. 2009, A&A, 505, 629 [NASA ADS] [CrossRef] [EDP Sciences] [Google Scholar]
- Goumans, T. P. M., Uppal, M. A., & Brown, W. A. 2008, MNRAS, 384, 1158 [NASA ADS] [CrossRef] [Google Scholar]
- Henderson, B. L., & Gudipati, M. S. 2014, J. Phys. Chem. A, 118, 5454 [NASA ADS] [CrossRef] [Google Scholar]
- Hiraoka, K., Ohashi, N., Kihara, Y., et al. 1994, Chem. Phys. Lett., 229, 408 [Google Scholar]
- Hudgins, D. M., Sandford, S. A., Allamandola, L. J., & Tielens, A. G. G. M. 1993, ApJS, 86, 713 [NASA ADS] [CrossRef] [Google Scholar]
- Ioppolo, S., Cuppen, H. M., Romanzin, C., van Dishoeck, E. F., & Linnartz, H. 2010, Phys. Chem. Chem. Phys., 12, 12065 [Google Scholar]
- Ioppolo, S., van Boheemen, Y., Cuppen, H. M., van Dishoeck, E. F., & Linnartz, H. 2011, MNRAS, 413, 2281 [NASA ADS] [CrossRef] [Google Scholar]
- Ioppolo, S., Noble, J. A., Traspas Muiña, A., et al. 2022, J. Mol. Spectrosc., 385, 111601 [NASA ADS] [CrossRef] [Google Scholar]
- Jakobsen, R. J., Mikawa, Y., & Brasch, J. W. 1967, Nature, 215, 1071 [NASA ADS] [CrossRef] [Google Scholar]
- Jiang, G. J., Person, W. B., & Brown, K. G. 1975, J. Chem. Phys., 62, 1201 [NASA ADS] [CrossRef] [Google Scholar]
- Kouchi, A. 1990, J. Cryst. Growth, 99, 1220 [Google Scholar]
- Kouchi, A., & Kuroda, T. 1990, Nature, 344, 134 [NASA ADS] [CrossRef] [Google Scholar]
- Krasnopoler, A., & George, S. M. 1998, J. Phys. Chem. B, 102, 788 [CrossRef] [Google Scholar]
- Li, A., & Draine, B. T. 2001, ApJ, 554, 778 [Google Scholar]
- Ligterink, N. F. W., Paardekooper, D. M., Chuang, K. J., et al. 2015, A&A, 584, A56 [NASA ADS] [CrossRef] [EDP Sciences] [Google Scholar]
- Linnartz, H., Ioppolo, S., & Fedoseev, G. 2015, Int. Rev. Phys. Chem., 34, 205 [Google Scholar]
- Luna, R., Molpeceres, G., Ortigoso, J., et al. 2018, A&A, 617, A116 [NASA ADS] [CrossRef] [EDP Sciences] [Google Scholar]
- Mathis, J. S., Mezger, P. G., & Panagia, N. 1983, A&A, 128, 212 [NASA ADS] [Google Scholar]
- McClure, M. K., Rocha, W. R. M., Pontoppidan, K. M., et al. 2023, Nat. Astron., https://doi.org/10.1038/s41550-022-01875-w [Google Scholar]
- Mihesan, C., Ziskind, M., Chazallon, B., et al. 2006, Appl. Surf. Sci., 253, 1090 [NASA ADS] [CrossRef] [Google Scholar]
- Millar, T. J., & Williams, D. A. 1993, in Dust and Chemistry in Astronomy, eds. T. J. Millar, & D. A. Williams (London: Institute of Physics Publishing), 1 [Google Scholar]
- Minissale, M., & Dulieu, F. 2014, J. Chem. Phys., 141, 014304 [NASA ADS] [CrossRef] [Google Scholar]
- Minissale, M., Dulieu, F., Cazaux, S., & Hocuk, S. 2016, A&A, 585, A24 [NASA ADS] [CrossRef] [EDP Sciences] [Google Scholar]
- Muñoz Caro, G. M., & Martín Doménech, R. 2018, Astrophysics and Space Sci. Lib., 451, 133 [CrossRef] [Google Scholar]
- Muñoz Caro, G. M., Jiménez-Escobar, A., Martín-Gago, J. Á., et al. 2010, A&A, 522, A108 [NASA ADS] [CrossRef] [EDP Sciences] [Google Scholar]
- Muñoz Caro, G. M., Chen, Y. J., Aparicio, S., et al. 2016, A&A, 589, A19 [NASA ADS] [CrossRef] [EDP Sciences] [Google Scholar]
- Müller, B., Giuliano, B. M., Goto, M., & Caselli, P. 2021, A&A, 652, A126 [NASA ADS] [CrossRef] [EDP Sciences] [Google Scholar]
- Noble, J. A., Dulieu, F., Congiu, E., & Fraser, H. J. 2011, ApJ, 735, 121 [NASA ADS] [CrossRef] [Google Scholar]
- Noble, J. A., Cuppen, H. M., Coussan, S., Redlich, B., & Ioppolo, S. 2020, J. Phys. Chem. C, 124, 20864 [Google Scholar]
- Oba, Y., Watanabe, N., Kouchi, A., Hama, T., & Pirronello, V. 2010, ApJ, 712, L174 [NASA ADS] [CrossRef] [Google Scholar]
- Oba, Y., Tomaru, T., Lamberts, T., Kouchi, A., & Watanabe, N. 2018, Nat. Astron., 2, 228 [NASA ADS] [CrossRef] [Google Scholar]
- Öberg, K. I. 2016, Chem. Rev., 116, 9631 [Google Scholar]
- Öberg, K. I., Fuchs, G. W., Awad, Z., et al. 2007, ApJ, 662, L23 [Google Scholar]
- Öberg, K. I., van Dishoeck, E. F., & Linnartz, H. 2009, A&A, 496, 281 [NASA ADS] [CrossRef] [EDP Sciences] [Google Scholar]
- Paardekooper, D. M., Fedoseev, G., Riedo, A., & Linnartz, H. 2016, A&A, 596, A72 [NASA ADS] [CrossRef] [EDP Sciences] [Google Scholar]
- Penteado, E. M., Boogert, A. C. A., Pontoppidan, K. M., et al. 2015, MNRAS, 454, 531 [NASA ADS] [CrossRef] [Google Scholar]
- Pontoppidan, K. M., Fraser, H. J., Dartois, E., et al. 2003, A&A, 408, 981 [NASA ADS] [CrossRef] [EDP Sciences] [Google Scholar]
- Porter, T. A., & Strong, A. W. 2005, in International Cosmic Ray Conference, 29th International Cosmic Ray Conference (ICRC29), 4, 77 [NASA ADS] [Google Scholar]
- Qasim, D., Chuang, K. J., Fedoseev, G., et al. 2018, A&A, 612, A83 [NASA ADS] [CrossRef] [EDP Sciences] [Google Scholar]
- Roueff, E., Ruaud, M., Le Petit, F., Godard, B., & Le Bourlot, J. 2014, IAU Symp., 297, 311 [NASA ADS] [Google Scholar]
- Santos, J. C., Chuang, K.-J., Lamberts, T., et al. 2022, ApJ, 931, L33 [NASA ADS] [CrossRef] [Google Scholar]
- Tielens, A. G. G. M., & Hagen, W. 1982, A&A, 114, 245 [Google Scholar]
- Tielens, A. G. G. M., Tokunaga, A. T., Geballe, T. R., & Baas, F. 1991, ApJ, 381, 181 [NASA ADS] [CrossRef] [Google Scholar]
- van Hemert, M. C., Takahashi, J., & van Dishoeck, E. F. 2015, J. Phys. Chem. A, 119, 6354 [NASA ADS] [CrossRef] [Google Scholar]
- Watanabe, N., & Kouchi, A. 2002, ApJ, 571, L173 [Google Scholar]
All Tables
Comparison of the estimated fluxes, desorption rates, and desorption efficiencies of CH3OH and CO species induced by IR and UV photons.
All Figures
|
Fig. 1 Spectra and irradiation maps of the ices explored in this work, all taken at 20 K. Panel a: pure amorphous CH3OH. Panel b: pure amorphous and crystalline CO. Panel c: mixture of CH3OH and CO with a CO:CH3OH ratio of 1:0.3. Panel d: same as panel c, but with a 1:3.0 ratio. All spectra are taken after deposition and before irradiation. The wavelengths of FELIX-2 used later for on and off-resonance irradiation are shown with dashed lines, and the FWHM is visible from the shadowed areas. The fundamental mode of CO is denoted in boldface, and the other labels correspond to the (vX) vibrational modes of CH3OH. |
| In the text | |
|
Fig. 2 Difference spectra obtained before and after 5 min of IR-FEL irradiation on methanol ice at 20 K. The difference between spectra acquired at 80 K and 20 K (without IR irradiation) during a TPD control experiment is also shown in cyan and included in the 2.96 µm plot. To allow for a direct comparison, all spectra are plotted for the same scale; the differences in the noise level between 3 µm and 9 µm are due to the intrinsic wavelength-dependent S/N of the FTIR. The irradiation spectra are offset for clarity. |
| In the text | |
|
Fig. 3 Power-dependence analysis of the IR-FEL effect on CH3OH ice. The three different power settings, i.e., 5.76, 57.6, and 115 mJ, are controlled by attenuating a 115 mJ beam with 13, 3, and 0 dB, respectively. Error bars correspond to the three sigma limit of the instrumental error as derived from the integrated noise signal of the off-resonance difference spectrum in the same band width. |
| In the text | |
|
Fig. 4 Difference spectra obtained before and after 10 min of IR-FEL irradiation on aCO ice (left panel) and cCO ice (right panel), both at 20 K. The difference between spectra acquired at 25 K and 20 K during a TPD control experiment is shown in brown. The irradiation spectra are offset for clarity. |
| In the text | |
|
Fig. 5 Plot of the integrated area of the stretching mode of CO in the difference spectra obtained as a function of irradiation time. Left panel: irradiation of amorphous CO ice. The solid line shows the linear fit to the points. Right panel: irradiation of crystalline CO ice. The averaged integrated noise is denoted by the dashed line. |
| In the text | |
|
Fig. 6 Difference spectra obtained before and after 5 min of IR-FEL irradiation on ice mixtures of CO and CH3OH at 20 K. Upper panel: mixture ratio of CO:CH3OH = 1:0.3. Lower panel: mixture ratio of CO:CH3OH = 1:3.0. The control TPD difference spectra between 25 K and 20 K are also shown in cyan. The irradiation spectra are offset for clarity. |
| In the text | |
|
Fig. 7 IR and QMS data obtained for two successive 9.62 µm FEL exposures of the methanol-rich ice performed at the same substrate position (i.e., without moving the translation stage) and at 20 K. The first (black) irradiation was attenuated to a power of ~20 mJ, whereas the second (red) is performed at the full attainable power of ~60 mJ. Left panel: difference of the spectra acquired before and after the irradiations. The spectra are offset for clarity. Right panel: superposition of the QMS data for the mass signal of CO (m/z = 28) measured concomitantly to the IR spectra during the FEL exposures (green lines) and their corresponding smoothed signal (black and red lines). The dashed line indicates the beginning of the irradiations. |
| In the text | |
|
Fig. A.1 Control IR difference spectra of pure CO ice acquired during TPD. |
| In the text | |
|
Fig. A.2 Control IR difference spectra of pure CH3OH ice acquired during TPD. |
| In the text | |
|
Fig. A.3 Control IR difference spectra of the CO:CH3OH = 1:0.3 ice mixture acquired during TPD. |
| In the text | |
|
Fig. A.4 Control IR difference spectra of the CO:CH3OH =1:3 ice mixture acquired during TPD. |
| In the text | |
|
Fig. B.1 Difference spectra obtained before and after 10 min of IR-FEL irradiation on aCO ice at 20 K, corrected for ice stabilization. |
| In the text | |
|
Fig. C.1 Difference irradiation spectra of repeated measurements on the CO-rich ice mixture. Irradiations at the same frequency were performed at the same substrate position and the ice is already saturated on each second and third measurements. |
| In the text | |
|
Fig. C.2 Difference irradiation spectra of repeated measurements on the CH3OH-rich ice mixture. Irradiations at the same frequency were performed at the same substrate position. |
| In the text | |
Current usage metrics show cumulative count of Article Views (full-text article views including HTML views, PDF and ePub downloads, according to the available data) and Abstracts Views on Vision4Press platform.
Data correspond to usage on the plateform after 2015. The current usage metrics is available 48-96 hours after online publication and is updated daily on week days.
Initial download of the metrics may take a while.