Fig. 1
Download original image
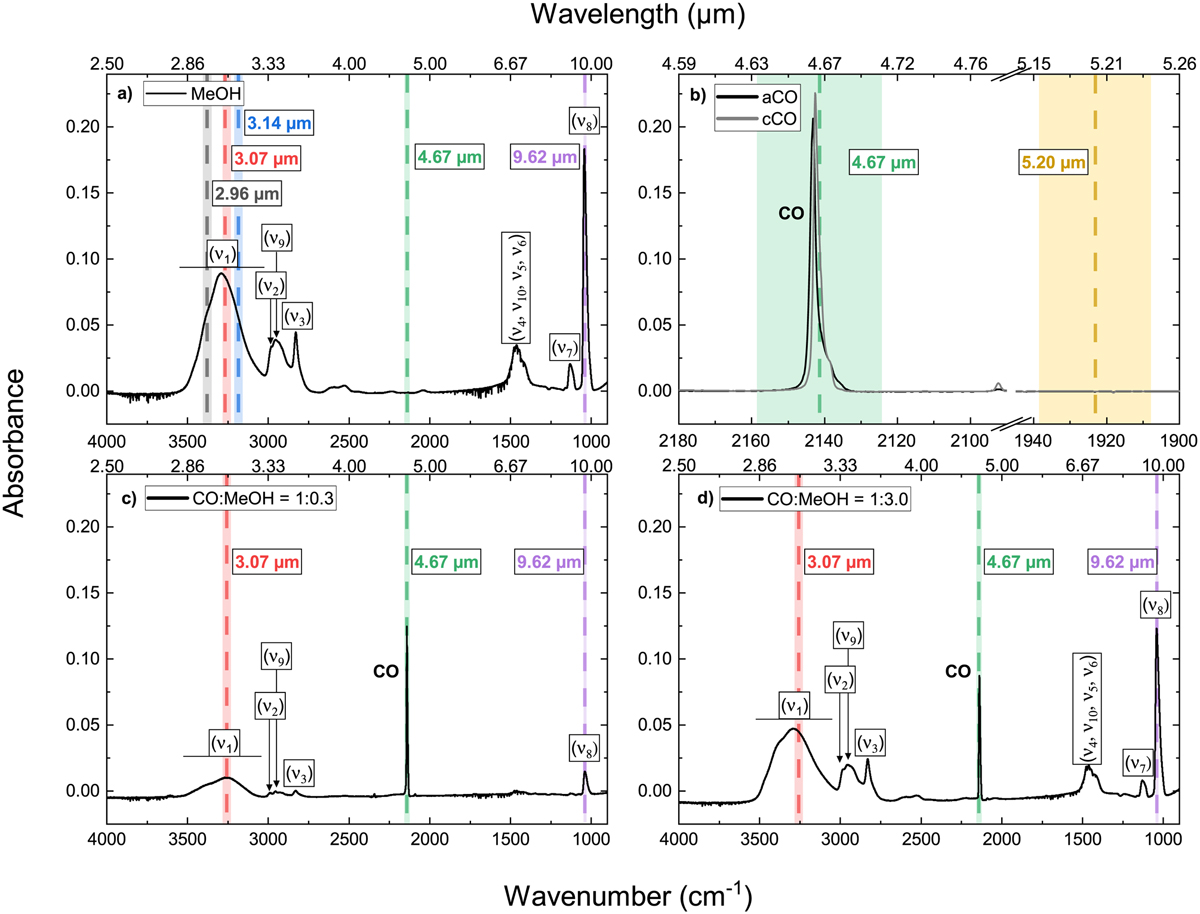
Spectra and irradiation maps of the ices explored in this work, all taken at 20 K. Panel a: pure amorphous CH3OH. Panel b: pure amorphous and crystalline CO. Panel c: mixture of CH3OH and CO with a CO:CH3OH ratio of 1:0.3. Panel d: same as panel c, but with a 1:3.0 ratio. All spectra are taken after deposition and before irradiation. The wavelengths of FELIX-2 used later for on and off-resonance irradiation are shown with dashed lines, and the FWHM is visible from the shadowed areas. The fundamental mode of CO is denoted in boldface, and the other labels correspond to the (vX) vibrational modes of CH3OH.
Current usage metrics show cumulative count of Article Views (full-text article views including HTML views, PDF and ePub downloads, according to the available data) and Abstracts Views on Vision4Press platform.
Data correspond to usage on the plateform after 2015. The current usage metrics is available 48-96 hours after online publication and is updated daily on week days.
Initial download of the metrics may take a while.