| Issue |
A&A
Volume 691, November 2024
|
|
|---|---|---|
| Article Number | A209 | |
| Number of page(s) | 9 | |
| Section | Interstellar and circumstellar matter | |
| DOI | https://doi.org/10.1051/0004-6361/202451474 | |
| Published online | 15 November 2024 | |
The effect of dilution on the energy dissipation in water interstellar ice analogues
Probed by infrared irradiation
1
HFML-FELIX laboratory, IMM, Radboud University,
Toernooiveld 7,
6525 ED
Nijmegen,
The Netherlands
2
Institute of Molecules and Materials (IMM), Radboud University,
Heyendaalseweg 135,
6525 AJ
Nijmegen,
The Netherlands
3
Centre for Interstellar Catalysis (InterCat), Department of Physics and Astronomy, University of Aarhus,
Aarhus
8000,
Denmark
★ Corresponding author; h.cuppen@science.ru.nl
Received:
12
July
2024
Accepted:
12
September
2024
Context. Interstellar ices and their energetic processing play an important role in advancing the chemical complexity in space. Interstellar ices covering dust grains are intrinsically mixed, and it is assumed that physicochemical changes induced by energetic processing – triggered by photons, electrons, and ions – strongly depend on the content of the ice. Yet, the modelling of these complex mixed systems in experiments and theory is complicated.
Aims. In this paper, we investigate the effect of infrared irradiation on a series of different molecules mixed with porous amorphous solid water (pASW) to study the release of vibrational energy in the hydrogen-bonding network of water as a function of mixing ratio and ice content. Particularly, we select mixtures of 20:1 H2O:X and 5:1 H2O:X with X=CO2, NH3, or CH4.
Methods. Infrared radiation was supplied by the intense and tunable free electron laser (FEL) 2 at the HFML-FELIX facility. We monitored the structural changes in the interstellar ice analogue after resonant infrared excitation using Fourier-transform reflection absorption infrared (FT-RAIR) spectroscopy.
Results. We observed that on-resonance irradiation at the OH-stretching vibration of pASW results in quantitatively identical changes compared to pure pASW for all investigated mixtures. The structural changes we observed closely resemble the previously reported local reordering. The 5:1 mixtures show weaker changes compared to pure pASW, with a decrease in strength from NH3 to CO2.
Conclusions. Since the hydrogen-bonding network of pASW restructures similarly upon FEL irradiation, regardless of the mixing component, treating ice layers in models that simulate energy dissipation in the hydrogen-bonding network as pure H2O ice layers can be a justified approximation. Hence, complex systems might not always be necessary to describe the infrared energetic processing of ices.
Key words: astrochemistry / molecular processes / methods: laboratory: solid state / ISM: molecules / infrared: ISM
© The Authors 2024
 Open Access article, published by EDP Sciences, under the terms of the Creative Commons Attribution License (https://creativecommons.org/licenses/by/4.0), which permits unrestricted use, distribution, and reproduction in any medium, provided the original work is properly cited.
This article is published in open access under the Subscribe to Open model. Subscribe to A&A to support open access publication.
1 Introduction
Water, H2O, is one of the most studied molecular species, and it plays a pivotal role in life as we know it on Earth. We often search for water as a tracer for life on other planets in our Solar System and beyond. Astronomical observations clearly find water in the gas phase, as well as frozen onto dust grains in many interstellar environments. In fact, water ice is the most abundant molecular solid in space (Boogert et al. 2015). There, H2O is not only an indicator of possible inhabitable planets, but solid water as well as other ices – the term ‘ice’ here indicates any solid in space that would be gas or liquid on Earth, such as CO, NH3 – play an important role in the physical and chemical processes associated with star and planet formation.
The processes that the ice facilitates greatly depend on its physical structure and its characteristic energy dynamics (Ghesquière et al. 2018). For example, laboratory studies have shown that the desorption of species mixed with H2O is controlled by the morphology and the desorption of H2O itself (Burke & Brown 2010, and references therein). Also, the morphology and energy dynamics of the ices are important for stabilising exothermic reactions in interstellar environments.
Interstellar ice will have to effectively absorb the excess energy of the reaction – generally vibrational energy – and sufficiently dissipate the energy through inter-molecular interactions. This enables the formation of more saturated molecules compared to gas-phase chemistry, such as glycine (Ioppolo et al. 2020). Depending on whether the energy distributes evenly or stay localised many different processes can be triggered. The distribution of energy leads to structural reorganisation, diffusion, and segregation. Yet, if the energy stays localised, desorption and possibly dissociation pathways will dominate. An example of such a process is chemical desorption: the desorption of a molecule after dissipation of a reaction’s excess energy. Simulations have shown that this process can be essential to explaining the abundances of complex organic molecules in cold and dark molecular clouds, where thermal desorption and photodesorption are negligible (Fredon et al. 2021).
Because H2O makes up the majority of interstellar ice, and because of its unique nature, water plays a vital role in all the previously discussed processes. Notably, H2O readily forms hydrogen bonds – intermolecular bonds that are many times stronger than non-covalent dispersion interactions – that play an essential role in the energy dynamics of water. The hydrogen bonds give water anomalous properties, such as its high boiling point compared to other molecules of similar mass and the low density of its solid state compared to its liquid state. Water has twelve known crystal structures depending on the temperature and pressure during its formation (Bartels-Rausch et al. 2012). All of these ice structures potentially have different energy dissipation properties.
Measurements of energy dissipation in liquid water have indicated ultrafast vibrational relaxation times of less than 0.5 ps in bulk water, depending on the OH-stretching vibration (van der Post et al. 2015). For crystalline H2O, relaxation dynamics can be equally fast – about a hundred femtoseconds – due to the strong inter- and intra-molecular coupling in the ordered crystalline arrangement (Sudera et al. 2020). These fast dynamics in H2O potentially reduce the efficiency of reactive desorption compared to silicate dust grain analogues, strongly influencing the solid-state–gas-phase interactions during and after the freeze-out of H2O (Minissale et al. 2016; Cazaux et al. 2016). As such, it is important to understand the energy dynamics in ice to derive accurate models of the solid-state and gas-phase chemistry in space in order to explain observed interstellar abundances.
The dissipation of vibrational energy in porous amorphous solid water was studied in detail at the molecular level by Cuppen et al. (2022). Using classical molecular dynamics, they simulated an ensemble of H2O molecules resembling a pure amorphous solid water (pASW) ice and traced the effect of a vibrational excitation induced by a simulated electric field in one of the molecules. In this classical description, the energy is transferred on a 0.3 ps timescale to molecules with similar vibrational frequencies hydrogen bonded to the excited molecule. The hydrogen bonds themselves do not get excited but are instrumental in transferring the excitation energy, and due to the resulting local heating, individual molecules subsequently reorient to form a more ordered structure. Macroscopically, this process results in restructuring with a characteristic down-up shape in the infrared difference spectra, as reported by Noble et al. (2020).
Here, we report on experiments extending the investigation of the H2O energy dissipation dynamics and the impact on astronomically relevant processes, such as photodesorption, by studying mixed ices with CO2, NH3, and CH4 resembling mixed water ices abundant in space (Öberg et al. 2008; Bottinelli et al. 2010; Pontoppidan et al. 2008; McClure et al. 2023). Intuitively, the presence of these species will disturb the hydrogen-bonding network of water, and as shown by Cuppen et al. (2022), defects block the on-resonance energy dissipation. We systematically investigated how the hydrogen-bonding network and the observed restructuring are influenced by mixing components in pASW and how this relates to the modelling of the ice surface as bare, pure H2O, or mixed systems. To simulate the vibrational excitation, we applied on-resonance irradiation using the monochromatic and tunable infrared light from the free electron lasers (FELs) of the HFML-FELIX facility in Nijmegen, the Netherlands. We studied a number of two-component interstellar ice analogues that consist of H2O-rich mixtures with CO2, NH3, and CH4 that have individual abundances in quiescent regions in the interstellar medium of 9–67 %, <7% and <3%, respectively (Boogert et al. 2015). Then, for systematic investigations and to match the interstellar abundances, we irradiated both 20:1 H2O:X and 5:1 H2O:X mixtures with X = CO2, NH3 or CH4.
We are experimentally limited to studying porous ices instead of the more commonly expected compact ices in interstellar clouds due to the volatile nature of CH4 and CO2. In general, we aim to study the effect of dilution on the dissipation of energy through the hydrogen-bonding network, and we do not expect the dilution effect to vary significantly between porous and compact ices. Moreover, since restructuring is used as a measure for this dissipation and the restructuring effect in compact ices upon infrared irradiation is found to be significantly smaller compared to those in porous ices, compact ices would be a less sensitive probe for dissipation (Cuppen et al. 2022). Besides, a recent analysis of James Webb data of the Chamaeleon I cloud revealed signatures of dangling-OH mode, possibly indicating the presence of pASW in these environments (Noble et al. 2024).
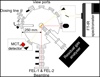 |
Fig. 1 Sketch of the top view of the LISA end station at the HFML-FELIX facility in the Netherlands. |
2 Experimental methods
Experiments were performed using the Laboratory Ice Surface Astrophysics (LISA) ultra-high vacuum chamber stationed at the HFML-FELIX facility, which has been described in detail previously (Ioppolo et al. 2022). Since this last report on the LISA chamber, the setup has been improved, and the chamber is now equipped with a new cryostat (SRDK-101 from SHI Cryogenics Group), operating between 9 and 450 K, and a residual gas analyser (RGA; HAL/3F RC PIC from Hiden Analytical) with a higher sensitivity and faster detection. Further details on these improvements will be reported elsewhere, and we restrict this section to reporting the experiments we performed. A schematic top view of the upgraded LISA setup is shown in Figure 1.
Gas-mixtures of H2O (deionised and purified via multiple freeze-pump-thaw cycles) and CO2 (≥ 99.995%, CANgas, Sigma-Aldrich), NH3 (99.99995%, F-Select GmbH) or CH4 (≥99.9995%, CANgas, Sigma-Aldrich) were prepared in the gas phase using two mass-independent gauges with overlapping ranges 0.001–10 and 0.1–1000 mbar, respectively, to ensure consistent H2O:X ratios. To obtain amorphous ice, gases were background deposited on a gold-coated substrate at the lowest achievable temperature of the cryostat, between 8.9-9.4 K for the current configuration.
During deposition, the gas pressure in the main chamber was kept constant at 1 ⋅ 10−6 mbar in the main chamber, and the growth of the ice was monitored by Fourier-transform reflection absorption infrared (FT-RAIR) spectroscopy. For all mixtures, the deposition time was chosen such that the H2O-libration band (1000–500 cm−1) in the infrared spectra is of comparable shape and close to equal intensity compared to the pure pASW. After deposition, the ice was characterised by measuring FT-RAIR spectra of 256 co-added scans with a resolution of 0.5 cm−1 in the 5000−500 cm−1 range. All mixtures were allowed to stabilize structurally for at least 1 hour after deposition.
Ices were irradiated using FEL-2 of the FELIX facility that operated for this project in the mid-infrared range (2.7–9.3 µm) with macropulses of 5 Hz or 10 Hz. Irradiations were performed at a fixed wavelength of 3.0 µm, resonant with the H2O stretch, for a total of 5 minutes when at 5 Hz and 2.5 minutes when at 10 Hz. The spectral full width at half maximum (FWHM) of the FEL beam was less than 0.03 µm at this wavelength, and the physical size of the beam was elliptical on the substrate, with an area of about 1.6 mm2. The details of the experiments and irradiations performed are shown in Table 1.
To study the effect of the irradiation on the ices, FT-RAIR spectra in the 5000−500 cm−1 range with 0.5 cm−1 resolution were obtained before and after the irradiation and were subtracted to obtain the difference spectra that can reveal structural changes. All data analyses and spectral manipulations, such as baseline corrections, were performed using in-house Python scripts.
Overview of the experiments performed.
3 Results and discussion
3.1 Spectra and irradiation of pure H2O
Before reporting on the mixtures, we first show the results for three pure pASW samples with comparable thickness but different irradiation conditions. These are listed in Table 1. Figure 2a shows the infrared spectra taken shortly after deposition for all three ices. Both the intensity and the peak shape of all vibrational bands are almost identical for these samples. All three ices were irradiated on resonance with the OH-stretching vibration, and the effect thereof was determined by subtracting a pre-irradiation spectrum from a post-irradiation one. The resulting difference spectrum reveals a loss in the population of certain oscillators as a negative signal and a gain in the population as a positive signal. The difference spectra shown in Figure 2b, are similar to the difference spectra reported by Noble et al. (2020) and Cuppen et al. (2022) for pASW in a comparable experimental setup. For all three samples, we observed the characteristic decrease in the red wing and increase in the blue wing of the OH-stretch that can be linked to a local reordering of the water molecules to a configuration with, on average, more hydrogen bonds per molecule.
The irradiations were performed with different macropulse energies as a result of the tuning conditions of the FEL that differed across the duration of the ten months in which these data were recorded. Here, we briefly study the effect of the varying macropulse energy on the subsequent restructuring. Figure 2b shows that an increase in macropulse energy of the FEL results in an increase in the strength of the restructuring. Therefore, we investigated how to best compare the mixtures with H2O to a pure H2O sample while eliminating the effects of varying macropulse energy. A simple way would be to scale with the fluence of the irradiation.
Since the irradiation wavelength and the irradiation time are almost identical for all three cases, the difference in fluence is dictated by the macropulse energy, and in fact, scaling with the fluence is almost identical to scaling with the macropulse energy. However, this scaling assumes that the strength of the restructuring relates linearly to the macropulse energy. As shown in Figure 2c this is not the case, and the scaling even over-compensates such that the 25 mJ irradiation shows a stronger restructuring change after scaling compared to the 88 mJ (Appendix A.1).
Non-linear dependencies on the macropulse energy of the irradiation process generally relate to multiphoton processes. However, for our experiments, multiphoton processes are very unlikely due to the characteristics of the FEL-2 that supplies molecules in our sample with a maximum of 0.005 photons during the micropulse. A rough calculation thereof can be found in Appendix B. We observed a levelling off of the absolute area of the restructuring, indicating some type of saturation. It could well be that at some point during the irradiation, there will be no molecules left that can still reorient to a more favourable hydrogen bond configuration if more photons hit the ice. Saturation of the restructuring of water was observed to some extent in previous studies that showed that, depending on the irradiation history of the ice, certain restructuring channels would be depleted (Cuppen et al. 2022). Other experimental factors could also have influenced the strength of the restructuring, considering that the experiments have been performed during an extended period in which the setup was regularly changed and improved. The exact nature of the dependence of the restructuring on the macropulse energy is, however, outside of the scope of this publication.
What we observed, however, is that the effect of infrared light on water in space cannot be linearly scaled or extrapolated with the strength of the infrared radiation field. Since we cannot quantitatively compare all our mixtures with only one pure pASW sample by scaling with the fluence, we used the pure pASW sample from Figure 2 with decent matching macropulse energy. For the 20:1 H2O:X mixtures, this is the pASW irradiation with 25 mJ (hereafter H2O-loE), and for the 5:1 H2O:X mixtures, it is the pASW irradiation with 60 mJ (hereafter H2O-hiE).
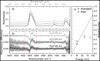 |
Fig. 2 Results of irradiation of the OH-stretch of pure pASW with different macropulse energies. (a) Infrared spectra of three almost identical pASW depositions prior to on-resonance irradiation. To image the result of the on-resonance irradiation with the OH-stretch pre-irradiation spectra like in (a) were subtracted from post-irradiation spectra, resulting in the difference spectra in (b). The irradiations are performed with increasing macropulse energy (lighter colours). In (c), the absolute area of the changes in the region between the two dashed red lines in (b) as a function of the macropulse energy is shown. Circles denote the area of the original difference spectra in lighter colours in the background in (b) and squares indicate the area of the averaged spectra in (b). The dash-dotted line in (c) illustrates a linear extrapolation based on the macropulse-energy-absolute-area relation of the first point at 25 mJ. |
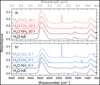 |
Fig. 3 FT-RAIR spectra of (a) the three 20:1 H2O:X mixtures in shades of red and (b) the 5:1 H2O:X mixtures in shades of blue, with the mixing components NH3, CH4 and CO2 from dark to light. The pre-irradiation spectra of pure pASW are shown in black for (a) a lower energy irradiation (H2O-loE) and (b) a higher energy irradiation (H2O-hiE). |
3.2 Spectra and mixing ratios of the H2O:X ices
Figure 3 shows the FT-RAIR spectra of the six mixtures and the pure pASW ice samples, H2O-loE and H2O-hiE. For the 20:1 mixtures, the OH-stretching bands are almost identical, both in position and shape, compared to H2O-loE. For the 5:1 mixtures, there are deviations from the H2O-hiE spectrum, and the vibrational modes from H2O are less strong because of the lower H2O content in these mixtures. For the H2O:NH3 5:1, clear signatures of the NH-stretch of NH3 are visible, overlapping with the OH-stretch. The interaction of the mixing components with H2O does slightly distort the shape of the OH-stretching vibration with respect to pure pASW, especially for the 1:5 mixtures. Still, this distortion is largely similar for the three different molecules.
All the mixing ratios reported are based on the gas-phase ratio in the dosing line prior to deposition (gas-phase, gauge). Due to differences in sticking to the substrate and mobility in the gas phase, these gas-phase ratios do not necessarily reflect the solid-state ratios of the interstellar ice analogue after deposition. In Appendix C, we calculate the mixing ratios of the deposited ices in two additional ways to get an estimate of the water content in these mixtures: from the counts recorded by the RGA of the relevant gas-phase species during deposition (gas-phase, mass spectrum) and from the bandstrength-corrected band areas in the IR spectra using the procedure described in Ioppolo et al. (2022) (solid state, absorbance spectrum). These calculations show that the 5:1 mixtures have a systematic offset towards higher H2O content in the solid state, but their H2O content is sufficiently different from the 20:1 mixtures to consider the dilution effects on the H2O hydrogen-bonding network, as we do in the following section.
3.3 IR irradiation comparison
On-resonance irradiations with the FELIX free electron laser FEL-2 were performed on all six mixtures at 3.0 µm with macropulse energies ranging between 25 mJ and 45 mJ. The structural changes induced by the irradiation were visualised by subtracting a pre-irradiation infrared spectrum from a post-irradiation one. For the purpose of this publication, we focus on the structural changes in the OH-stretch region. At the OH-stretch, we expect to observe the characteristic changes upon irradiation of pASW that we know are connected to the hydrogen-bonding network (Noble et al. 2020; Cuppen et al. 2022). Also, as shown in Figure 2b, the changes in the OH-stretch are the strongest and closest to the optimal signal-to-noise of this spectrometer configuration.
The difference spectra for irradiation of the OH-stretch at 3.0 µm in the high H2O-content mixtures (H2O:X 20:1) are shown in Figure 4. A difference spectrum for a comparable irradiation of pure pASW (H2O-loE) is shown in black in the same graph. For all 20:1 mixtures, the observed changes are identical in strength and shape. This is also clear from the absolute area of the changes shown in Figure 4b, which hardly changes between the mixing components. For these ratios, the hydrogen-bonding network of H2O, which is strongly responsible for the observed changes, is apparently not perturbed by the presence of apolar, volatile species (CO2 and CH4) nor by polar molecules with similar vibrational frequencies (NH3).
Of course, 20:1 mixtures are very dilute and mainly consist of H2O, and it is not unexpected that the structural changes are identical to pure H2O. To investigate the prevalence of the hydrogen-bonding network dynamics in H2O:X mixtures, we repeated the experiments on the three 5:1 mixtures. The results of irradiation at 3.0 µm for these lower H2O-content mixtures are shown in Figure 5.
For this more strongly diluted version of the hydrogen-bonding network we also observed the characteristic pASW restructuring shape, showcasing the prevalence of the hydrogen-bonding network. However, the difference spectra show a variety in the intensity of the changes. Figure 5b clearly shows a linear decrease in the absolute area of the change for mixing with NH3, CH4 and CO2, respectively. This lower intensity is not related to the lower H2O content in these mixtures, which we checked by scaling all spectra with the bandstrength of the libration mode (Appendix A, Figures A.2 and A.3). We saw no influence on the respective intensities of the changes in the difference spectra for the different bandstrengths and fluence scalings. The negligible effect of the bandstrength scaling confirms the similarity of the deposition of the ices.
The observed weaker intensity for the 5:1 mixtures has to be related to their interaction with the hydrogen-bonding network that dominates the energy dissipation. NH3 can form hydrogen bonds and can be expected to some extent to support the network, possibly explaining the smaller loss in the strength of the restructuring compared to CO2 and CH4. Neither CO2 nor CH4 can form hydrogen bonds, and the difference in the total area of the restructuring between the two could be explained by their binding energy to H2O. Temperature-programmed desorption curves of monolayer desorption from a solid water substrate are a direct measurement of the binding energy and this type of experiments clearly shows a weaker binding of CH4 compared to CO2 (i.e. a desorption at a lower temperature; Collings et al. 2004). Also, molecular modelling simulations of a single admolecule on a water ice surface show a weaker binding for CH4 compared to CO2 (Fredon et al. 2017). As a result, we can also assume that the general interactions between CH4 and H2O are weaker compared to those with CO2 and for that reason, CH4 will disturb the hydrogen-bonding network less.
In general, we observed that the hydrogen-bonding network retains the process of energy dissipation as observed for pure pASW (Cuppen et al. 2022) in all mixtures. Because this energy-dissipation mechanism via the hydrogen-bonding network remains unaltered, the assumption often used in modelling and experiments to describe the icy grain as merely consisting of H2O is justified. Especially when the mixture contains NH3, the hydrogen-bonding network is not weakened as significantly as for the apolar mixing components, as we observed for our 5:1 H2O:NH3-mixture, suggesting that H2O:NH3 mixtures could be modelled with pure H2O energy dynamics. Still, the energy dissipation does seem to decrease in efficiency when the H2O content decreases below ~80%. Yet, since ~75% of the interstellar ices seems to be made up of H2O, one can still assume that the hydrogen bonding dynamics dominate, especially considering that interstellar ices are supposed to consist of an H2O-rich and a separate CO-rich layer (Boogert et al. 2015; Öberg & Bergin 2021).
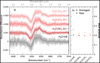 |
Fig. 4 Restructuring resulting from on-resonance irradiation at 3.0 µm for the three 20:1 H2O:X mixtures. (a) Difference of spectra taken before and after irradiation for the 20:1 H2O:X mixtures with X = NH3 (dark red), CH4 (red) or CO2 (light red). The effect on pure pASW after a comparable irradiation is shown in black. (b) Absolute area of the changes in panel a) for the raw data (lighter traces in panel a) and the smoothed traces (darker solid lines in panel a). |
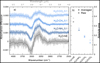 |
Fig. 5 Restructuring resulting from on-resonance irradiation at 3.0 µm for the three 5:1 H2O:X mixtures. (a) Difference of spectra taken before and after irradiation at 3.0 µm for three 5:1 H2O:X mixtures with X=NH3 (dark blue), CH4 (blue) or CO2 (light blue). The effect on pure pASW after a comparable irradiation is shown in black. (b) Absolute area of the changes in panel a for the raw data (lighter traces in panel a) and the smoothed traces (darker solid lines in panel a). |
4 Conclusions
Infrared irradiation of the OH-stretching vibration in the 20:1 mixtures of H2O:X mixtures with X = CO2, NH3, or CH4 results in qualitatively and quantitatively identical restructuring compared to pure pASW. The hydrogen-bonding network is unperturbed by the presence of the mixing constituent, even when this molecule can form hydrogen bonds itself (e.g. in the case of NH3). The observed restructuring is directly related to the local reorganisation of pASW to a more ordered and tetragonal structure, as reported before (Noble et al. 2020; Cuppen et al. 2022). For NH3 and CH4, the 20:1 ratio is close to that observed in the interstellar medium, and as such, the influence of NH3 and CH4 on the restructuring of H2O-rich layers or on the energy dissipation, desorption, and related mechanisms in space is negligible.
For mixtures with a 5:1 ratio, the observed restructuring is qualitatively the same as in pure pASW, but the effect is weakened. The weakening effect is the largest for mixing with CO2 and the smallest for NH3, suggesting that the ability of NH3 to form hydrogen bonds could reinforce the hydrogen-bonding network. The difference between the interaction of both apolar molecules CH4 and CO2 is most likely related to the weaker interactions of CH4 with H2O compared with CO2 with H2O. Still, restructuring is qualitatively the same as for pure pASW.
These results support the assumption in astrochemical modelling that interactions with the icy grain can be described solely by the interactions with H2O since no matter the composition of the interstellar ice, the energy dissipation mechanism via the hydrogen-bonding network persists. The only change we observed was in the efficiency of the energy dissipation for mixtures with less than 80% water, yet the mechanism remained identical. Also, for experimental ice studies, it appears that simple mixtures, or even pure systems, are sufficient to describe energy dissipation in the hydrogen-bonding network. Open questions that remain concern the minimum percentage of H2O that would be required in the amorphous ice to still allow for vibrational energy dissipation and the prevalence of the hydrogen-bonding network. These questions, together with the influence of multiple molecules mixed into the hydrogen-bonding network of H2O at once, will be the subject of our future studies.
Acknowledgements
J.G.M.S. acknowledges this publication as part of the project “HFML-FELIX: a Dutch Centre of Excellence for Science under Extreme Conditions” (with project number 184.035.011) of the research programme “Nationale Roadmap Grootschalige Wetenschappelijke Infastructuur” which is (partly) financed by the Dutch Research Council (NWO). The main components of the LISA experimental apparatus were purchased using funding obtained from the Royal Society through grants UF130409, RGF/EA/180306, and URF/R/191018. S.I. thanks the Danish National Research Foundation through the Center of Excellence “InterCat” (Grant agreement no.: DNRF150) and the Royal Society for financial support. The authors thank the referee, Masashi Tsuge, for his constructive feedback that helped improve this paper.
Appendix A Scaling
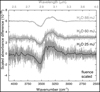 |
Fig. A.1 Difference of spectra taken before and after irradiation at 3.0 μm for three pASW mixtures with increasing macropulse energy (lighter colours). The spectra are scaled with the fluence of the respective irradiation. The darker solid lines are smoothed versions of the lighter traces in the background and are merely to guide the eye. |
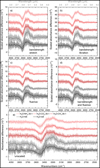 |
Fig. A.2 Difference spectra resulting after irradiation of the OH-stretch of H2O for the three 20:1 mixtures and two pure pASW samples with different scaling factors. (a) Bandstrength of the OH-stretch of H2O. (b) Bandstrength of the libration mode of H2O. (c) Fluence of the FEL irradiation. (d) Combination of the libration mode bandstrength and the fluence. (e) Unscaled difference spectra. The darker solid lines in all the graphs are smoothed versions of the lighter traces in the background. |
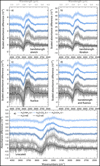 |
Fig. A.3 Difference spectra resulting after irradiation of the OH-stretch of H2O for the three 5:1 mixtures and two pure pASW samples with different scaling factors. (a) Bandstrength of the OH-stretch of H2O. (b) Bandstrength of the libration mode of H2O. (c) Fluence of the FEL irradiation. (d) Combination of the libration mode bandstrength and the fluence. (e) Unscaled difference spectra. The darker solid lines in all the graphs are smoothed versions of the lighter traces in the background. |
Appendix B Calculation of photons per molecule in a FEL micropulse
During our experiments, we operated FEL-2 at 1 GHz, such that every macropulse consisted of roughly 6000 micropulses that are spaced 1 ns apart. Considering the rapid energy dissipation in pASW, this gave the H2O molecules enough time to relax in-between micropulses (Cuppen et al. 2022), and as a result, we needed only to consider the micropulse as responsible for multiphoton processes. For a macropulse energy of 25 mJ at 3.0 µm the macropulse will be carried by a total of  photons, resulting in 6.3 ⋅ 1013 photons in a micropulse. These photons are impinging on the substrate area of 1.6 mm2 and with the general molecular surface density of 1015 cm−2, we would have
  photons per molecule in the surface layer in a micropulse. Not all photons are absorbed; the ice captures only a fraction of 1 − exp (−αl). Here, we estimate this fraction for our pASW sample by using the Lambert absorption coefficient of 1.2 ⋅ 104 cm−1 for liquid water (Robertson & Williams 1971). For the top layer of the ice of roughly 3 Å, the absorbed fraction will be 1 − exp (−1.2 ⋅ 104 ⋅ 3 ⋅ 10−8) = 3.6 ⋅ 10−4 resulting in 0.001 absorbed photons per molecule per micropulse in the top layer, ruling out multiphoton processes both by excitation of the same molecule, as per excitation via a neighbouring molecule. The fraction of photons that is not absorbed will impinge on the lower layers of molecules in the ice, but these will consistently receive fewer photons compared to the top layer. Even for irradiations with a higher macropulse power, we do not get more than 0.005 photons per molecule. Of course, this crude calculation assumes that the total macropulse energy is evenly spread over the entire irradiation area. In reality, the FEL-2 beam is Gaussian, and the edges of the irradiated area receive significantly fewer photons, and the centre of the beam receives more. Still, since, on average, the photon input is significantly less than one photon per molecule, this proves that multiphoton processes cannot be possible for the current experiments.
Appendix C Alternative determination of mixing ratios
In addition to the mixing ratios reported from the gas-phase ratios in the dosing line prior to depositions (gas-phase, gauge), we calculated the ratios in two additional ways during different stages of the deposition. For the first method (gas-phase, mass spectrum), all counts of a specific mass recorded during the deposition duration are added to obtain the total counts of that mass. Assuming that H2O and the mixing partner are the main components of the mixture, the H2O content is then obtained by dividing the total counts of the mixing partner (m/z = 17 for NH3, m/z = 16 for CH4 and m/z = 44 for CO2) by the total counts of H2O (m/z = 18). For m/z = 17 and m/z = 16, the recorded counts are corrected for the natural decomposing of H2O to OH (m/z = 17) and O (m/z = 16) after electron ionisation in the residual gas analyser (RGA) (Cole et al. 2004; NIST Mass Spectrometry Data Center 2024).
For the second method (solid state, absorbance spectrum), the integrated area of the bands with the least overlap in the mixture of H2O, NH3, CH4 and CO2 are calculated and converted to column density as described in Ioppolo et al. (2022) using the RAIRS angle of the LISA chamber of 13°. For mixtures with CO2 we determined the column densities from the OH-stretch of H2O with  cm/molecules (Gerakines et al. 1995) and the CO-stretch of CO2 with
  cm/molecules (Gerakines & Hudson 2015). Due to the overlap of NH3 and CH4 with OH-stretch we integrated the libration mode of H2O with
  cm/molecules (Gerakines et al. 1995), despite the systematic underestimation of water that arises from the incomplete coverage of the libration band due to the limit of the range of the spectrometer at 500 cm−1. The band intensities used to calculate the column densities for NH3 and CH4 are
  cm/molecules (Hudson et al. 2022) and
  cm/molecules (Bossa et al. 2015), respectively. The H2O content is then determined by dividing the column density of H2O by the sum of the column densities of the mixing partner and H2O.
Figure C.1 shows the estimated water content of the six binary mixtures calculated using the three different methods. For the three 20:1 mixtures, all three methods are in good agreement and close to the desired ratios. For the 5:1 mixtures, there seems to be a systematic offset towards higher H2O content in the solid state. This can be related to the more efficient pumping of the volatile species during the deposition, leading to a higher water content in the 5:1 mixture with CH4 and NH3. Also, the band-strengths of pure ices used for the calculation are less accurate due to the stronger influence of the mixing partner and might therefore result in a seemingly higher H2O content in the solid state. Still, the 5:1 mixtures are sufficiently different from the 20:1 ones for our analysis of the influence of mixing partners on the energy dissipation mechanism.
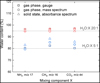 |
Fig. C.1 Percentage of H2O in the mixtures with the different mixing components NH3 (m/z 17), CH4 (m/z 16), and CO2 (m/z 44) for mixtures of ratio 20:1 (shades of red) and of ratio 5:1 (shades of blue). The ratios are determined from the ratio of the mixtures in the gas phase (squares), from the counts per second recorded by the RGA during deposition (circles) and from the band strengths in the FT-RAIR spectra (triangles). The dashed horizontal lines correspond to the desired 20:1 and 5:1 ratios. |
References
- Bartels-Rausch, T., Bergeron, V., Cartwright, J. H. E., et al. 2012, Rev. Mod. Phys., 84, 885 [NASA ADS] [CrossRef] [Google Scholar]
- Boogert, A. C. A., Gerakines, P. A., & Whittet, D. C. B. 2015, ARA&A, 53, 541 [Google Scholar]
- Bossa, J.-B., Maté, B., Fransen, C., et al. 2015, ApJ, 814 [Google Scholar]
- Bottinelli, S., Boogert, A. C. A., Bouwman, J., et al. 2010, ApJ, 718, 1100 [NASA ADS] [CrossRef] [Google Scholar]
- Burke, D. J., & Brown, W. A. 2010, Phys. Chem. Chem. Phys., 12, 5947 [NASA ADS] [CrossRef] [Google Scholar]
- Cazaux, S., Minissale, M., Dulieu, F., & Hocuk, S. 2016, A&A, 585, A55 [NASA ADS] [CrossRef] [EDP Sciences] [Google Scholar]
- Cole, C. R., Outlaw, R. A., Champion, R. L., Baker, D. H., & Holloway, B. C. 2004, J. Vac. Sci. Technol. A: Vac. Surf. Films, 22, 2056 [NASA ADS] [CrossRef] [Google Scholar]
- Collings, M. P., Anderson, M. A., Chen, R., et al. 2004, MNRAS, 354, 1133 [NASA ADS] [CrossRef] [Google Scholar]
- Cuppen, H. M., Noble, J. A., Coussan, S., Redlich, B., & Ioppolo, S. 2022, J. Phys. Chem. A, 126, 8859 [NASA ADS] [CrossRef] [Google Scholar]
- Fredon, A., Lamberts, T., & Cuppen, H. M. 2017, ApJ, 849 [Google Scholar]
- Fredon, A., Radchenko, A. K., & Cuppen, H. M. 2021, Acc. Chem. Res., 54, 745 [CrossRef] [Google Scholar]
- Gerakines, P. A., & Hudson, R. L. 2015, ApJ, 808 [Google Scholar]
- Gerakines, P. A., Schutte, W. A., Greenberg, J. M., & van Dishoeck, E. F. 1995, A&A, 296, 810 [NASA ADS] [Google Scholar]
- Ghesquière, P., Ivlev, A., Noble, J. A., & Theulé, P. 2018, A&A, 614, A107 [NASA ADS] [CrossRef] [EDP Sciences] [Google Scholar]
- Hudson, R. L., Gerakines, P. A., & Yarnall, Y. Y. 2022, ApJ, 925 [Google Scholar]
- Ioppolo, S., Fedoseev, G., Chuang, K. J., et al. 2020, Nat. Astron., 5, 197 [NASA ADS] [CrossRef] [Google Scholar]
- Ioppolo, S., Noble, J. A., Traspas Muiña, A., et al. 2022, J. Mol. Spectrosc., 385 [Google Scholar]
- McClure, M. K., Rocha, W. R. M., Pontoppidan, K. M., et al. 2023, Nat. Astron., 7, 431 [NASA ADS] [CrossRef] [Google Scholar]
- Minissale, M., Dulieu, F., Cazaux, S., & Hocuk, S. 2016, A&A, 585, A24 [NASA ADS] [CrossRef] [EDP Sciences] [Google Scholar]
- NIST Mass Spectrometry Data Center. 2024, Mass Spectra, ed. W. E. Wallace (Gaithersburg, MD: National Institute of Standards and Technology) [Google Scholar]
- Noble, J. A., Cuppen, H. M., Coussan, S., Redlich, B., & Ioppolo, S. 2020, J. Phys. Chem. C, 124, 20864 [Google Scholar]
- Noble, J. A., Fraser, H. J., Smith, Z. L., et al. 2024, Nat. Astron. 8, 1169 [NASA ADS] [CrossRef] [Google Scholar]
- Öberg, K. I., & Bergin, E. A. 2021, Phys. Rep., 893, 1 [Google Scholar]
- Öberg, K. I., Boogert, A. C. A., Pontoppidan, K. M., et al. 2008, ApJ, 678, 1032 [Google Scholar]
- Pontoppidan, K. M., Boogert, A. C. A., Fraser, H. J., et al. 2008, ApJ, 678, 1005 [NASA ADS] [CrossRef] [Google Scholar]
- Robertson, C. W., & Williams, D. 1971, J. Opt. Soc. Am., 61, 1316 [NASA ADS] [CrossRef] [Google Scholar]
- Sudera, P., Cyran, J. D., Deiseroth, M., Backus, E. H. G., & Bonn, M. 2020, J. Am. Chem. Soc., 142, 12005 [CrossRef] [Google Scholar]
- van der Post, S. T., Hsieh, C. S., Okuno, M., et al. 2015, Nat. Commun., 6, 8384 [NASA ADS] [CrossRef] [Google Scholar]
All Tables
All Figures
|
Fig. 1 Sketch of the top view of the LISA end station at the HFML-FELIX facility in the Netherlands. |
| In the text | |
|
Fig. 2 Results of irradiation of the OH-stretch of pure pASW with different macropulse energies. (a) Infrared spectra of three almost identical pASW depositions prior to on-resonance irradiation. To image the result of the on-resonance irradiation with the OH-stretch pre-irradiation spectra like in (a) were subtracted from post-irradiation spectra, resulting in the difference spectra in (b). The irradiations are performed with increasing macropulse energy (lighter colours). In (c), the absolute area of the changes in the region between the two dashed red lines in (b) as a function of the macropulse energy is shown. Circles denote the area of the original difference spectra in lighter colours in the background in (b) and squares indicate the area of the averaged spectra in (b). The dash-dotted line in (c) illustrates a linear extrapolation based on the macropulse-energy-absolute-area relation of the first point at 25 mJ. |
| In the text | |
|
Fig. 3 FT-RAIR spectra of (a) the three 20:1 H2O:X mixtures in shades of red and (b) the 5:1 H2O:X mixtures in shades of blue, with the mixing components NH3, CH4 and CO2 from dark to light. The pre-irradiation spectra of pure pASW are shown in black for (a) a lower energy irradiation (H2O-loE) and (b) a higher energy irradiation (H2O-hiE). |
| In the text | |
|
Fig. 4 Restructuring resulting from on-resonance irradiation at 3.0 µm for the three 20:1 H2O:X mixtures. (a) Difference of spectra taken before and after irradiation for the 20:1 H2O:X mixtures with X = NH3 (dark red), CH4 (red) or CO2 (light red). The effect on pure pASW after a comparable irradiation is shown in black. (b) Absolute area of the changes in panel a) for the raw data (lighter traces in panel a) and the smoothed traces (darker solid lines in panel a). |
| In the text | |
|
Fig. 5 Restructuring resulting from on-resonance irradiation at 3.0 µm for the three 5:1 H2O:X mixtures. (a) Difference of spectra taken before and after irradiation at 3.0 µm for three 5:1 H2O:X mixtures with X=NH3 (dark blue), CH4 (blue) or CO2 (light blue). The effect on pure pASW after a comparable irradiation is shown in black. (b) Absolute area of the changes in panel a for the raw data (lighter traces in panel a) and the smoothed traces (darker solid lines in panel a). |
| In the text | |
|
Fig. A.1 Difference of spectra taken before and after irradiation at 3.0 μm for three pASW mixtures with increasing macropulse energy (lighter colours). The spectra are scaled with the fluence of the respective irradiation. The darker solid lines are smoothed versions of the lighter traces in the background and are merely to guide the eye. |
| In the text | |
|
Fig. A.2 Difference spectra resulting after irradiation of the OH-stretch of H2O for the three 20:1 mixtures and two pure pASW samples with different scaling factors. (a) Bandstrength of the OH-stretch of H2O. (b) Bandstrength of the libration mode of H2O. (c) Fluence of the FEL irradiation. (d) Combination of the libration mode bandstrength and the fluence. (e) Unscaled difference spectra. The darker solid lines in all the graphs are smoothed versions of the lighter traces in the background. |
| In the text | |
|
Fig. A.3 Difference spectra resulting after irradiation of the OH-stretch of H2O for the three 5:1 mixtures and two pure pASW samples with different scaling factors. (a) Bandstrength of the OH-stretch of H2O. (b) Bandstrength of the libration mode of H2O. (c) Fluence of the FEL irradiation. (d) Combination of the libration mode bandstrength and the fluence. (e) Unscaled difference spectra. The darker solid lines in all the graphs are smoothed versions of the lighter traces in the background. |
| In the text | |
|
Fig. C.1 Percentage of H2O in the mixtures with the different mixing components NH3 (m/z 17), CH4 (m/z 16), and CO2 (m/z 44) for mixtures of ratio 20:1 (shades of red) and of ratio 5:1 (shades of blue). The ratios are determined from the ratio of the mixtures in the gas phase (squares), from the counts per second recorded by the RGA during deposition (circles) and from the band strengths in the FT-RAIR spectra (triangles). The dashed horizontal lines correspond to the desired 20:1 and 5:1 ratios. |
| In the text | |
Current usage metrics show cumulative count of Article Views (full-text article views including HTML views, PDF and ePub downloads, according to the available data) and Abstracts Views on Vision4Press platform.
Data correspond to usage on the plateform after 2015. The current usage metrics is available 48-96 hours after online publication and is updated daily on week days.
Initial download of the metrics may take a while.