Fig. 5
Download original image
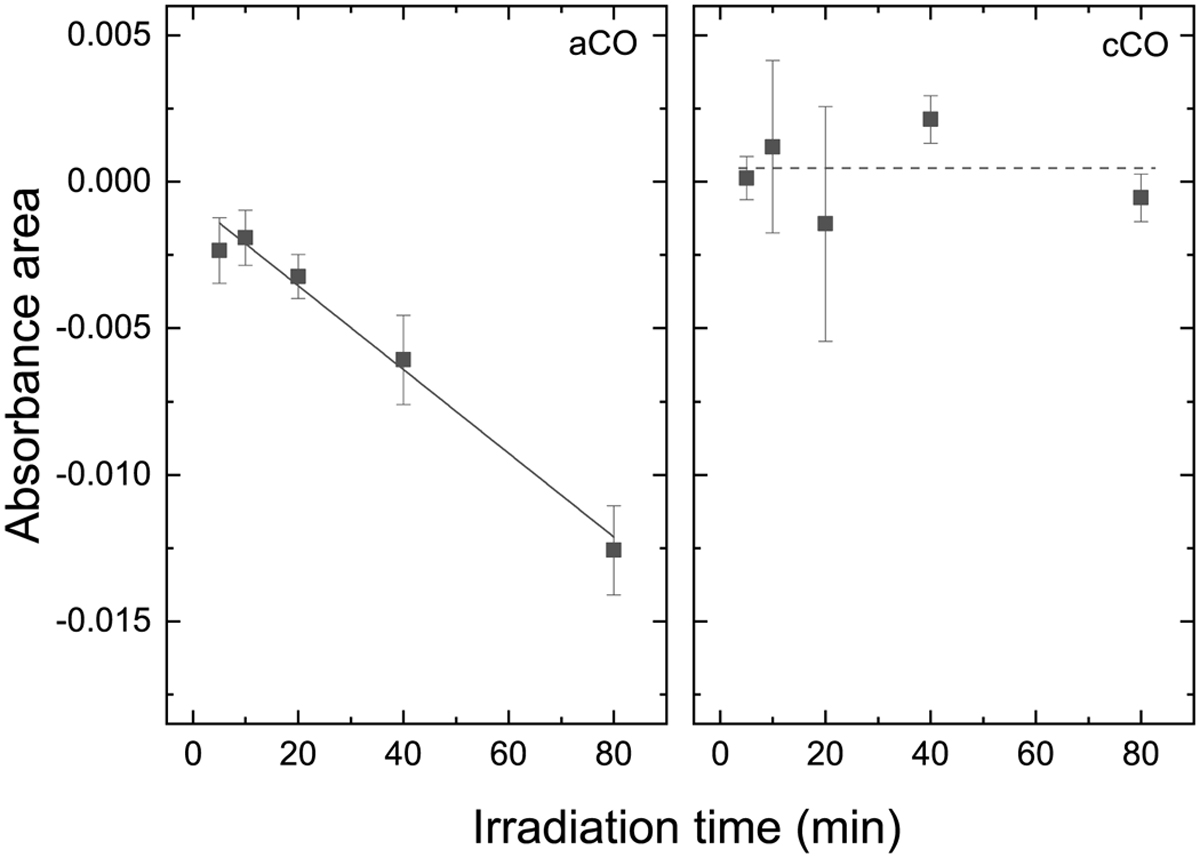
Plot of the integrated area of the stretching mode of CO in the difference spectra obtained as a function of irradiation time. Left panel: irradiation of amorphous CO ice. The solid line shows the linear fit to the points. Right panel: irradiation of crystalline CO ice. The averaged integrated noise is denoted by the dashed line.
Current usage metrics show cumulative count of Article Views (full-text article views including HTML views, PDF and ePub downloads, according to the available data) and Abstracts Views on Vision4Press platform.
Data correspond to usage on the plateform after 2015. The current usage metrics is available 48-96 hours after online publication and is updated daily on week days.
Initial download of the metrics may take a while.