Fig. 2
Download original image
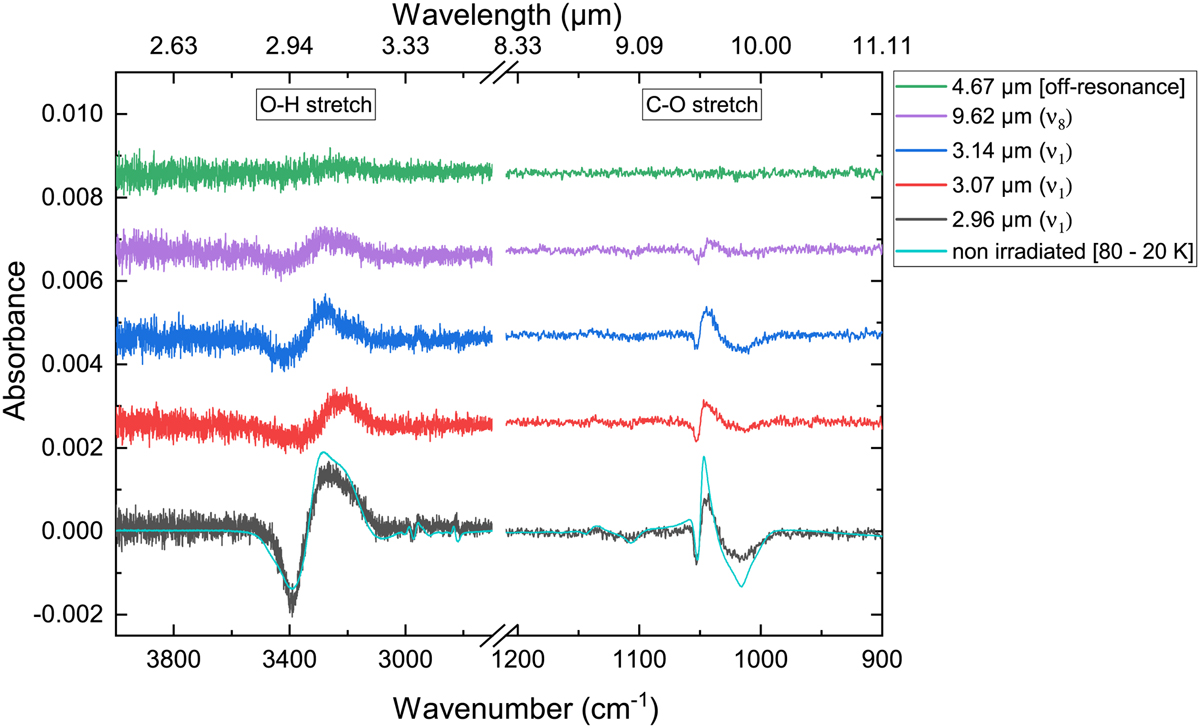
Difference spectra obtained before and after 5 min of IR-FEL irradiation on methanol ice at 20 K. The difference between spectra acquired at 80 K and 20 K (without IR irradiation) during a TPD control experiment is also shown in cyan and included in the 2.96 µm plot. To allow for a direct comparison, all spectra are plotted for the same scale; the differences in the noise level between 3 µm and 9 µm are due to the intrinsic wavelength-dependent S/N of the FTIR. The irradiation spectra are offset for clarity.
Current usage metrics show cumulative count of Article Views (full-text article views including HTML views, PDF and ePub downloads, according to the available data) and Abstracts Views on Vision4Press platform.
Data correspond to usage on the plateform after 2015. The current usage metrics is available 48-96 hours after online publication and is updated daily on week days.
Initial download of the metrics may take a while.