Fig. 3.
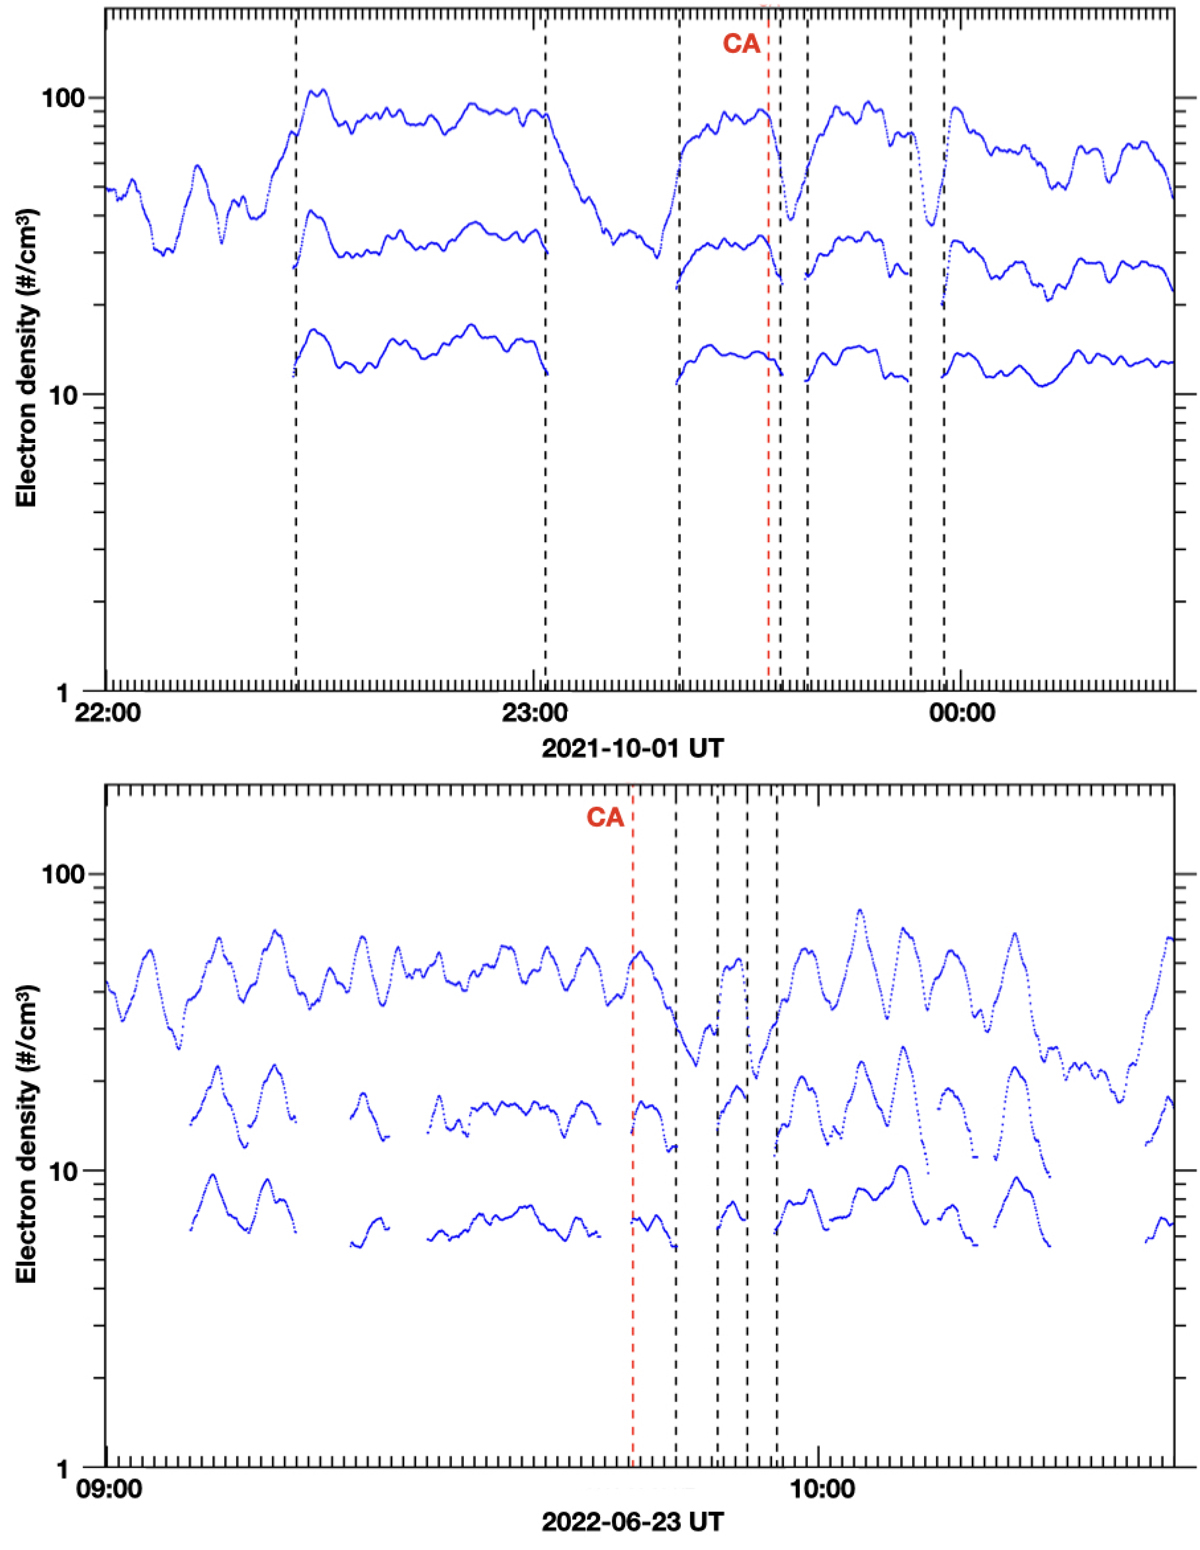
Download original image
Estimate of the electron density from QTN thermal plateau detection (see method in the text), during the first Mercury’s flyby from 22:00 to 0:30 UTC (MSB1 on top) and the second one from 9:00 to 10:30 UTC (MSB2 on bottom), respectively, using the stowed WPT antenna. In each panel, we plotted in blue the upper and lower (if any) limits of the density and the average of both. The different dashed lines correspond to some identified density drops, as explained in the text. The red dashed line indicates the closest approach (CA).
Current usage metrics show cumulative count of Article Views (full-text article views including HTML views, PDF and ePub downloads, according to the available data) and Abstracts Views on Vision4Press platform.
Data correspond to usage on the plateform after 2015. The current usage metrics is available 48-96 hours after online publication and is updated daily on week days.
Initial download of the metrics may take a while.