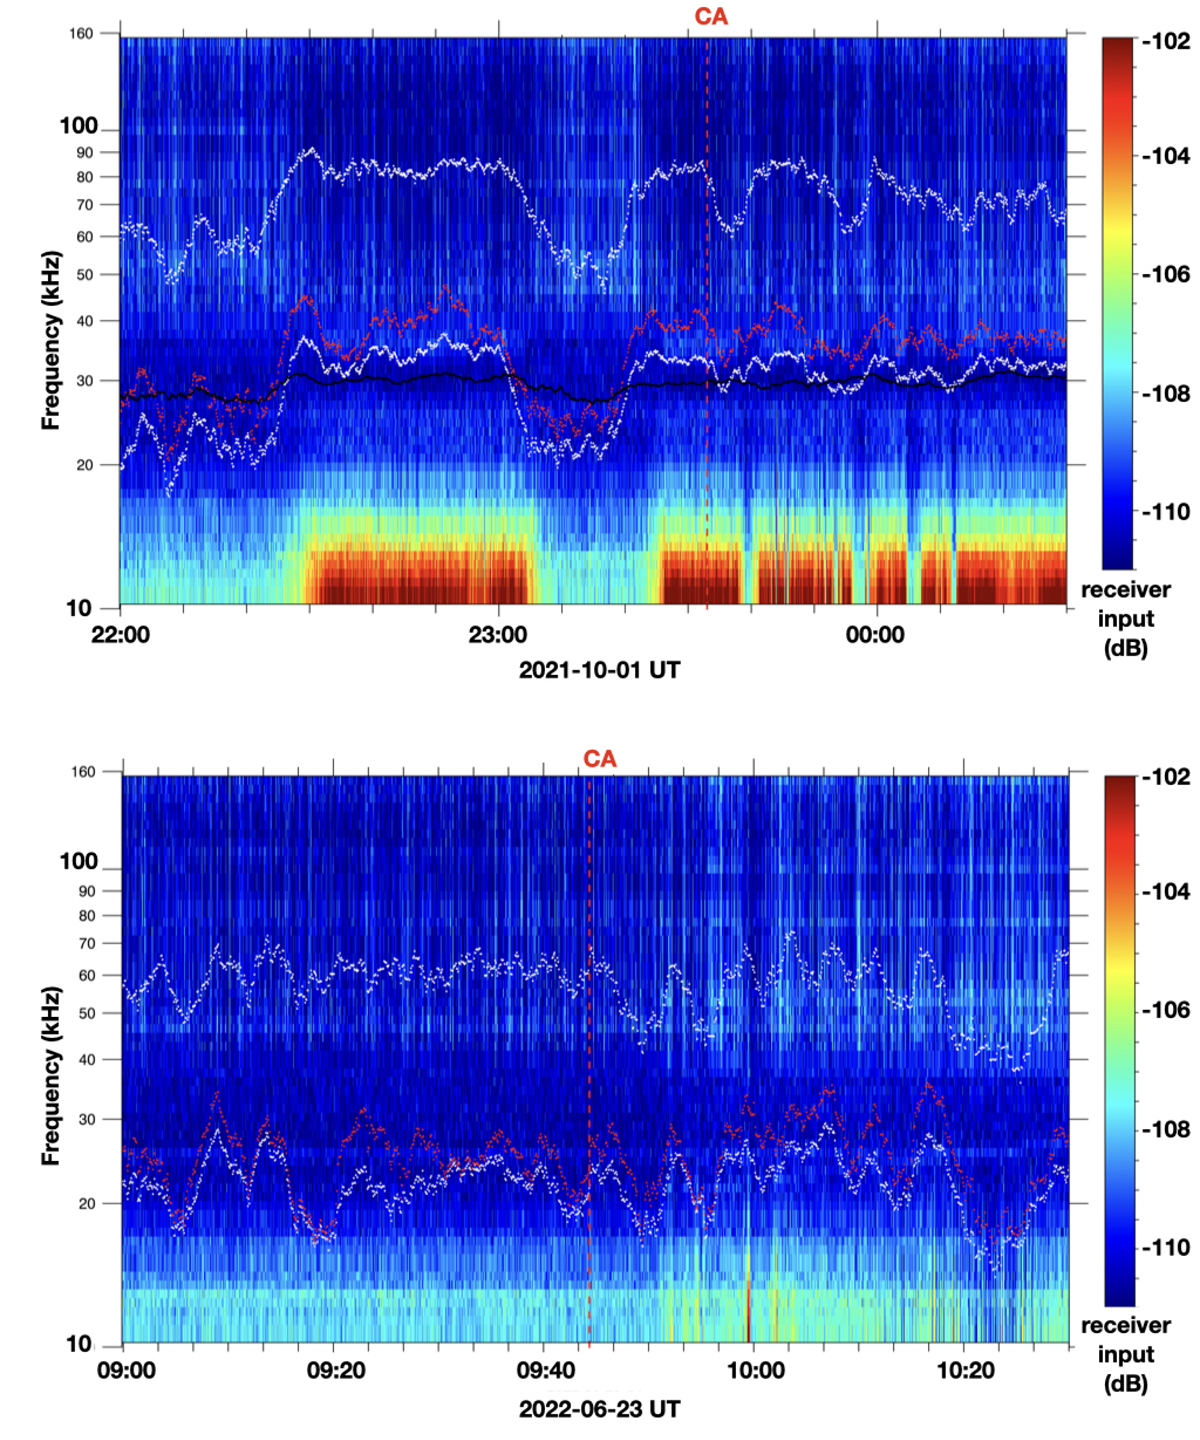
Fig. 2.
Download original image
Radio spectrograms (frequency versus time) between 10 and 160 kHz of SORBET spectrometer obtained during Mercury’s flyby on 1October 2021 (MSB1 on top), and 23 June 2022 (MSB2 on bottom), respectively (the cadence was one spectrum every 4 s), with a color bar chart on the right indicating the level (in dB). Superimposed upper and lower white curves (dots) show the plasma frequency limits, fp, sup and fp, inf, respectively, as determined by the QTN plateau detection. The red dots shows the fp, proxy as explained in the text, and, on top panel only, the smoothed black curve indicates the frequency of the spectral absolute minimum strictly below fp, sup.
Current usage metrics show cumulative count of Article Views (full-text article views including HTML views, PDF and ePub downloads, according to the available data) and Abstracts Views on Vision4Press platform.
Data correspond to usage on the plateform after 2015. The current usage metrics is available 48-96 hours after online publication and is updated daily on week days.
Initial download of the metrics may take a while.