| Issue |
A&A
Volume 669, January 2023
|
|
|---|---|---|
| Article Number | A148 | |
| Number of page(s) | 23 | |
| Section | Extragalactic astronomy | |
| DOI | https://doi.org/10.1051/0004-6361/202245347 | |
| Published online | 24 January 2023 | |
Radio continuum and OH line emission of high-z OH megamaser galaxies
1
College of Physics, Guizhou University, 550025 Guiyang, PR China
e-mail: This email address is being protected from spambots. You need JavaScript enabled to view it.
2
Special Astrophysical Observatory of RAS, Nizhny Arkhyz 369167, Russia
3
Shanghai Astronomical Observatory, Chinese Academy of Sciences, 80 Nandan Road, Shanghai 200030, PR China
4
National Astronomical Observatories, Chinese Academy of Sciences, Beijing 100101, PR China
5
CAS Key Laboratory of FAST, National Astronomical Observatories, Chinese Academy of Sciences, Beijing 100101, PR China
6
Kazan Federal University, 18 Kremlyovskaya St, Kazan 420008, Russia
Received:
1
November
2022
Accepted:
2
December
2022
Abstract
We present a study of the arcsecond-scale radio continuum and OH line emission of a sample of known OH megamaser (OHM) galaxies with z ≥ 0.15 using archival Very Large Array (VLA) data and also the results of our pilot Five-hundred-meter Aperture Spherical radio Telescope (FAST) observations of 12 of these OHM galaxies. The arcsecond-scale resolution images show that the OH emission is distributed in one compact structure and is spatially associated with radio continuum emission. Furthermore, nearly all the components we fit are likely smaller than the beam size (∼1.4″), which indicates that the broad OH line profiles of these sources originated from one masing region or that more components are distributed on subarcsecond scales. The radio parameters, including brightness temperature, spectral index, and q-index, show no significant differences with low-redshift OHM galaxies, which have significantly lower OH line luminosities. Because these parameters are indicators of the central power sources (active galactic nucleus, starburst, or both), our results indicate that the presence of a radio active galactic nucleus in the nuclei may not be essential for the formation of OH emission. Over one-third of OHMs in this sample (6 out of 17) show possible variable features that are likely caused by interstellar scintillation due to small angular sizes. We might underestimate this value because these sources are associated with the highest OH line flux densities of this sample. The sources with low OH line flux densities might need observations with higher sensitivity so that the variabilities can be studied. These results support the compact nature of OH maser emission and a starburst origin for the OHMs in our selected sample.
Key words: galaxies: starburst / radio continuum: galaxies / radio lines: galaxies / galaxies: active
© The Authors 2023
 Open Access article, published by EDP Sciences, under the terms of the Creative Commons Attribution License (https://creativecommons.org/licenses/by/4.0), which permits unrestricted use, distribution, and reproduction in any medium, provided the original work is properly cited.
This article is published in open access under the Subscribe-to-Open model. This email address is being protected from spambots. You need JavaScript enabled to view it. to support open access publication.
1. Introduction
OH megamasers (OHMs) are a type of luminous extragalactic maser source that produce nonthermal emission from the hydroxyl (OH) molecules, with two main lines at 1665/166 MHz and two satellite lines at 1612/1720 MHz (McBride et al. 2013). Generally, OHM emission was thought to be pumped by infrared radiation from their environment and by an amplification of an intense radio continuum background. Therefore, OHM galaxies were detected primarily through targeted surveys in luminous infrared galaxies (LIRGs; LFIR > 1011 L⊙) or in ultraluminous infrared galaxies (ULIRGs; LFIR > 1012 L⊙; see Norris et al. 1989; Staveley-Smith et al. 1992; Darling & Giovanelli 2000, 2002a; Willett 2012). A total number of over 119 OHMs have been found in (U)LIRGs (until 2014; Zhang et al. 2014).
Alternatively, high-sensitivity H I surveys, such as the Arecibo Legacy Fast Arecibo L-Band Feed Array (ALFALFA) H I survey (see Haynes et al. 2018), the upcoming H I surveys by the Five-hundred-meter Aperture Spherical radio Telescope (FAST; Zhang et al. 2019) and those with the Square Kilometre Array (SKA) and its precursors (see Roberts et al. 2021), can serve as blind surveys for detecting redshifted OH lines. In these untargeted emission-line surveys for neutral hydrogen, the OH lines can mimic a low-redshift H I line, which needs optical spectroscopy or other methods developed in the literature to distinguish H I from OH (see Roberts et al. 2021). Then, the characteristics of OH line emission of known OHM galaxies at similar redshift might also be considered complementary for these methods to identify OH emission.
One characteristic of OH maser emission is that they are compact in high-resolution observations. The emission is generally unresolved at VLA angular scales (∼1.4″), but can be resolved using long-baseline arrays such as the Very Long Baseline Array (VLBA), European VLBI Network (EVN), and Multi-Element Radio-Linked Interferometer Network (MERLIN; Pihlström 2007). The very-long-baseline interferometry (VLBI) observations led to the suggestion that there are two different types of OH emission: diffuse and compact emission, which originate in different modes or were attributed to these differences in line overlap effects of compact masing clouds (see Lockett & Elitzur 2008, and references therein for details). Meanwhile, VLBI observations of several nearby OHMs indicated that compact OHM sources typically extend to 100 pc, while diffuse OHM emission might spread over the 100 pc scale structure (see Lo 2005; Pihlström 2007).
A second characteristic is that the OHM emission might be variable. Generally, it is thought that an OHM galaxy at z > 0.1 is distant enough for many masing regions to have sufficiently small angular scales to show interstellar scintillation (ISS; see Darling & Giovanelli 2001; Walker 1998). Darling & Giovanelli (2002b) and Darling (2007) have presented several discoveries of time variability of OHM emission caused by ISS and provided additional evidence that narrow lines correspond to compact masing regions. However, the time variability of OHM emission caused by intrinsic changes in the maser environment has rarely been studied. Harvey-Smith et al. (2016) found that the flux density of the brightest OH maser components of IRAS 20100-4156 has reduced by more than a factor of 2 over 26 yr. Similarly, McBride et al. (2015) showed that the amplitudes in the VLBI spectra of Arp 220 decreased about 40% in 14 yr. In the literature, the variation of the OHM emission in these two sources are thought to be intrinsically caused by masing regions rather than variability produced by ISS. Because the variability timescale in the two cases exceeds 10 yr, new observations of the known OHM galaxies, which were detected by the Arecibo telescope 20 yr ago by Darling & Giovanelli (2000, 2001, 2002a), can be helpful further in studying the time variation of the OHM line emission.
The third characteristic is that the OHM emission is generally associated with the radio continuum emission from arcsecond-scale observations. The Very Large Array (VLA) A array observations of a few nearby OHM galaxies found that the OHM maser emission very closely coincides with one component of the radio continuum, typically ≤1″ (e.g., Arp 220, IRAS 17208-0014; see Lo 2005). In the literature, optical spectrography has found that about 67% of the OHM galaxies can be classified as active galactic nuclei (AGN) or show evidence of both AGN and starburst activity (e.g., Baan et al. 1998; Darling & Giovanelli 2006). Because the optical line emission may be swamped by dust emission from the nuclei and envelope (Sales et al. 2015), the actual fraction of AGN in OHM galaxies might be higher. Recent results from an ongoing project using the Hubble Space Telescope (HST), the VLA, and Integral Field Spectroscopy (IFS) data have successively identified a previously unknown AGN in four of five OHM galaxies (see Hekatelyne et al. 2018a,b, 2020; Sales et al. 2015). The possibility of an AGN in the fifth OHM galaxy (IRAS 17526+3253) cannot be excluded based on current data either (see Hekatelyne et al. 2020; Sales et al. 2019). These results support the hypothesis that OHM galaxies harbor a recently triggered AGN (see Hekatelyne et al. 2020). The properties of radio continuum emission, including spectral index and brightness temperature, can also be used to classify the central energy source of OHM galaxies (Kandalyan 2005a,b; Baan & Klöckner 2006; Sotnikova et al. 2022). Kandalyan (2005a) and Baan & Klöckner (2006) obtained the radio structure of 30 and 51 OHM galaxies in the radio continuum based on VLA observations. They found that the OHM galaxies can be classified into different types, for instance, AGN and starburst-dominated sources. Similarly, Sotnikova et al. (2022) investigated the radio multiband spectral indexes of 74 OHMs with RATAN observations and found that 32% of the OHM sample are flat-spectrum sources. This is likely a sign of the presence of AGNs in these galaxies.
Generally, future blind H I surveys could mainly detect redshifted OHM galaxies, which should be at relatively high redshift. The first sample of OHMs comes from the blind Arecibo H I survey with redshift ranges at 0.16 < z < 0.22 (see Haynes et al. 2018). Darling & Giovanelli (2002a) and Baan (2009) have shown that distant luminous OHM galaxies display strong and broad multiple component profiles that differ significantly from nearby sources. Therefore, the main aims of this paper are to investigate the characteristics of the continuum and OH line emission of high-z known OHM galaxies. Then, our results will help understand the connections with low-redshift OHM galaxies and may also help identify OHM galaxies detected in future blind H I surveys. We present the sample selection, observations, and data reductions in Sect. 2. The results, discussions, and summary are given in Sects. 3–5.
2. Sample selection and data analysis
2.1. Sample selection
Based on a sample of 30 OHM galaxies with redshift ranges from z ≥ 0.15 to the highest 0.2644 from Zhang et al. (2014), we found archive VLA data for OH line and radio continuum observations. They are available for 12 and 21 sources, respectively (see Tables 1 and A.1). The high-resolution VLA observations of the OH line emission are mainly from two VLA projects, AD462 and AD483 (PI: Darling, J.). The details of these projects for OH line and radio continuum emission are listed in Table A.1. Furthermore, we randomly selected 12 OHM galaxies for pilot observations with the FAST telescope to study the possible variable properties of the OH line profiles. The observational and derived properties of the selected sample are present in Table 1.
Sample properties.
2.2. Reduction of the VLA archival data
We reduced the historical VLA data with standard procedures using the NRAO Astronomical Image Processing System (AIPS), including initial data flagging, amplitude, phase, calibrations, and the correction for bandpass. We also shifted the radial velocity to correct for the effects of the Earth’s rotation and its motion within the Solar System and toward the local standard of rest. The EVLA data for the continuum emission were performed using the Common Astronomy Software Applications (CASA; McMullin et al. 2007) package pipeline (version 5.4.1). We imported all the calibrated data into the DIFMAP package Shepherd (1997) to obtain the continuum and OH line channel images. The continuum images of the OH line projects were produced using line-free channels, and we made the OH line channel images after the subtraction of the clean model obtained from the radio continuum emission.
2.3. FAST observations and data reduction
We conducted pilot FAST observations of 12 high-z OHMs and list the observational parameters in Table 2. We used the central beam (M01) of the 19-beam receiver with ON/OFF mode. We recorded the data every 1.00663296 s and injected a 10 K continuum signal using a noise diode every 32.21225472 s. Our data reduction procedures are described below.
Parameters of FAST observations.
First, we converted the spectral signals into units of K using the nearest noise diode from the data. We adopted the average value of about 11.5 K for the injected signal, which is the mean value in median_20190115.Tcal-results.HI_w.high.sav measured by the FAST group. Second, we further converted the signals into units of Jy with the equation Gain = ∼16.0 K Jy−1, which is from the fundamental performance parameters of the FAST telescope when the zenith angle θZA < 26.4° (available in the webpage1). Third, we generated the spectra of target-ON and target-OFF by combining the first two polarizations and then subtracted ON–OFF (see Fig. A.1). Because the baseline of the ON-OFF spectra still contains ripple caused by standing waves, we fit the baseline with the equation
 (1)
(1)
where i ranges from 1 to 6 for different sources. We finally subtracted the baseline and obtained the spectrum for each target as present in Figs. 1 and A.2. The channels affected by frequency interference (RFI) are labeled in yellow. They were identified by visually comparing the ON and OFF spectra, where both the on and off spectra show bumps higher than the typical waves (see Figs. 1, A.1, and A.2).
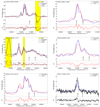 |
Fig. 1. OH spectra use the 1667.359 MHz line as the rest frequency for the velocity scale. Two arrows stand for the velocity of the 1667.359 (left) and 1665.4018 (right) MHz lines based on the optical redshift. Blue: Arecibo observations by Darling & Giovanelli (2000, 2001, 2002a), Robishaw et al. (2008). Red: VLA-A observations as listed in Table A.1. Black: FAST observations as listed in Table 2. For each figure, the top panel presents the observed OH spectra, and the bottom panel presents the ΔF = OHVLA/FAST-OHArecibo to show the variations between the two or three epoch results. Red and black stand for the spectra from VLA and FAST, respectively. The dashed lines represent the 3σ level estimated from the standard deviation of ΔF using the line-free channels. |
3. Results
3.1. Arcsecond-scale OH line emission
We detected OH line emission from 11 of the 12 sources using the VLA archival data. We generated the OH spectra (see Fig. 1) by integrating the flux densities from a 3σ region defined from the combined line emission images, as shown in Fig. A.3. The OH emission images all show core-dominated structures. We fit these images with one Gaussian component. The fit component sizes are smaller than one beam (see Table A.1). As shown in Fig. 1, the OH line profiles indicate that we recovered all the OH line flux found from single-dish Arecibo observations. These results suggest that the dominant OH emissions are compact (see Fig. A.3) and distributed in a region with sizes smaller than the arcsecond scale.
3.2. OH line profiles from FAST observations
We present the OH spectra from our pilot FAST observations for 12 sources (see Figs. 1 and A.2). The OH profiles from FAST observations agree with the results from previous Arecibo observations in the literature (Darling & Giovanelli 2000, 2001, 2002a) or archive VLA data investigated in this work. Six sources likely show OHM emission variability for their narrow-line components (see Fig. 1), including three known variable sources (02524+2046, 12032+1707, and 21272+2514; see Darling & Giovanelli 2002b; Darling 2007).
The OH satellite lines in OHM galaxies are rarely detected. We also tried to search for the OH satellite lines (OH 1612 and 1720 MHz lines) based on our pilot observations. The binned spectra of each source with a resolution of about 10 km s−1 are shown in Fig. A.4. We present an upper limit of the two OH satellite lines for ten sources (see Table 2) that is lower than the values measured by McBride et al. (2013). Our results agree with the view from McBride et al. (2013) that there is no evidence for a significant population of strong satellite line emitters among OHMs.
3.3. Radio structure of the continuum emission
The arcsecond-scale radio structure of OHM galaxies is available for 21 sources (see Table A.1). The radio images for sources with arcsecond-scale VLA line observations and extended structures are presented in Figs. 2, A.3, and A.5. We found that the radio continuum emission of these sources shows no clear extended structure from the VLASS survey and L-band VLA-A observations (see Fig. A.3). Five sources show possible extended structure at subarcsec scale from C- or X-band VLA data (see Fig. 2), which might be caused by possible jet or starburst regions. However, all the radio continuum emissions can be fit with one Gaussian component with a size smaller than the beam FWHM (see Table A.1).
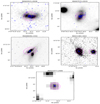 |
Fig. 2. VLA contours overlaid on SDSS or HST R-band gray image of OHMs. Magenta: contour map of the radio continuum emission from the VLASS survey. Blue: C- or X-band contour map of the radio continuum emission. IRAS 03521: C-band at epoch 2002Jan2. IRAS 07572: C-band at 2002Jan2. IRAS 08449: 9 GHz at 2016Dec02 IRAS 11180: X-band at 2004OCT1. IRAS 21077: 9 GHz at 2014May23. The image parameters, including the map peak, beam FWHM, and 3σ noise level, are listed in Table A.1. |
4. Discussion
4.1. High-resolution OH line emission
Because the majority of these galaxies likely show several nuclei from optical images (see Fig. A.3), the broad OH line profiles of these galaxies might be caused by the combination of maser emission from multi-masing nuclei (see the notes for each source in Sect. 4.7). We present the arcsecond-scale structure of OH line emission for 11 of the 12 sources with available VLA-A observations. Our results recovered all the OH maser emissions detected by a single-dish telescope in the literature or our new FAST observations. This indicates that most of the fit component sizes of the OH emission are much smaller than the beam size of VLA-A (∼1.4″), and the actual physical sizes should be smaller than the kiloparsec scale.
These OH masing regions might also contain two nuclei within 1 kpc (e.g., the separation of the two nuclei of the well-known OHM galaxy Arp 220 is about 0.4 kpc). Higher-resolution observations of these sources are needed. However, VLBI observations of four galaxies in this sample are available in the literature, showing that the compact OH maser emission is distributed on a scale of hundreds of parsecs (IRAS 02524, 08201, 12032, and 14070; see Sect. 4.7 for the notes for each source and references therein). This means that other factors probably cause the broad OH profiles, including an orbiting disk, inflows or outflows, or a particular merging stage (see Pihlström et al. 2005).
4.2. Variability of OH line emission
Generally, variability in OHMs provides additional evidence that narrow lines correspond to compact masing regions because this variability is thought to be caused by interstellar scintillation (Darling & Giovanelli 2002b). Harvey-Smith et al. (2016) and McBride et al. (2015) reported that the intrinsic variability in the amplitudes of OH features is related to the masing region and not to that produced by interstellar scintillation. One characteristic of the inherent variability caused by masing clouds is the significant decrease in OH line flux density during more than 10 yr (Harvey-Smith et al. 2016; McBride et al. 2015). Nearly all the OHM galaxies in this study were first detected by Arecibo OH surveys 20 yr ago. However, our new FAST observations find that the OH flux densities are consistent with previous observations, likely showing that no similar cases were caused by intrinsic changes. Because the intrinsic variability is unclear, decreasing OH flux densities might only respond to the compact masers found in VLBI observations (Harvey-Smith et al. 2016). High-resolution interferometric observations are needed to study these variabilities further.
The VLA and FAST observations showed that the OH profiles of six sources are variable. The results confirm the arguments from Darling (2007) that IRAS 12032+1707 shows variability in at least two line components (Darling 2007). Two other known variable sources in OH line profiles (Darling 2007), IRAS 02524+2046 and IRAS 21272+2514, also show variabilities when the multi-epoch observations are compared. We also found that three new sources, including IRAS 08201+2801, IRAS 23028+0725, and IRAS 11028+3130, were also variable in their OH profiles. Three variable sources are available with VLBI observations for OH line emission, and all show compact structures of OH emission (IRAS 02524, IRAS 08201, and IRAS 12032; see the notes for each source in Sect. 4.7). The OH emission variability is therefore consistent with the small size of masing clouds. These six sources detected with OH line variability show the highest line flux densities of this sample. Other sources with weak OH emission might need higher-sensitivity observations to catch their variabilities.
4.3. Radio continuum emission and association of the OH line
We have presented the radio structure of continuum emission for 21 sources and OH line emission for 11 sources. We found that the arcsecond-scale radio continuum and OH line emission of our sample show no significant extended structures. The fit image component size is smaller than the beam size (see Table A.1). We estimated the relative positions between OH line and continuum peak positions (δlc; see Table 1). The δlc ranges from 0.06 to 0.58 arcsec and are all smaller than the 3σ of the uncertainties. This means that δlc are not significant, which is similar to the results for low-redshift OHM galaxies (see Lo 2005, and references therein).
4.4. Classification of the dominant power source for the radio activity of OHM galaxies
Generally, the ratio of the far-infared (FIR) to the radio flux density (q-ratio), brightness temperature (Tb), and spectral index are three independent radio parameters for classifying the radio activity in the nuclei. Based on these three parameters, Baan & Klöckner (2006) defined an activity factor βc to provide a consistent picture of the radio nature of the nuclei. The OHMs and candidates in Baan & Klöckner (2006) were detected before the Arecibo OH surveys (Darling & Giovanelli 2000, 2001, 2002a), which are nearly all known OHMs at low redshift (z < 0.1). We selected the low-redshift OHMs from Baan & Klöckner (2006) based on their OH luminosity available in Zhang et al. (2014), including 34 low-redshift OHMs (30 sources with z < 0.1 and 4 sources with z < 0.136) as the control sample.
We calculated the radio parameters for our selected high-redshift OHMs following the methods in Baan & Klöckner (2006) and report the results in Table 1. We performed the two-sided Kolmogorov–Smirnov (K–S) statistical test to compare the properties of the low- and high-redshift sample; the results are presented in Table 3. LOH, L1.4 GHz, and LIR of the two samples are significantly different, with p-values much lower than 0.01. However, the p-values for q(1.4), q(4.8), βc and Tb are all much higher than 0.01, which indicates that the two samples do not show significant evidence of being drawn from different distributions for these radio parameters.
Statistical parameters of high- and low-redshift OHM galaxies.
The radio continuum emission of OHMs shows that extended emission might be related to a central disk, possible jet structures, or multiple nuclei structures. Because most OHMs show compact radio emission for our selected high-z samples and low-z samples from Baan & Klöckner (2006), we only compared the sources with large extended structures. Baan & Klöckner (2006) measured the physical scale of four sources with significant extensions, which are about 3.0, 4.3, 6.4, and 16.8 kpc. About five sources in this work show clear structures (see Fig. 2). The scales (the distance between peak centers or peak center to the farthest edge measured from 3σ radio contour images) are about 3.5, 8.6, 2.3 1.8 (21.8), and 2.4 kpc (see Fig. 2 and the notes for each source in Sect. 4.7). Then, there also seem to be no significant differences in the scale of extended structures between the low. and high-redshift OHMs in our selected sample.
4.5. Radio properties and the OH emission detection
Zhang et al. (2014) reported that the AGN fraction (based on empirical criteria from Wide-Field Infrared Survey Explorer (WISE) color) is similar for both OHM and non-OHM samples with a value of 40%. Similarly, Darling & Giovanelli (2006) also found no distinguishing spectral properties to distinguish OHMs from nonmasing mergers using optical spectrophotometry studies. Based on the optical classification listed in Table 1, about 71% of sources (15) can be classified as AGN or AGN candidates. We also found that 62% of the low-z sample (21 of 34 OHMs) are AGN or AGN candidates. Although the AGN rate is slightly higher in the high-redshift sources, the AGN fraction of the low- and high-redshift sample seems to have no significant differences within the uncertainties (∼16–19% derived based on the 95% confidence level of a binomial proportion). Sotnikova et al. (2022) showed no significant correlation between LOH with spectral indexes of the radio continuum emission. We further found that there are no significant differences in the classification of radio properties between the low- and high-redshift OHM galaxies. We note that the LOH of our selected high-redshift sample is much higher than the low-redshift sample on average. These results show that the nucleus classifications of the power source do not significantly affect the luminosity of the detected OH line emission.
Furthermore, high-resolution VLBI observations are only available for several sources in this sample: IRAS 08201+2801, IRAS 10339+1548, IRAS 12032+1707, IRAS 02524+2046, and IRAS 14070+0525. None of these sources shows radio continuum emission above a 3σ level (see Sect. 4.7 and references therein). Farrah et al. (2003) showed that the radio flux correlates with the starburst luminosity and that the gas masses rather than the AGN in the nuclear regions govern the total luminosities of ULIRGs. This means that the origin of the radio continuum emission might a starburst rather than the central AGN. This is consistent with the view from Rovilos et al. (2003) that the existence of an AGN in OHM galaxies may well be a random phenomenon that is not associated with their masing properties. High-resolution optical imaging and spectroscopy observations of OHM galaxies have also shown many star-forming regions in the nuclei of these galaxies (see Hekatelyne et al. 2020; Migenes et al. 2011). These results support a starburst origin for the OHMs, and the OH masing regions are largely thought to be star-forming (see Pérez-Torres et al. 2021; Wu et al. 2022). Because of the existence of star-forming regions, the signature of an AGN in OHM galaxies may be lost when standard diagnostic diagrams are used (see Migenes et al. 2011). An ongoing project using high-resolution optical–IR multiwavelength imaging and spectroscopy analysis has studied 5 of a sample of 15 OHM galaxies known to be dominated by star formation. However, the results showed a previously unknown AGN in four sources, which support the hypothesis that OHM galaxies harbor faint recently triggered AGN (see Hekatelyne et al. 2020, and references therein). Although compact radio jets might have with much shorter lifetimes than the triggered AGN (see Emonts et al. 2006; Evans et al. 1999), further high-sensitivity radio interferometry and VLBI observations of a large number of OHM galaxies can also be useful to find evidence of radio AGN and their connections with the megamaser emission (Peng et al. 2020).
Because the OHM emission region of our sample is compact at the kiloparsec-scale, it is also possible that there are multimasing regions or nuclei at the subkiloparsec scale, similar to Arp 220 (the separation of the two cores is about 0.4 kpc; Rovilos et al. 2003). However, we do not find two isolated components from subarcsecond-scale radio images of 12 galaxies at C and X band (see Fig. 2 and Table. A.1). Because of the association of OH emission and radio continuum, the OH emission may also be compact at subarcsecond-scale observations. However, OH line observations at these resolutions are needed to further confirm the OH emission structure.
4.6. Implications from the results of our pilot FAST OH observations
We randomly selected 12 high-redshift sources for pilot FAST observations from 30 known high-z OHM galaxies. We performed a K–S test that shows no significant differences between our chosen sample and the remaining 18 high-redshift OHM galaxies, including OH line peak, FWHM, and LOH. The 12 sources for our pilot observations might give us clues about the properties of a complete sample of high-redshift OHM galaxies available in the literature: (1) The detection of intrinsic change of masing regions-related variability might need observations of a much larger sample or blind surveys because the detection rate should be lower than 1/10. (2) The detection rate of variability caused by ISS is about one-third, and the actual detection rate might be higher than this value when we set a lower limit for the flux density. This supports the view that the OHM emission clouds are small; the actual timescales of the variations will need shorter spaced observations to detect the variations. (3) The OH 1665 MHz line existed for all the sources. However, over two-thirds of these sources show broad multipeak OH 1667 MHz profiles blended with the OH 1665 MHz line. The detection of two OH satellite lines needs significantly lower sensitivity observations of these OHM galaxies.
4.7. Notes on individual sources
4.7.1. 01562+2528
The SDSS image of this source shows two nuclei located in the northwest (NW) and southeast (SE) region (see Fig. A.3). Darling & Giovanelli (2006) measured the optical redshift of the two nuclei and found that the velocity of the NW nucleus is consistent with the OH redshift. However, our results show that the radio continuum and OH line emission are spatially associated with the SE nucleus. The optical velocity of the SE nucleus is about 49 385 km s−1 (Darling & Giovanelli 2006), which is about 280 km s−1 lower than the NW nucleus, and about 429 km s−1 lower than the heliocentric velocity centroid of the 1667 MHz OH line. The OH spectrum from VLA is roughly consistent with that from the Arecibo observation (Darling & Giovanelli 2002a); they both show that the 1665 MHz line is adjacent to the OH 1667 MHz line. A minor difference is that the VLA spectra also indicate a possible peak of the 1665 MHz profile (see Fig. A.2).
4.7.2. 02524+2046
The OH line profiles of this source show strong and narrow 1667 and 1665 MHz lines (Darling & Giovanelli 2002a). It is one of the known variable OHM galaxies (Darling 2007). The VLA and FAST observations also indicated that this source is a variable source for the narrow-line components (see Fig. 1). VLBI observations of the OH line and continuum emission by Peng et al. (2020) showed that the OH emission of IRAS 02524+2046 is distributed in a region about 210×90 pc. They also detected no significant continuum emission at 3σ level of 30 μJy beam−1. The brightness temperature is also about 106 K.
4.7.3. 03521+0028
This is a close pair separated by only 3.5 kpc from optical and near-infrared images (Veilleux et al. 2002). The C-band VLA observations also show two separated components (see Fig. 2).
4.7.4. 07572+0533
Darling & Giovanelli (2001) found a blueward feature about (∼3σ) 400 km s−1 against the main 1667 MHz line. Our line profiles from FAST also detected the blueward feature. We also detected a second narrow component from the OH 1667 MHz line. The 1665 MHz line component is also consistent with that from the Arecibo observations. We detected an extension of the radio continuum emission with scales of about 8.6 kpc
4.7.5. 08201+2081
The HST image of this source shows two nuclei (Darling & Giovanelli 2001). Our results show that the radio continuum and OH emission are likely both peaks at the southern nuclei (see Fig. A.3). The more accurate position of the compact OH emission (RA = 08 23 12.614, Dec = 27 51 39.670) from EVN observations (Rovilos 2004) is consistent with the position we measured from the VLA-A project (see Table 2). No compact radio continuum emission is detected above a 3σ level of about 0.45 mJy beam−1 from EVN observations (see Rovilos 2004).
4.7.6. 08279+0956
The optical image of this source shows three tidal tails (see Fig. A.3 and Vignali et al. 2005). The VLA spectrum is consistent with the Arecibo spectra from Pihlström et al. (2001), which contain the 1667 MHz line and the 1665 MHz line. The OH spectrum from FAST observation only detected part of the 1667 MHz line, while over half of the line profile is covered by possible RFI (see Fig. A.2). The FAST spectra also show a feature at a velocity of about 61 800 km s−1, but RFI might cause it because the on and off spectra both show a bump that is slightly higher than other features related to a standing wave (see Fig. A.1).
4.7.7. 08449+2332
The radio continuum emission is compact from arcsecond-scale VLASS and L-Band VLA observations (see Table A.1). The X-band VLA images show an extended structure of about 2.3 kpc. No radio continuum emission is detected from the accompanying galaxy (see Fig. 2).
4.7.8. 09531+1430
The SDSS image shows that this galaxy is an interacting system that contains eastern and western components (see Fig. A.3 and Vignali et al. 2005). The OH spectrum of this object shows two peaks in the 1667 MHz emission, which might originate from two nuclei according to Darling & Giovanelli (2001). We have imaged the radio continuum and two line structures separately, and we found that the peak positions have no offset between these images. The radio continuum and OH emission regions are likely distributed between the two nuclei (see Fig. A.3). Darling & Giovanelli (2001) showed a significant depression in the weights spectrum at the location of the potential 1665 MHz line. The VLA spectrum shows the existence of the 1665 line at the exact location, and the FAST spectrum shows no detection of the OH 1665 line because it contains possible RFI at this velocity range (see Fig. A.2).
4.7.9. 10339+1548
The Arecibo observations by Darling & Giovanelli (2001) indicated that the 1665 MHz line might be a broad feature and cannot be distinguished from a standing wave in the bandpass. The FAST observations likely show the 1665 MHz line feature with an upper limit of the line flux density of about 1.5 mJy. There is also an absorption feature at about V = 58 750 km s−1. Because the on and off spectra of this source are unstable, the baseline of the on-off spectrum is complex (see Fig. A.1), and we cannot exclude the possibility that the baseline fluctuations might also cause the OH 1665 line and the absorption feature. We failed to detect the OH emission from the VLA project as listed in Table A.1, which might be caused by a bright, confusing source near this source.
4.7.10. 11028+3130
This single-nucleus source shows a broad tidal feature to the west (Veilleux et al. 2002). The OH spectrum from the FAST observation is consistent with the result from Darling & Giovanelli (2001), which includes features of the variable 1667 MHz line and the possible existence of the 1665 MHz line (see Fig. 1).
4.7.11. 11180+1623
This source is a wide (21.8 kpc) pair of galaxies (Veilleux et al. 2002). The optical velocity of the eastern component measured by Kim & Sanders (1998) is consistent with the heliocentric velocity centroid of the 1667 MHz OH line, and the OHM emission is more likely associated with this component (11180+1623A). We found that both nuclei show radio continuum emission. 11180+1623A shows a much higher radio flux than the western component and an extended structure over 1.8 kpc (see Fig. 2).
4.7.12. 11524+1058
Darling & Giovanelli (2001) identified a spectral feature as the 1665 MHz line at the predicted location. The FAST spectrum (see Fig. A.2) likely confirmed the existence of the 1665 MHz feature at about 2σ level. The two narrow peaks of OH 1667 line are also consistent with the results from the Arecibo observations (Darling & Giovanelli 2001; see Fig. A.2).
4.7.13. 12032+1707
IRAS F12032+1707 is one of the most luminous OHMs detected. Veilleux et al. (2002) revealed two interacting galaxies separated by 12.0 kpc, which can also be seen in the SDSS image, as shown in Fig. A.3. Darling & Giovanelli (2001) indicated that OH line complexes emitted from this source might originate in two nuclei. Pihlström et al. (2005) observed the IRAS 12032+1707 with VLBA and found that almost all OH emission previously detected by single-dish observations has been recovered on a compact scale < 100 pc. This ruled out the predication about combined OH maser emission from two nuclei. Although this OHM host has a high 1.4 GHz continuum flux density (28.7 mJy), the VLBA observations have detected no significant continuum emission at a 3σ level of 0.3 mJy beam−1 and imply no detection of compact radio AGN in this galaxy. Darling (2007) indicated that the two narrow components of the OH line profiles are variable. The FAST and VLA observations have shown that the brightest narrow component is variable (see Fig. 1). However, the second brightest component is affected by RFI from FAST observation, and the VLA observations are likely to confirm the variabilities at about 2σ level (see Fig. 1).
4.7.14. 13218+0552
The OH spectrum of 13218+0552 shows two prominent broad emission peaks with a separation of 490 km s−1 in the rest frame, which may be associated with multiple nuclei. It also shows tidal features and possibly a double nucleus with separation smaller than 1 kpc (Darling & Giovanelli 2002a). The VLA observations of the OHM and radio continuum emission show no extended emission (see Fig. A.3), but they offer an offset of about 0.58 arcsec (see Table 1).
4.7.15. 14070+0525
This is an OH gigamaser and the most distant OHM known at z = 0.2655; it shows multiple broad peaks of the OH line profiles, which might suggest multiple masing nuclei in this object (Baan et al. 1992; Darling & Giovanelli 2002a). VLBA observations show that a significant fraction of the OH emission is resolved out and also detected no compact radio emission associated with an AGN. The offset between the two detected peaks is not significant (Pihlström et al. 2005). The OH profile from the FAST observation shows no significant variations compared with previous single-dish observations (see Fig. A.2).
4.7.16. 14586+1432
Darling & Giovanelli (2002a) showed that the spectrum of this OHM is extremely broad and complicated, which might be caused by two masing nuclei in this object. We investigated the channel images and found no apparent offsets among the peaks of channel images from low to high velocities. The integrated images of the OH line emission (see Fig. A.3) show that the OH emission in this source is compact and has no extended structures. Similarly, the multiband radio images of the continuum emission show only a compact core and no extended emission.
4.7.17. 21077+3358
The X-band radio continuum image of this galaxy shows an extended structure of about 2.4 kpc.
4.7.18. 21272+2514
This OHM is the first OH megamaser observed to vary in time at a redshift of z = 0.1508, and the spectrum exhibits OH multiple peaks. The VLA-A data have recovered the OH flux densities from single-dish observations and show significant peak variability. The combined channel images show that the OH emission is compact at VLA-A observations. The possible weak extended structure in the western direction might need further high-sensitivity observations for confirmation.
4.7.19. 23028+0725
The OH spectrum from VLA data show that the OH 1667 and 1665 MHz line profiles are consistent with the profile from the Arecibo observation by Darling & Giovanelli (2001). The narrow peak of the 1667 MHz line might show variations (see Fig. 1). We also found that the OH 1667 MHz line and 1665 MHz line emission are compact. They are distributed to spatially coincide with the radio continuum emission (see Fig. A.3).
5. Summary
We have investigated the radio continuum and OH line emission of a sample of known OHM galaxies with z > 0.15. The OH emission with VLA-A observations shows that the OHM emission regions are compact. All the OHM emissions were recovered from less than 1″. The OHM emission is associated with the radio continuum emission with no significant offset. Although several sources show broad OH line profiles, there is only one masing region in these galaxies in arcsecond-scale images. This means that the OH emission regions might be single, or that the physical size of the masing areas is much smaller than one kiloparsec. Based on the radio continuum emission, we derived the parameters, including brightness temperature, spectral index, q index, and nuclei activity factor β. These parameters show no significant differences with the low-redshift OHM galaxies. Because the high-z sample shows significantly higher LOH and because these parameters stand for the classification of the power source of the nuclei, this indicates that a radio AGN might not affect the LOH of OHM galaxies. The new FAST observations of 12 known galaxies found that 6 sources are variable and that no intrinsic variability is caused by the environments, which requires a significant decrease in OH line flux densities on long timescales. The FAST observations present a lower limit of the OH satellite lines of these galaxies.
Acknowledgments
We thank the anonymous referee for his/her useful comments and suggestions on the manuscript. The study was funded by RFBR and NSFC, project number 21-52-53035 “The Radio Properties and Structure of OH Megamaser Galaxies”. This work is supported by the grants of NSFC (Grant No.U1931203,12111530009,11763002). The National Radio Astronomy Observatory is operated by Associated Universities, Inc., under cooperative agreement with the National Science Foundation. This research has made use of the CIRADA cutout service at URL http://cutouts.cirada.ca, operated by the Canadian Initiative for Radio Astronomy Data Analysis (CIRADA). CIRADA is funded by a grant from the Canada Foundation for Innovation 2017 Innovation Fund (Project 35999), as well as by the Provinces of Ontario, British Columbia, Alberta, Manitoba and Quebec, in collaboration with the National Research Council of Canada, the US National Radio Astronomy Observatory and Australia’s Commonwealth Scientific and Industrial Research Organisation.
References
- Baan, W. A. 2009, ASP Conf. Ser., 407, 73 [NASA ADS] [Google Scholar]
- Baan, W. A., & Klöckner, H. R. 2006, A&A, 449, 559 [NASA ADS] [CrossRef] [EDP Sciences] [Google Scholar]
- Baan, W. A., Rhoads, J., Fisher, K., Altschuler, D. R., & Haschick, A. 1992, ApJ, 396, L99 [Google Scholar]
- Baan, W. A., Salzer, J. J., & LeWinter, R. D. 1998, ApJ, 509, 633 [NASA ADS] [CrossRef] [Google Scholar]
- Darling, J. 2007, Proceedings of the IAU Symp., 242, 417 [NASA ADS] [CrossRef] [Google Scholar]
- Darling, J., & Giovanelli, R. 2000, AJ, 119, 3003 [NASA ADS] [CrossRef] [Google Scholar]
- Darling, J., & Giovanelli, R. 2001, AJ, 121, 1278 [Google Scholar]
- Darling, J., & Giovanelli, R. 2002a, AJ, 124, 100 [Google Scholar]
- Darling, J., & Giovanelli, R. 2002b, ApJ, 569, L87 [NASA ADS] [CrossRef] [Google Scholar]
- Darling, J., & Giovanelli, R. 2006, AJ, 132, 2596 [NASA ADS] [CrossRef] [Google Scholar]
- Emonts, B. H. C., Morganti, R., Tadhunter, C. N., et al. 2006, A&A, 454, 125 [NASA ADS] [CrossRef] [EDP Sciences] [Google Scholar]
- Evans, A. S., Kim, D. C., Mazzarella, J. M., Scoville, N. Z., & Sanders, D. B. 1999, ApJ, 521, L107 [NASA ADS] [CrossRef] [Google Scholar]
- Farrah, D., Afonso, J., Efstathiou, A., et al. 2003, MNRAS, 343, 585 [Google Scholar]
- Harvey-Smith, L., Allison, J. R., Green, J. A., et al. 2016, MNRAS, 460, 2180 [NASA ADS] [CrossRef] [Google Scholar]
- Haynes, M. P., Giovanelli, R., Kent, B. R., et al. 2018, ApJ, 861, 49 [Google Scholar]
- Hekatelyne, C., Riffel, R. A., Sales, D., et al. 2018a, MNRAS, 474, 5319 [NASA ADS] [CrossRef] [Google Scholar]
- Hekatelyne, C., Riffel, R. A., Sales, D., et al. 2018b, MNRAS, 479, 3966 [NASA ADS] [CrossRef] [Google Scholar]
- Hekatelyne, C., Riffel, R. A., Storchi-Bergmann, T., et al. 2020, MNRAS, 498, 2632 [NASA ADS] [CrossRef] [Google Scholar]
- Kandalyan, R. A. 2005a, Astrophysics, 48, 99 [NASA ADS] [CrossRef] [Google Scholar]
- Kandalyan, R. A. 2005b, Astrophysics, 48, 237 [NASA ADS] [CrossRef] [Google Scholar]
- Kim, D. C., & Sanders, D. B. 1998, ApJS, 119, 41 [NASA ADS] [CrossRef] [Google Scholar]
- Lo, K. Y. 2005, ARA&A, 43, 625 [Google Scholar]
- Lockett, P., & Elitzur, M. 2008, ApJ, 677, 985 [Google Scholar]
- McBride, J., Heiles, C., & Elitzur, M. 2013, ApJ, 774, 35 [Google Scholar]
- McBride, J., Robishaw, T., Heiles, C., Bower, G. C., & Sarma, A. P. 2015, MNRAS, 447, 1103 [NASA ADS] [CrossRef] [Google Scholar]
- McMullin, J. P., Waters, B., Schiebel, D., Young, W., & Golap, K. 2007, ASP Conf. Ser., 376, 127 [Google Scholar]
- Migenes, V., Coziol, R., Cooprider, K., et al. 2011, MNRAS, 416, 1267 [NASA ADS] [CrossRef] [Google Scholar]
- Norris, R. P., Gardner, F. F., Whiteoak, J. B., Allen, D. A., & Roche, P. F. 1989, MNRAS, 237, 673 [Google Scholar]
- Peng, H., Wu, Z., Zhang, B., et al. 2020, A&A, 638, A78 [NASA ADS] [CrossRef] [EDP Sciences] [Google Scholar]
- Pérez-Torres, M., Mattila, S., Alonso-Herrero, A., Aalto, S., & Efstathiou, A. 2021, A&ARv, 29, 2 [CrossRef] [Google Scholar]
- Pihlström, Y. M. 2007, Proceedings of the IAU Symp., 242, 446 [CrossRef] [Google Scholar]
- Pihlström, Y. M., Conway, J. E., Booth, R. S., Diamond, P. J., & Polatidis, A. G. 2001, A&A, 377, 413 [NASA ADS] [CrossRef] [EDP Sciences] [Google Scholar]
- Pihlström, Y. M., Baan, W. A., Darling, J., & Klöckner, H.-R. 2005, ApJ, 618, 705 [CrossRef] [Google Scholar]
- Roberts, H., Darling, J., & Baker, A. J. 2021, ApJ, 911, 38 [NASA ADS] [CrossRef] [Google Scholar]
- Robishaw, T., Quataert, E., & Heiles, C. 2008, ApJ, 680, 981 [NASA ADS] [CrossRef] [Google Scholar]
- Rovilos, E. 2004, Ph.D. Thesis, The University of Manchester, UK [Google Scholar]
- Rovilos, E., Diamond, P. J., Lonsdale, C. J., Lonsdale, C. J., & Smith, H. E. 2003, MNRAS, 342, 373 [NASA ADS] [CrossRef] [Google Scholar]
- Sales, D. A., Robinson, A., Axon, D. J., et al. 2015, ApJ, 799, 25 [NASA ADS] [CrossRef] [Google Scholar]
- Sales, D. A., Robinson, A., Riffel, R. A., et al. 2019, MNRAS, 486, 3350 [NASA ADS] [CrossRef] [Google Scholar]
- Shepherd, M. C. 1997, ASP Conf. Ser., 125, 77 [Google Scholar]
- Sotnikova, Y. V., Wu, Z., Mufakharov, T. V., et al. 2022, MNRAS, 510, 2495 [NASA ADS] [CrossRef] [Google Scholar]
- Staveley-Smith, L., Norris, R. P., Chapman, J. M., et al. 1992, MNRAS, 258, 725 [Google Scholar]
- Tarchi, A., Castangia, P., Henkel, C., Surcis, G., & Menten, K. M. 2011, A&A, 525, A91 [NASA ADS] [CrossRef] [EDP Sciences] [Google Scholar]
- Veilleux, S., Kim, D. C., & Sanders, D. B. 2002, ApJS, 143, 315 [NASA ADS] [CrossRef] [Google Scholar]
- Vignali, C., Brandt, W. N., Comastri, A., & Darling, J. 2005, MNRAS, 364, 99 [NASA ADS] [CrossRef] [Google Scholar]
- Walker, M. A. 1998, MNRAS, 294, 307 [CrossRef] [Google Scholar]
- Willett, K. W. 2012, IAU Symp., 287, 345 [NASA ADS] [CrossRef] [Google Scholar]
- Wu, H., Wu, Z., Sotnikova, Y., et al. 2022, A&A, 661, A125 [NASA ADS] [CrossRef] [EDP Sciences] [Google Scholar]
- Yuan, T. T., Kewley, L. J., & Sanders, D. B. 2010, ApJ, 709, 884 [NASA ADS] [CrossRef] [Google Scholar]
- Zhang, J. S., Wang, J. Z., Di, G. X., et al. 2014, A&A, 570, A110 [NASA ADS] [CrossRef] [EDP Sciences] [Google Scholar]
- Zhang, J. S., Li, D., Wang, J.-Z., Zhu, Q.-F., & Li, J. 2019, Res. Astron. Astrophys., 19, 022 [CrossRef] [Google Scholar]
Appendix A: Additional material
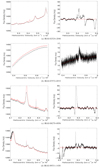 |
Fig. A.1. OH 1667 MHz line spectrum from FAST observations. Left panel: Black and red spectrum represent the target source ON and OFF spectrum, respectively. Right panel: Black and red spectrum stand for the target ON-OFF spectrum and fit baseline, respectively. |
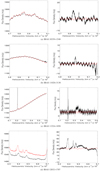 |
Fig. A.1. Continued. |
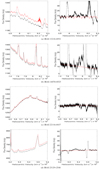 |
Fig. A.1. Continued. |
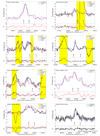 |
Fig. A.2. OH spectra use the 1667.359 MHz line as the rest frequency for the velocity scale. The lines and labels are same as shown in Fig. 1. |
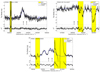 |
Fig. A.2. OH spectra use the 1667.359 MHz line as the rest frequency for the velocity scale. The lines and labels are the same as shown in Fig. 1. |
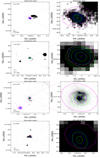 |
Fig. A.3. VLA contours overlaid on an SDSS or HST R-band gray image of OHMs. IRAS 08201: HST image with the F814W filter at 790.48 nm. IRAS 13218+0552: HST image from project 11604 with the wfc_total filter at 550 and 790.48 nm. Magenta: Contour map of the radio continuum emission from the VLASS survey. Blue: VLA-A L-band continuum emission. Green: OH line emission with velocity ranges: IRAS 01562: 49474.6-50047.6 km s−1. IRAS 02524: 54107.4-54352.1 km s−1. IRAS 08201: 49802.6-50712.8 km s−1. IRAS 08279: 62677.3-62164.7 km s−1. The redshift and physical scale that we searched from the NASA Extragalactic Database (NED(2 http://ned.ipac.caltech.edu/forms/byname.html )) for each source are presented in the left panels. |
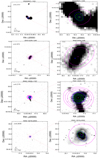 |
Fig. A.3. Continued. OH line emission with velocity ranges: IRAS 09531: 63709.4-65057.0 km s−1. IRAS 12032: 64351.9-65599.4 km s−1. IRAS 13218: 60509.1-61477.0 km s−1. |
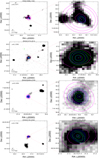 |
Fig. A.3. Continued. OH line emission with velocities ranges: IRAS 14586: 44892.7-43735.5 km s−1. IRAS 21272: 44471.3-45493.4 km s−1. IRAS 23028: 44386.7-45081.6 km s−1. IRAS 23129: 53390.3-54023.9 km s−1. |
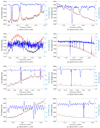 |
Fig. A.4. Detection of OH satellite lines at 1612 MHz (left) and 1720 MHz (right). The line profiles of each panel are centered at the expected frequency (green triangle) based on the optical redshift. The red and black line profiles (axis left) are the on and off spectra, respectively. The profiles in blue (axis right) are the binned on-off spectra with a velocity resolution of about 10 km s−1. |
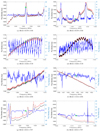 |
Fig. A.4. Continued. |
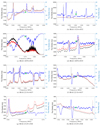 |
Fig. A.4. Continued. |
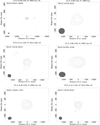 |
Fig. A.5. VLA continuum images of the OHMs at C band and X band. The image parameters including map peak, beam FWHM, and 3 σ noise level are presented in Table A.1. |
Image parameters and fitting results from VLA observations.
All Tables
All Figures
|
Fig. 1. OH spectra use the 1667.359 MHz line as the rest frequency for the velocity scale. Two arrows stand for the velocity of the 1667.359 (left) and 1665.4018 (right) MHz lines based on the optical redshift. Blue: Arecibo observations by Darling & Giovanelli (2000, 2001, 2002a), Robishaw et al. (2008). Red: VLA-A observations as listed in Table A.1. Black: FAST observations as listed in Table 2. For each figure, the top panel presents the observed OH spectra, and the bottom panel presents the ΔF = OHVLA/FAST-OHArecibo to show the variations between the two or three epoch results. Red and black stand for the spectra from VLA and FAST, respectively. The dashed lines represent the 3σ level estimated from the standard deviation of ΔF using the line-free channels. |
| In the text | |
|
Fig. 2. VLA contours overlaid on SDSS or HST R-band gray image of OHMs. Magenta: contour map of the radio continuum emission from the VLASS survey. Blue: C- or X-band contour map of the radio continuum emission. IRAS 03521: C-band at epoch 2002Jan2. IRAS 07572: C-band at 2002Jan2. IRAS 08449: 9 GHz at 2016Dec02 IRAS 11180: X-band at 2004OCT1. IRAS 21077: 9 GHz at 2014May23. The image parameters, including the map peak, beam FWHM, and 3σ noise level, are listed in Table A.1. |
| In the text | |
|
Fig. A.1. OH 1667 MHz line spectrum from FAST observations. Left panel: Black and red spectrum represent the target source ON and OFF spectrum, respectively. Right panel: Black and red spectrum stand for the target ON-OFF spectrum and fit baseline, respectively. |
| In the text | |
|
Fig. A.1. Continued. |
| In the text | |
|
Fig. A.1. Continued. |
| In the text | |
|
Fig. A.2. OH spectra use the 1667.359 MHz line as the rest frequency for the velocity scale. The lines and labels are same as shown in Fig. 1. |
| In the text | |
|
Fig. A.2. OH spectra use the 1667.359 MHz line as the rest frequency for the velocity scale. The lines and labels are the same as shown in Fig. 1. |
| In the text | |
|
Fig. A.3. VLA contours overlaid on an SDSS or HST R-band gray image of OHMs. IRAS 08201: HST image with the F814W filter at 790.48 nm. IRAS 13218+0552: HST image from project 11604 with the wfc_total filter at 550 and 790.48 nm. Magenta: Contour map of the radio continuum emission from the VLASS survey. Blue: VLA-A L-band continuum emission. Green: OH line emission with velocity ranges: IRAS 01562: 49474.6-50047.6 km s−1. IRAS 02524: 54107.4-54352.1 km s−1. IRAS 08201: 49802.6-50712.8 km s−1. IRAS 08279: 62677.3-62164.7 km s−1. The redshift and physical scale that we searched from the NASA Extragalactic Database (NED(2 http://ned.ipac.caltech.edu/forms/byname.html )) for each source are presented in the left panels. |
| In the text | |
|
Fig. A.3. Continued. OH line emission with velocity ranges: IRAS 09531: 63709.4-65057.0 km s−1. IRAS 12032: 64351.9-65599.4 km s−1. IRAS 13218: 60509.1-61477.0 km s−1. |
| In the text | |
|
Fig. A.3. Continued. OH line emission with velocities ranges: IRAS 14586: 44892.7-43735.5 km s−1. IRAS 21272: 44471.3-45493.4 km s−1. IRAS 23028: 44386.7-45081.6 km s−1. IRAS 23129: 53390.3-54023.9 km s−1. |
| In the text | |
|
Fig. A.4. Detection of OH satellite lines at 1612 MHz (left) and 1720 MHz (right). The line profiles of each panel are centered at the expected frequency (green triangle) based on the optical redshift. The red and black line profiles (axis left) are the on and off spectra, respectively. The profiles in blue (axis right) are the binned on-off spectra with a velocity resolution of about 10 km s−1. |
| In the text | |
|
Fig. A.4. Continued. |
| In the text | |
|
Fig. A.4. Continued. |
| In the text | |
|
Fig. A.5. VLA continuum images of the OHMs at C band and X band. The image parameters including map peak, beam FWHM, and 3 σ noise level are presented in Table A.1. |
| In the text | |
Current usage metrics show cumulative count of Article Views (full-text article views including HTML views, PDF and ePub downloads, according to the available data) and Abstracts Views on Vision4Press platform.
Data correspond to usage on the plateform after 2015. The current usage metrics is available 48-96 hours after online publication and is updated daily on week days.
Initial download of the metrics may take a while.