Open Access
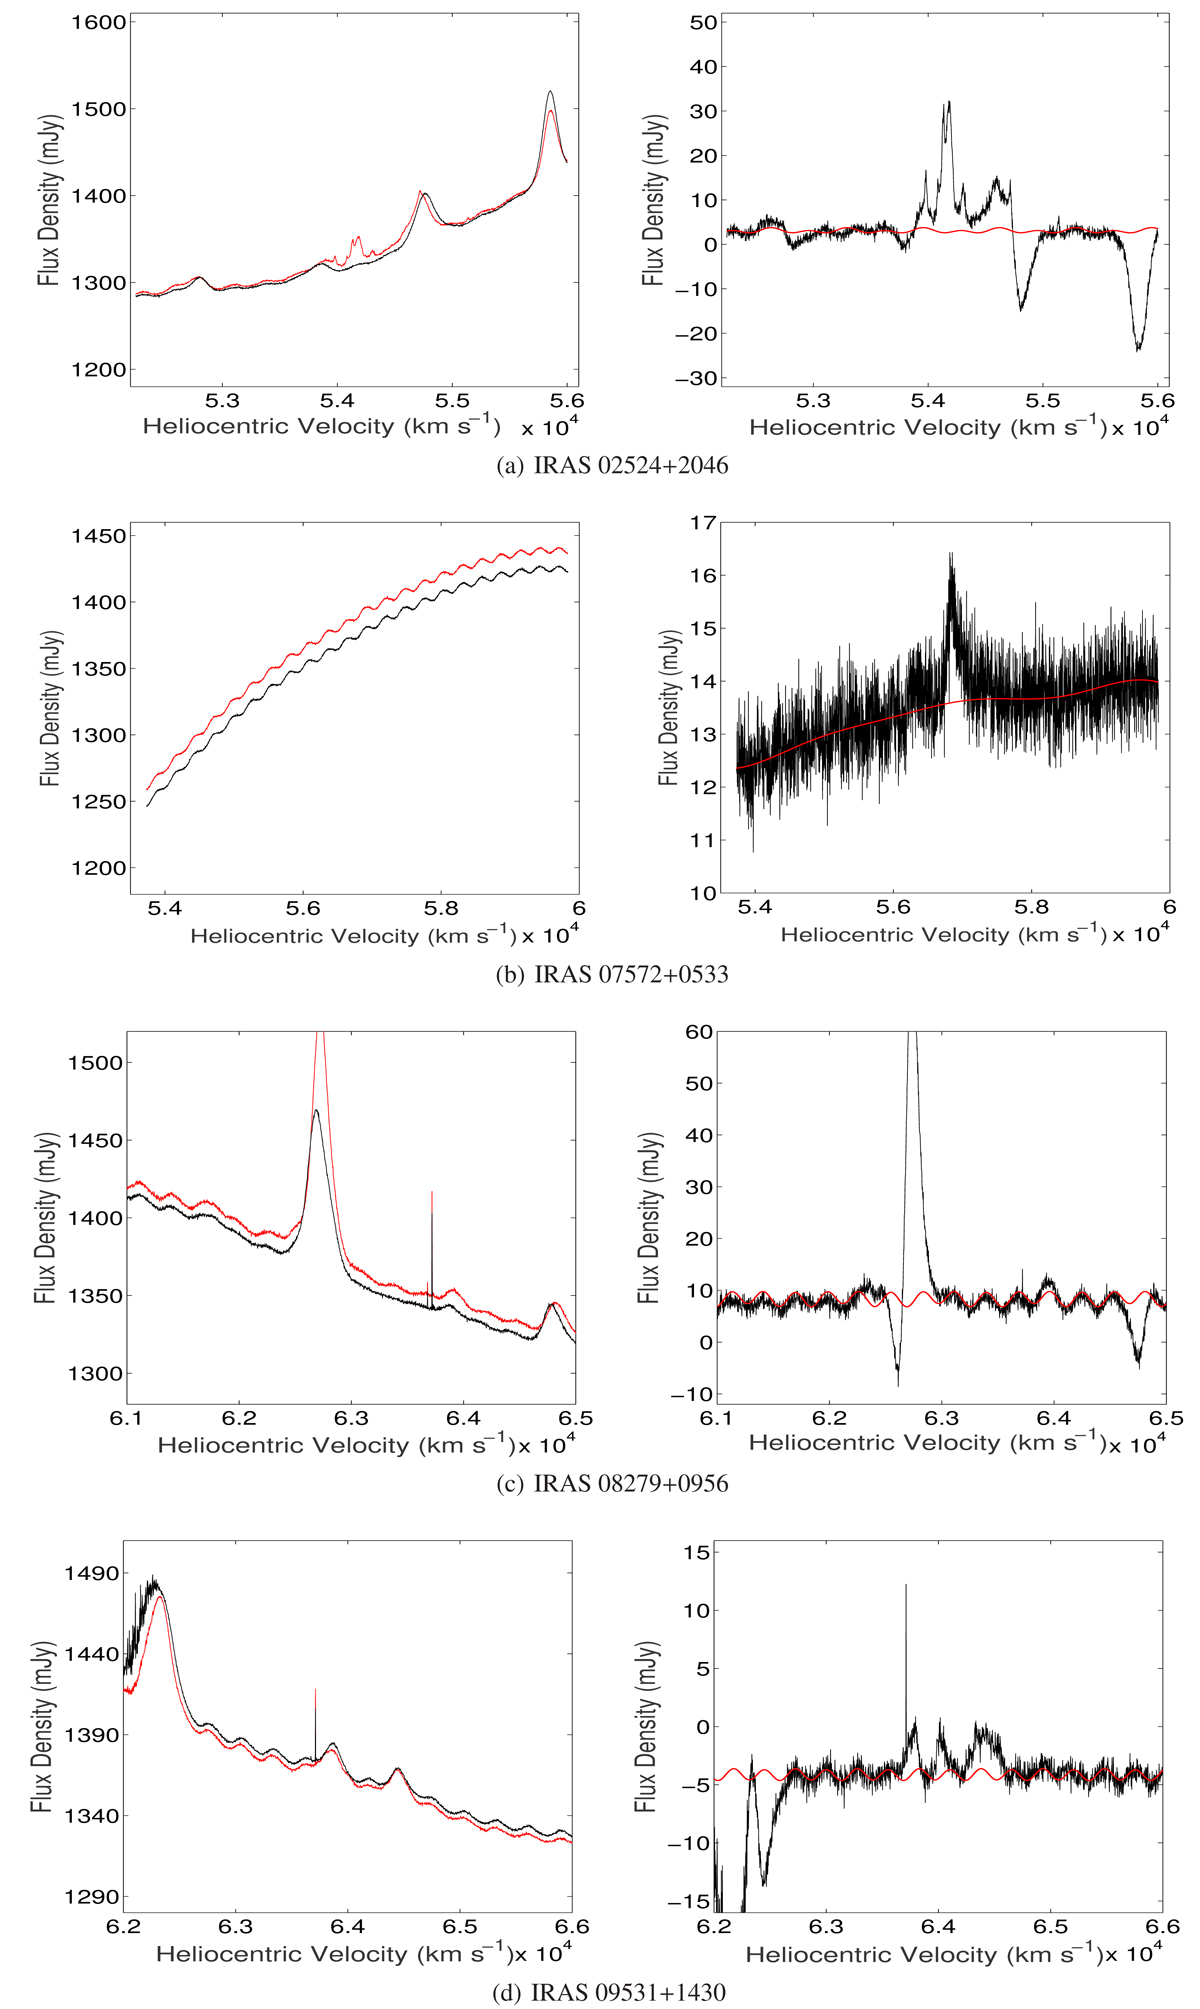
Fig. A.1.
Download original image
OH 1667 MHz line spectrum from FAST observations. Left panel: Black and red spectrum represent the target source ON and OFF spectrum, respectively. Right panel: Black and red spectrum stand for the target ON-OFF spectrum and fit baseline, respectively.
Current usage metrics show cumulative count of Article Views (full-text article views including HTML views, PDF and ePub downloads, according to the available data) and Abstracts Views on Vision4Press platform.
Data correspond to usage on the plateform after 2015. The current usage metrics is available 48-96 hours after online publication and is updated daily on week days.
Initial download of the metrics may take a while.