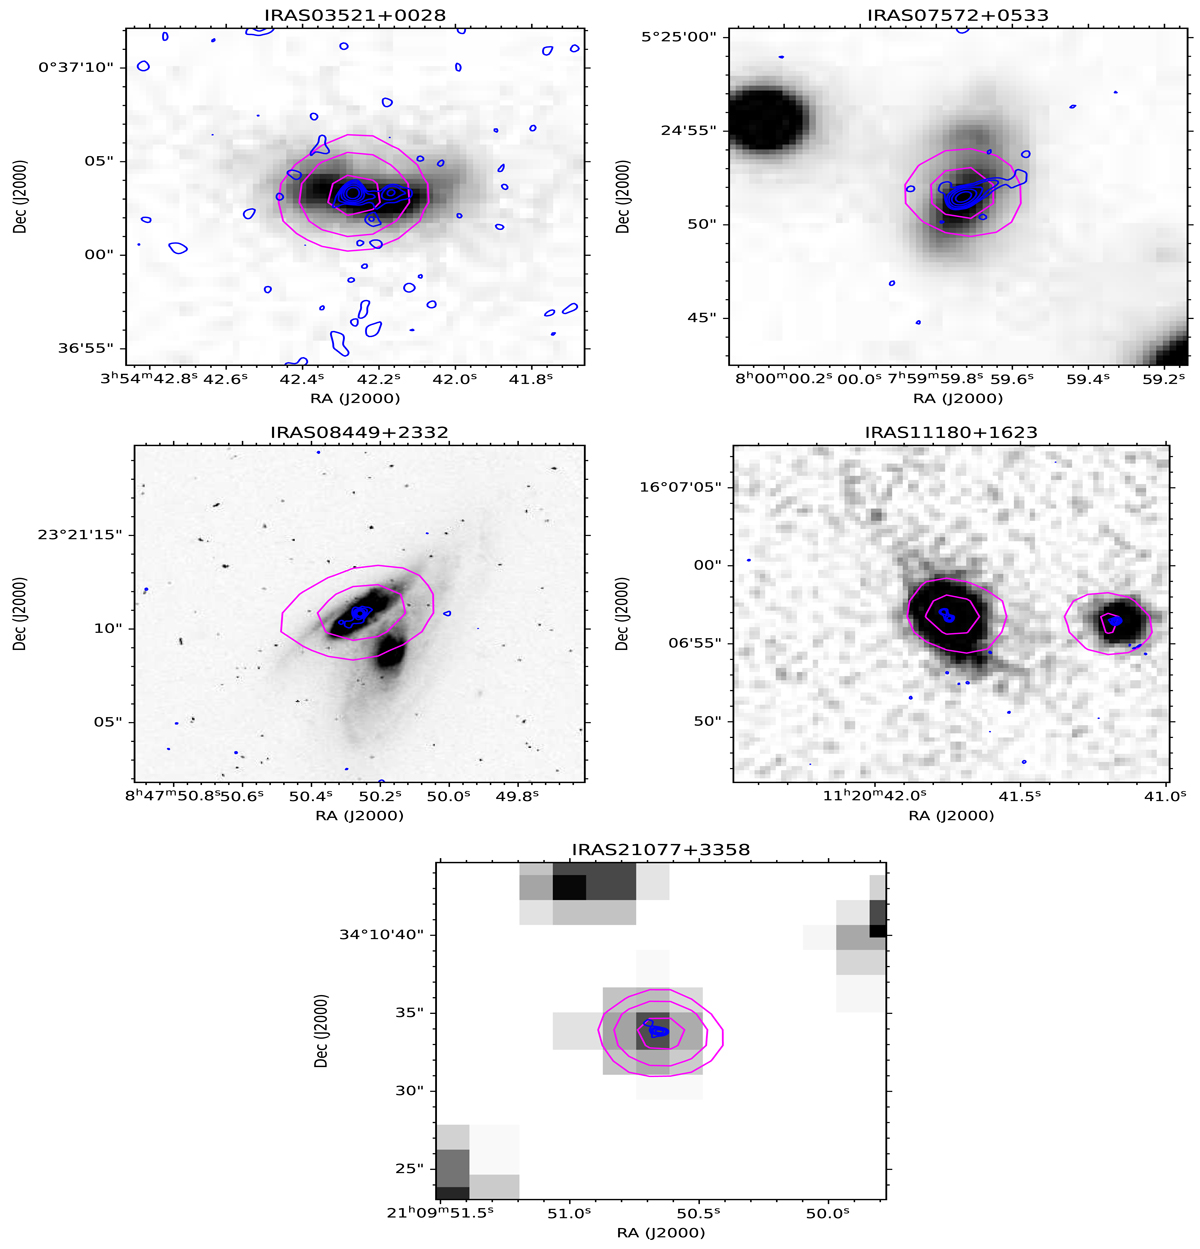
Fig. 2.

Download original image
VLA contours overlaid on SDSS or HST R-band gray image of OHMs. Magenta: contour map of the radio continuum emission from the VLASS survey. Blue: C- or X-band contour map of the radio continuum emission. IRAS 03521: C-band at epoch 2002Jan2. IRAS 07572: C-band at 2002Jan2. IRAS 08449: 9 GHz at 2016Dec02 IRAS 11180: X-band at 2004OCT1. IRAS 21077: 9 GHz at 2014May23. The image parameters, including the map peak, beam FWHM, and 3σ noise level, are listed in Table A.1.
Current usage metrics show cumulative count of Article Views (full-text article views including HTML views, PDF and ePub downloads, according to the available data) and Abstracts Views on Vision4Press platform.
Data correspond to usage on the plateform after 2015. The current usage metrics is available 48-96 hours after online publication and is updated daily on week days.
Initial download of the metrics may take a while.


