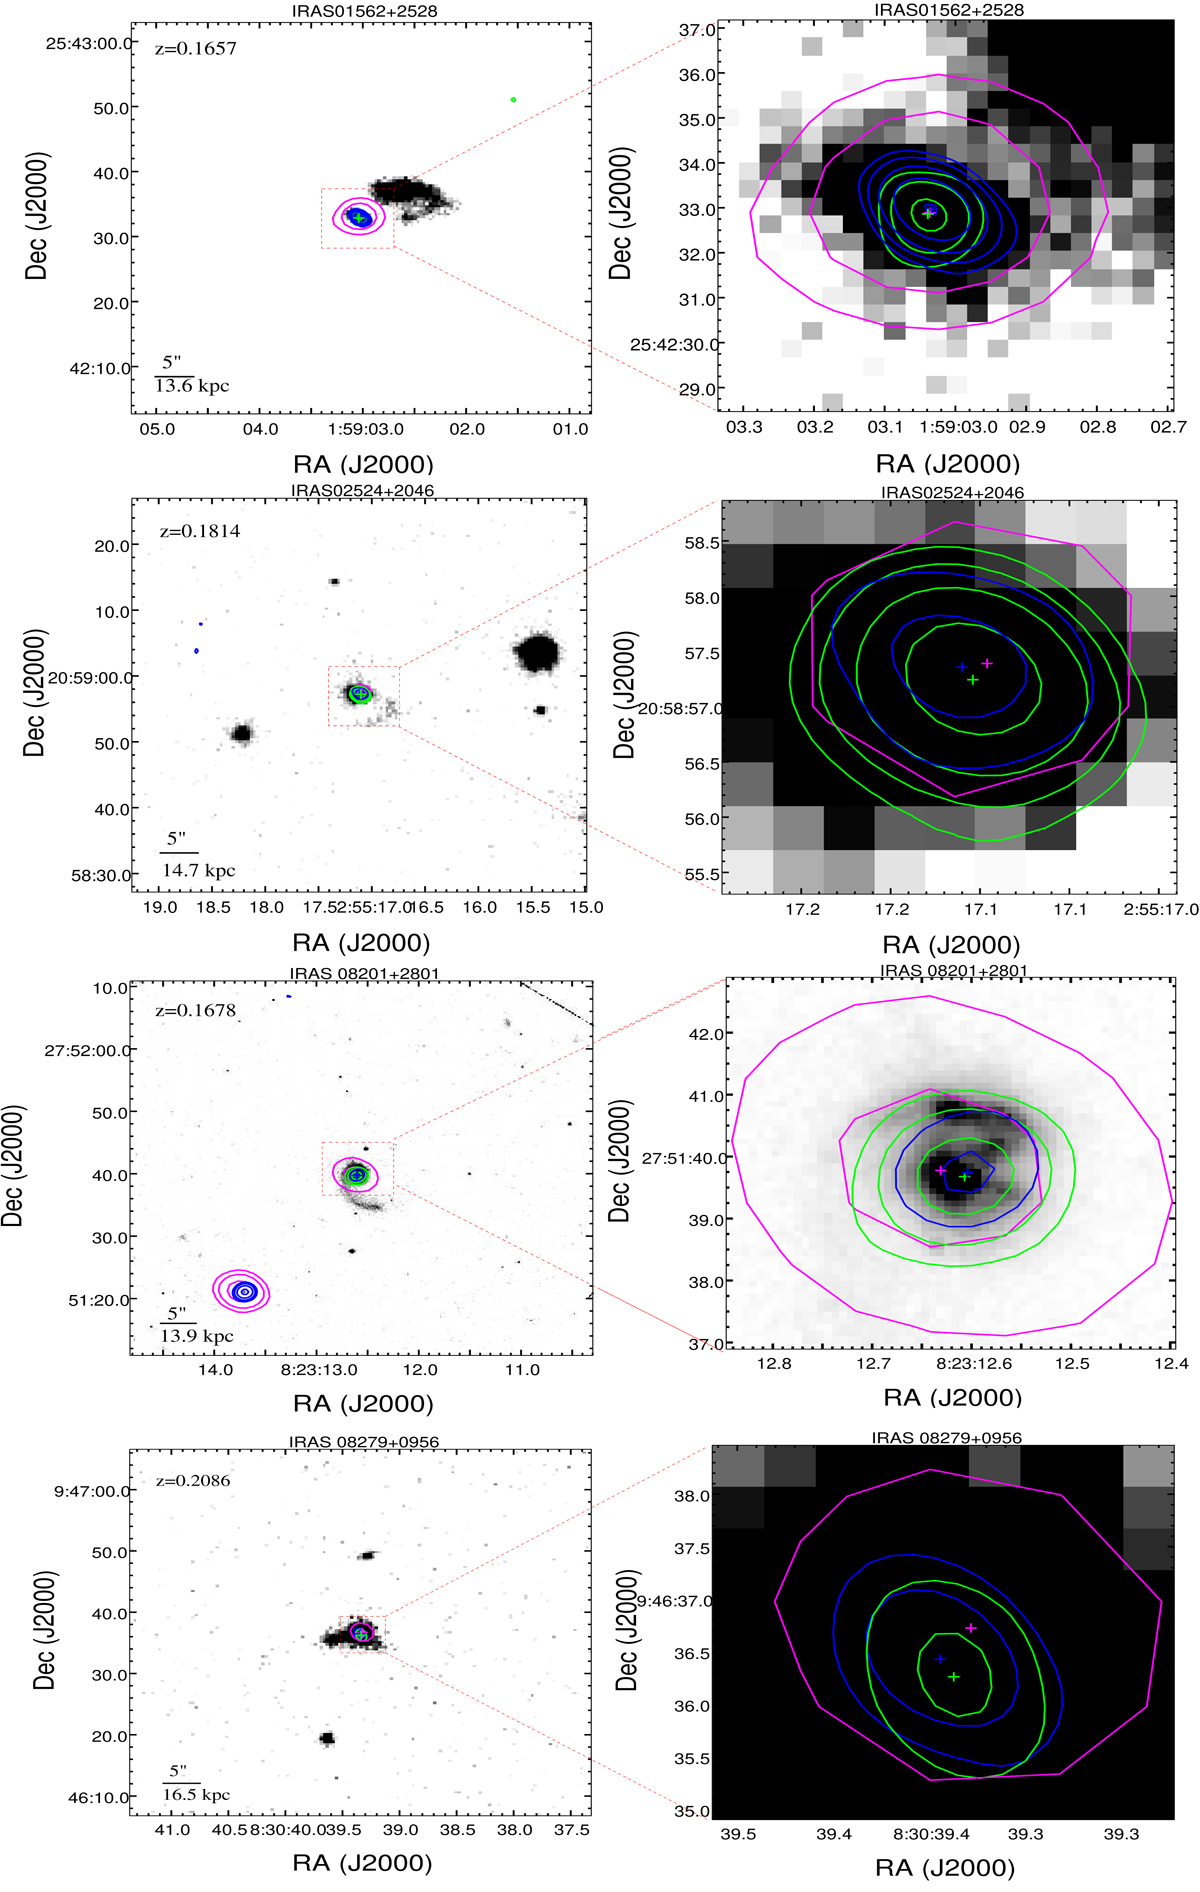
Fig. A.3.
Download original image
VLA contours overlaid on an SDSS or HST R-band gray image of OHMs. IRAS 08201: HST image with the F814W filter at 790.48 nm. IRAS 13218+0552: HST image from project 11604 with the wfc_total filter at 550 and 790.48 nm. Magenta: Contour map of the radio continuum emission from the VLASS survey. Blue: VLA-A L-band continuum emission. Green: OH line emission with velocity ranges: IRAS 01562: 49474.6-50047.6 km s−1. IRAS 02524: 54107.4-54352.1 km s−1. IRAS 08201: 49802.6-50712.8 km s−1. IRAS 08279: 62677.3-62164.7 km s−1. The redshift and physical scale that we searched from the NASA Extragalactic Database (NED(2 http://ned.ipac.caltech.edu/forms/byname.html )) for each source are presented in the left panels.
Current usage metrics show cumulative count of Article Views (full-text article views including HTML views, PDF and ePub downloads, according to the available data) and Abstracts Views on Vision4Press platform.
Data correspond to usage on the plateform after 2015. The current usage metrics is available 48-96 hours after online publication and is updated daily on week days.
Initial download of the metrics may take a while.