Fig. 1.
Download original image
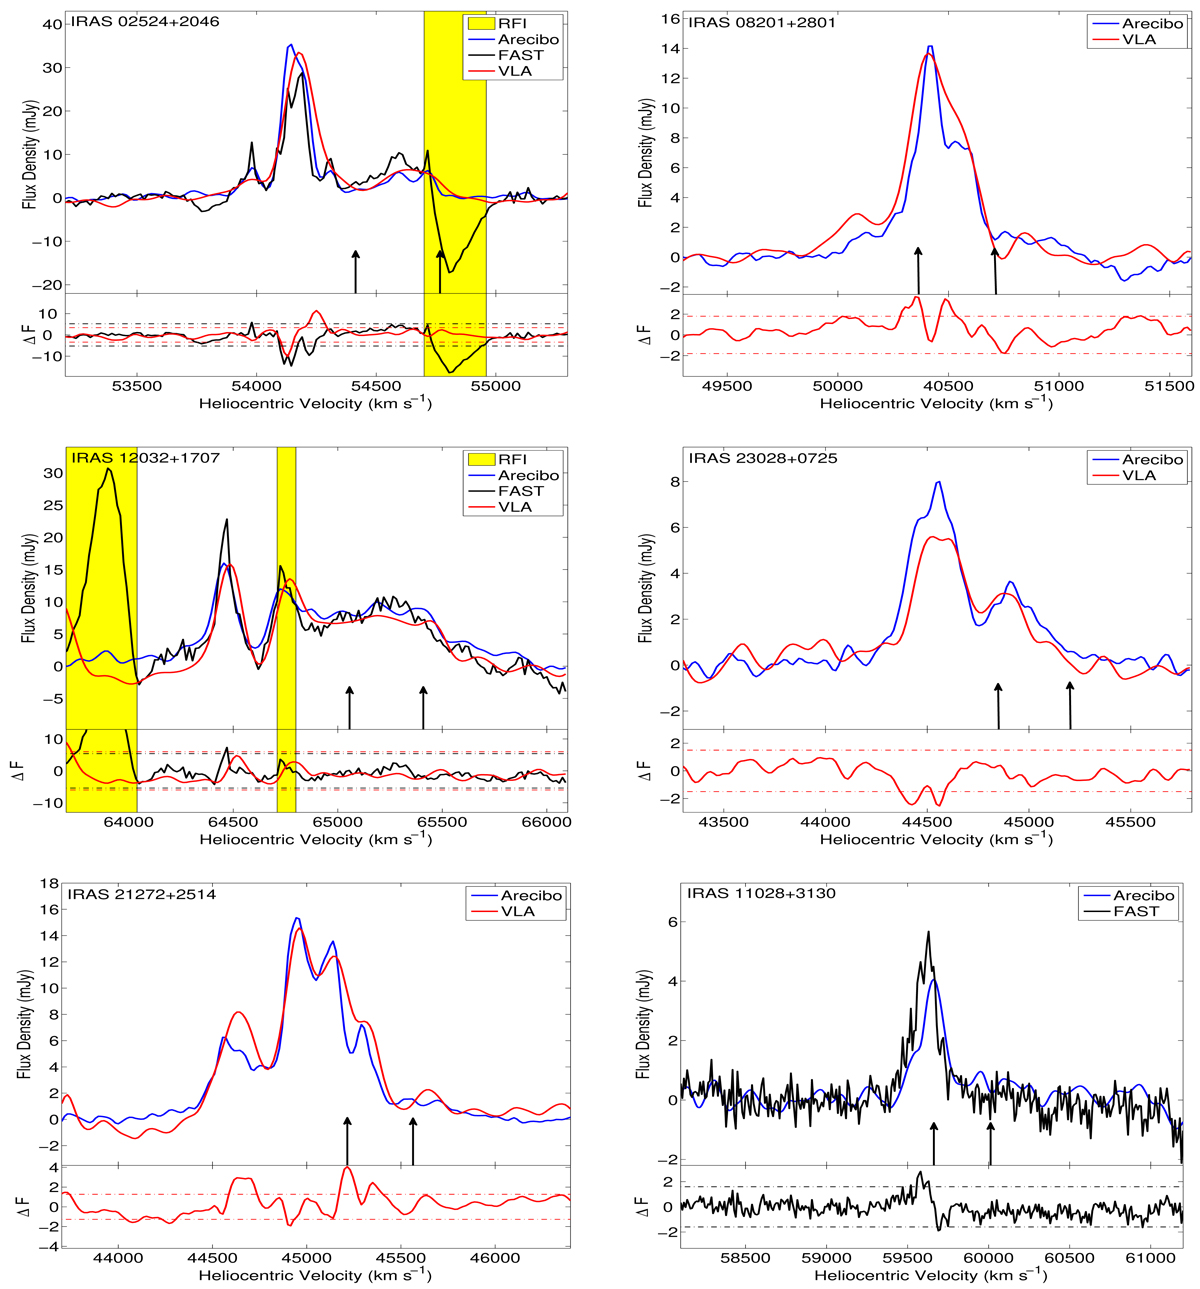
OH spectra use the 1667.359 MHz line as the rest frequency for the velocity scale. Two arrows stand for the velocity of the 1667.359 (left) and 1665.4018 (right) MHz lines based on the optical redshift. Blue: Arecibo observations by Darling & Giovanelli (2000, 2001, 2002a), Robishaw et al. (2008). Red: VLA-A observations as listed in Table A.1. Black: FAST observations as listed in Table 2. For each figure, the top panel presents the observed OH spectra, and the bottom panel presents the ΔF = OHVLA/FAST-OHArecibo to show the variations between the two or three epoch results. Red and black stand for the spectra from VLA and FAST, respectively. The dashed lines represent the 3σ level estimated from the standard deviation of ΔF using the line-free channels.
Current usage metrics show cumulative count of Article Views (full-text article views including HTML views, PDF and ePub downloads, according to the available data) and Abstracts Views on Vision4Press platform.
Data correspond to usage on the plateform after 2015. The current usage metrics is available 48-96 hours after online publication and is updated daily on week days.
Initial download of the metrics may take a while.