| Issue |
A&A
Volume 668, December 2022
|
|
|---|---|---|
| Article Number | A48 | |
| Number of page(s) | 25 | |
| Section | Stellar atmospheres | |
| DOI | https://doi.org/10.1051/0004-6361/202142072 | |
| Published online | 02 December 2022 | |
The solar photospheric silicon abundance according to CO5BOLD
Investigating line broadening, magnetic fields, and model effects
1
Zentrum für Astronomie der Universität Heidelberg,
Landessternwarte, Königstuhl 12,
69117
Heidelberg, Germany
e-mail: This email address is being protected from spambots. You need JavaScript enabled to view it.
2
Astronomical Observatory of Vilnius University,
Saulėtekio al. 3,
Vilnius
10257, Lithuania
3
Leibniz-Institut für Astrophysik Potsdam,
An der Sternwarte 16,
14482
Potsdam, Germany
4
Theoretical Astrophysics, Department of Physics and Astronomy, Uppsala University,
Box 516,
751 20
Uppsala, Sweden
5
GEPI, Observatoire de Paris, PSL Research University, CNRS,
Place Jules Janssen,
92190
Meudon, France
Received:
23
August
2021
Accepted:
1
August
2022
Abstract
Context. In this work, we present a photospheric solar silicon abundance derived using CO5BOLD model atmospheres and the LINFOR3D spectral synthesis code. Previous works have differed in their choice of a spectral line sample and model atmosphere as well as their treatment of observational material, and the solar silicon abundance has undergone a downward revision in recent years. We additionally show the effects of the chosen line sample, broadening due to velocity fields, collisional broadening, model spatial resolution, and magnetic fields.
Aims. Our main aim is to derive the photospheric solar silicon abundance using updated oscillator strengths and to mitigate model shortcomings such as over-broadening of synthetic spectra. We also aim to investigate the effects of different line samples, fitting configurations, and magnetic fields on the fitted abundance and broadening values.
Methods. CO5BOLD model atmospheres for the Sun were used in conjunction with the LINFOR3D spectral synthesis code to generate model spectra, which were then fit to observations in the Hamburg solar atlas. We took pixel-to-pixel signal correlations into account by means of a correlated noise model. The choice of line sample is crucial to determining abundances, and we present a sample of 11 carefully selected lines (from an initial choice of 39 lines) in both the optical and infrared, which has been made possible with newly determined oscillator strengths for the majority of these lines. Our final sample includes seven optical Si i lines, three infrared Si i lines, and one optical Si ii line.
Results. We derived a photospheric solar silicon abundance of log εSi = 7.57 ± 0.04, including a −0.01 dex correction from Non-Local Thermodynamic Equilibrium (NLTE) effects. Combining this with meteoritic abundances and previously determined photospheric abundances results in a metal mass fraction Z/X = 0.0220 ± 0.0020. We found a tendency of obtaining overly broad synthetic lines. We mitigated the impact of this by devising a de-broadening procedure. The over-broadening of synthetic lines does not substantially affect the abundance determined in the end. It is primarily the line selection that affects the final fitted abundance.
Key words: Sun: abundances / stars: abundances / Sun: photosphere / hydrodynamics / magnetohydrodynamics (MHD)
© S. A. Deshmukh et al. 2022
 Open Access article, published by EDP Sciences, under the terms of the Creative Commons Attribution License (https://creativecommons.org/licenses/by/4.0), which permits unrestricted use, distribution, and reproduction in any medium, provided the original work is properly cited.
This article is published in open access under the Subscribe-to-Open model. This email address is being protected from spambots. You need JavaScript enabled to view it. to support open access publication.
1 Introduction
The chemical composition of the solar photosphere serves as a widely applied yardstick in astronomy, since it is considered largely representative of the chemical make-up of the present-day Universe. The determination of solar abundances has a long history, dating back at least to the 1920s (Payne 1925; Unsold 1928; Russell 1929). Among the elements which are spectroscopically accessible in the solar photosphere, silicon plays a somewhat special role. Besides being relatively abundant, it is used as a reference to relate the solar photospheric composition to the composition of type-I carbonaceous chondrites which are believed to constitute fairly pristine samples of material from the early Solar System (e.g. Anders & Grevesse 1989; Lodders 2003; Lodders et al. 2009; Palme et al. 2014). This important aspect of the silicon abundance led to many investigations trying to establish an ever more precise and accurate solar reference value. Over the years, atomic and observational data have improved, and increasingly sophisticated modelling techniques have been applied, including time-dependent three-dimensional (3D) model atmospheres (e.g. Caffau et al. 2011; Pereira et al. 2013; Asplund 2000) and treatment of departures from thermodynamic equilibrium (NLTE) (e.g. Bergemann et al. 2019; Amarsi et al. 2019; Steffen et al. 2015).
From the above, it is tempting to conclude that the determination of the abundance of a particular element in the solar photosphere is an entirely objective process. Unfortunately, this is not the case, due to several judicious decisions a researcher must make along the way, namely: (i) which observational material to use, (ii) where to place the continuum when normalising the spectrum, (iii) which lines have accurate atomic data (meaning oscillator strengths and broadening constants), and (iv) which lines are largely unaffected by blends. These aspects influence the final outcome of an analysis, and we list some previous works’ results below to illustrate the evolution of the fitted solar silicon abundance with time. Indeed, as we shall later show, statistical uncertainties are of secondary importance here, and it is primarily the line selection that dominates the final outcome (including uncertainties). Moreover, in the present analysis process, we found that more sophisticated model atmospheres do not necessarily give a more coherent picture, since they can bring to light modelling shortcomings which were not recognised before.
Holweger (1973) determined an LTE solar silicon abundance of log εSi = 7.65 ± 0.07 based on 19 Si i lines whose oscillator strengths were measured by Garz (1973). Wedemeyer (2001) derived a 1D NLTE correction of −0.010 dex for silicon. Together with a correction of the scale of Garz by Becker et al. (1980), they arrived at a silicon abundance of log εSi = 7.550 ± 0.056. Some of the first multi-dimensional (multi-D) studies were carried out by Asplund (2000) and Holweger (2001), who arrived at log εSi = 7.51 ± 0.04 and log εSi = 7.536 ± 0.049, respectively. The statistical equilibrium of silicon and collisional processes were investigated by Shi et al. (2008), and an abundance of log εSi = 7.52 ± 0.06 was found, taking an extended line sample into account. They also specified that the NLTE effects on optical silicon lines are weak, but it was later found that near-infrared lines have sizeable NLTE effects (Shi et al. 2012; Bergemann et al. 2013). Shchukina et al. (2012) conducted an NLTE analysis of 65 Si i lines, and found log εSi = 7.549 ± 0.016. Shaltout et al. (2013) obtained a 3D LTE solar silicon abundance of log εSi = 7.53 ± 0.07 and a 1D NLTE abundance of log εSi = 7.52 ± 0.08, using the aforementioned −0.010 dex correction.
More recently, Scott et al. (2015) conducted a 3D LTE study and found an abundance as low as log εSi = 7.52 ± 0.03. The result was later corroborated by Amarsi & Asplund (2017) who derived a 3D NLTE correction of -0.01 dex to this abundance. This analysis used nine Si i lines and one Si ii line in the optical wavelength range. The final abundance was calculated by means of a weighted average. All in all, over the last 20 yr, a slight downward trend of the derived solar abundance of silicon has become apparent, but, on a level which is on the edge of being statistically significant.
In the present work, we apply CO5BOLD model atmospheres (Freytag et al. 2012) to derive the photospheric abundance of silicon in the Sun. Primarily, the motivation to do so was the availability of new data for the oscillator strengths of silicon lines (Pehlivan Rhodin 2018). This enlarged the set of silicon lines that could be potentially useful in an abundance analysis, adding oscillator strengths for near-infrared lines. Additionally, we intended to relate solar abundances so far derived with CO5BOLD models (for a summary, see Caffau et al. 2011) to the meteoritic abundance scale.
The necessary spectral synthesis calculations were performed with the LINFOR3D code1 in LTE approximation, with only a few exceptions. To compare this with observations, we developed a custom spectral fitting routine that accounts for correlated photometric noise in the observations. Our analysis stands out by using a sizeable number of lines with carefully calculated line broadening constants, new oscillator strengths, and investigating systematic shortcomings of our 3D model atmosphere. The last point became important since we found that our model was predicting systematically overly broadened lines, seen also in Caffau et al. (2015) for oxygen lines.
The rest of the paper is structured as follows: Sect. 2 discusses the details of the model atmospheres used in this study, the methodology of line selection, and spectral synthesis. It also touches on the role of magnetic field effects pertaining to these topics. Section 3 describes the fitting routine and the implemented correlated noise model. Our results, and the differences due to model choice, are shown in Sect. 4, discussed in Sect. 5, and summarised in Sect. 6. Finally, the appendices explain model atmosphere differences in abundance and broadening (Appendix A), differences in regard to NLTE (Appendix B), the choice of the broadening kernel (Appendix C), the centre-to-limb variation of the continuum (Appendix D), and the partition functions used in LINFOR3D (Appendix E) in further detail.
2 Stellar atmospheres and spectral synthesis
2.1 Model atmospheres
Systematic errors from spectral synthesis and fitting come from the use of 1D hydrostatic model atmospheres, and the assumption of LTE when it is not valid to do so. 1D hydrostatic model atmospheres rely on mixing-length theory (Böhm-Vitense 1958; Henyey et al. 1965), and introduce additional free parameters such as micro- and macro-turbulence (Gray 2008). Spectral lines generated from these model atmospheres are too narrow to fit observations, if they do not take macroscopic broadening into account, necessitating the use of free parameters to fit observations. 3D model atmospheres, on the other hand, should in principle be able to reproduce line shapes, shifts and asymmetries, and spectral lines synthesised with these can be directly fit to observations.
The prominent state-of-the-art radiative-convective equilibrium 1D models of solar and stellar atmospheres such as ATLAS (Kurucz 2005), MARCS (Gustafsson 1975; Gustafsson et al. 2008) and PHOENIX (Allard & Hauschildt 1995; Allard et al. 2001) use classical mixing-length theory, and the efficiency of convective energy transport here is controlled by a free parameter αMLT. This, along with the requirement of fitting the micro- and macro-turbulence free parameters during line synthesis, is a major drawback of 1D models.
3D atmospheres account for the time-dependence and multi-dimensionality of the flow, and a spectral synthesis using these atmospheres reproduces line shapes and asymmetries. Prominent examples include STAGGER (Magic et al. 2013), MuRAM (Vogler et al. 2005), Bifrost (Gudiksen et al. 2011), and Antares (Leitner et al. 2017). In this work, we use CO5BOLD, a conservative hydrodynamics solver able to model surface convection, waves, shocks and other phenomena in stellar objects (Freytag et al. 2012). As 3D atmospheres are understandably expensive to run, their output can be saved as a sequence where flow properties are recorded, commonly called a sequence of ‘snapshots’. These snapshots are then used in spectral synthesis codes, such as LINFOR3D (used in this study) or MULTI3D (Leenaarts & Carlsson 2009). The parameters of the CO5BOLD model atmospheres used in this work are summarised in Table 1. We use 20 model snapshots to compute line syntheses with LINFOR3D. Throughout this work, the ‘Model ID’ (see Table 1) for each model will be used to refer to it.
The msc600, m595, b000 and b200 models all use a short characteristics scheme with double Gauss-Radau quadrature and 3 µ-angles. The n59 model uses a long characteristics Feautrier scheme with Lobatto quadrature and 4+1 µ-angles. In the current version of CO5BOLD the former scheme is given the name “MSCrad” and the latter is given the name “LCFrad” (Freytag et al. 2012; Steffen 2017).
3D model properties.
2.2 Line sample
Silicon is an interesting element as it is an important electron donor in late-type stars. Though it seems that Si I’s ionisation potential of 8.15 eV would mean a significant amount of silicon to be present in the form of Si ii, the higher ionisation potential of Si ii is unfavourable for the appearance of strong lines in the solar spectrum at wavelengths longer than 3000 Å (Moore 1970; Russell 1929). We therefore primarily consider Si i lines and two carefully chosen Si ii lines.
The Si i and ii line list below (Table 2) was compiled from the line lists used in the solar abundance determination by Holweger (2001), Wedemeyer (2001), Shi et al. (2008), and Amarsi & Asplund (2017). The initial line selection was performed by synthesising line profiles and comparing to observations, thus checking these for blends.
We solely used the observational data by Neckel & Labs (1984; hereafter the ‘Hamburg spectrum’) and have worked with the disc-centre and disc-integrated spectrum. Doerr et al. (2016) show the resolution of the Hamburg spectrum to be up to 520 000 compared to the often-used Liege spectrum (Delbouille et al. 1973), which practically was shown to have a resolution of ~216000. The higher spectral resolution allows for a more continuous representation of the pixel-to-pixel variations in the spectrum, and we utilise a noise model that represents the covariance between pixels. Additionally, the Liege spectrum covers a range of 3000–10 000 Å, while the Hamburg spectrum covers a range of 3290–12510 Å, affording us access to very clean near-infrared lines. Furthermore, it remains unclear whether the Liege spectrum is a true disk-centre spectrum or an integral over a narrow range of angles around disk-centre, and the available documentation does not precisely establish this.
From the original 39 lines, we chose a subset of 11 based on comparisons between disk-centre and disk-integrated spectra, the line shape and the precision of oscillator strength. We focus on lines that do not have strong line blends that can interfere with abundance determination. Each line was weighted on a scale of 1 3 based on these criteria, and the resulting weights were used to compute the mean abundance. This idea of a weighted mean was inspired by the work of Amarsi & Asplund (2017).
There are various sources of error that can enter during the spectroscopic fitting, but the choice of oscillator strength for each spectral line is often the largest one. We use semiempirical gf-values from Pehlivan Rhodin (2018) (hereafter also PR18) for every line in our chosen sub-sample, which have been updated with respect to previous experimental values measured by Garz (1973) with accurate lifetime renormalisations by O’Brian & Lawler (1991a,b) (hereafter also G73+OBL91). The gf-values from PR18 were obtained by combininb calculated level lifetimes with experimental branching ratios. Moreover, the calculations were validated against existing measurements of level lifetimes and oscillator strengths. An advantage of the PR18 data is the homogeneity of the extensive set of line transitions, ranging from UV to infrared wavelengths. On average across all lines in Table 2, the new values give a ∆ log gf = 0.024 decrease with respect to the previous measurements, and lead to a respective increase of the mean abundance by the same value when using all lines. Using the new values of the oscillator strengths lowers the overall scatter in fitted abundance values by 0.07 dex and the formal uncertainty by 0.01 dex.
We investigated the overall performance of the PR18 gf-values on the set of lines used in Scott et al. (2015) and Amarsi & Asplund (2017). Figure 1 depicts the resulting Si abundances. The use of the PR18 data reduces the overall scatter in the Si abundances from 0.036 dex (applying the data of G73+OBL91) to 0.018 dex. In all cases, there is no discernible dependence on line strength or excitation potential. The only Si ii line at 6371 Å that we consider sufficiently reliable for abundance analysis may indicate a slight ionisation imbalance. However, this imbalance is of similar magnitude for both sets of oscillator strengths. Moreover, the line has a high excitation potential and is partially blended so that the apparent imbalance could be the result of systematics in the analysis.
In previous studies, strong infrared Si i lines above 10 000 Å often lacked reliable experimental oscillator strengths (Borrero et al. 2003; Shi et al. 2008; Shchukina et al. 2012). Shi et al. (2012) investigate near-infrared lines in nearby stars with both LTE and NLTE, and find that there is a larger departure from LTE for the infrared lines than optical ones. They point out that weak lines are insensitive to NLTE effects, whereas stronger lines show visible effects. The new oscillator strengths also afford us the use of near-infrared lines in our sample. These lines are not as affected by blends as the optical lines (Shi et al. 2008), but some show strong NLTE cores. We do not include these lines to determine a final abundance. During fitting, we clip points that are more than 0.5% of relative (normalised) flux further from the observations after an initial fit, removing weak line blends and deviating line cores from the abundance determination.
Atomic data for spectral lines of Si i and Si ii.
2.3 Spectral synthesis
In this study, a 3D hydrodynamical solar model atmosphere with an initial silicon abundance of log εSi = 7.55 was used for the line synthesis. Each line is synthesised with the LINFOR3D code over 20 atmospheric snapshots. The lines are synthesised in full 3D, including Doppler shifts, and the profile is averaged in time and space (horizontally). We generate a set of syntheses for each spectral line, each with a different log gfε⊙ value. We alter log gf in this case, with a distinct stepping around a central value for each line depending on the sensitivity of the lines to oscillator strength changes.
Our investigation of the solar silicon abundance is mostly 3D LTE, but the −0.01 dex correction due to NLTE effects determined by Amarsi & Asplund (2017) was used globally for our calculated abundance. We investigate NLTE effects on broadening and abundance in Appendix B.
 |
Fig. 1 Individual fitted Si abundances for a set of eight Si i lines and one Si ii line as a function of equivalent width (left) and excitation potential (right) for eight Si i lines and one Si ii line. Only the Si i lines are used to determine the mean and RMSE (see definition in Eq. (8)), given in the legend in the left panel. G73+OBL91 indicates oscillator strengths from Garz (1973) normalised according to the results of O’Brian & Lawler (1991a); the oscillator strength for the Si ii line for comparison was taken from Kurucz (2014); PR18 indicates oscillator strengths from Pehlivan Rhodin (2018). |
2.4 Line broadening
Aside from the abundance, we also aim to investigate the effects of broadening required to fit synthetic spectra to observations. The broadening we see in the observed lines can be attributed to broadening by macroscopic velocity fields, thermal broadening, and atomic line broadening due to collisions with neutral particles and electrons. For broadening due to macroscopic velocity fields, though a tendency towards less turbulent flow is expected in numerical models due to limited spatial resolution, our 3D syntheses are broader than the observations, even prior to applying instrumental profile broadening. The result is not unique to our work (see, e.g. Caffau et al. 2015), nor is it unique to CO5BOLD models (see Appendix A for details).
2.4.1 Collisional broadening
Solar spectral lines are subject to broadening from atomic effects. These are pressure broadening effects arising from van der Waals and other interatomic forces. It turns out that the 7680 Å line shows sizeable Stark broadening, meaning the Stark effect is non-negligible for some solar silicon lines and illustrating the importance of accurately modelling these effects. We use the theory by Anstee, Barklem and O’Mara (Anstee & O’Mara 1991, 1995; Barklem et al. 1998b) to describe the line broadening effects of neutral particles, predominantly neutral hydrogen (hereafter ABO theory). Note that the broadening constants were specifically calculated using existing tables from the above papers or through extended calculations, and are shown in Table 2. LINFOR3D additionally takes the Stark broadening of lines into account, employing line widths from from the Vienna Atomic Line Database (VALD) (Kupka et al. 1999, 2000; Ryabchikova et al. 2015) and assuming temperature dependence from the Unsöld theory (Unsold 1955).
The theory of collisional line broadening for neutral species (Anstee & O’Mara 1991, 1995) was extended to singly ionised atoms in Barklem & O’Mara (1998a). For the lines corresponding to ionised Si in this study, we performed specific calculations assuming Ep = −4/9 atomic units (the average value of the energy denominator of the second-order contribution to the interaction energy), which is expected to give reasonable estimates, though this assumption is less secure for ions than for neutrals (see Roederer & Barklem 2018; Barklem & Aspelund-Johansson 2005). Eq. (1) of Anstee & O’Mara (1995) describes the line broadening cross section σ (in atomic units) as a function of the relative collision velocity v, with respect to a reference value of v0 = 104 m s−1, with the parameter α giving the power law velocity dependence:
 (1)
(1)
The line width at a given temperature can then be obtained from this relation by analytic integration over the Maxwellian velocity distribution (see Eq. (3) of Anstee & O’Mara 1995).
2.4.2 Rotational broadening
For disk-integrated spectra, we consider fixed solid body rotation assuming a synodic v sin i = 1.8 km s−1 is present in the observations from the Hamburg spectrum (Bartels 1934; Gray 2008). In total, 1 vertical 16 inclined rays were used (4 µ-angles and 4 ϕ-angles) with Lobatto quadrature (Abramowitz & Stegun 1965). Rotational broadening is not included for disk-centre spectra.
2.5 Magnetic fields
2.5.1 Effects on model atmospheres
It is known that weak magnetic fields are present in the solar surface layers and there is evidence that the mean magnetic flux density for these is of the order of 102 G (Bueno et al. 2004; Nordlund et al. 2009). Numerical 3D convection models predict that the granulation pattern is profoundly affected in regions with high flux density (Cattaneo et al. 2003; Vögler et al. 2005; Cheung et al. 2008), in agreement with observations. Additionally, photospheric material becomes more transparent in magnetic concentrations due to their lower density, allowing one to see into deeper, hence hotter, layers of the solar atmosphere (Stein & Nordlund 2000). In these regions, where flux tubes are also heated through heat influx from the surrounding material (Spruit 1976), weak spectral lines will experience a brightening of their core, meaning magnetic fields can act on temperature-sensitive lines not only directly through the Zeeman effect, but also indirectly due to temperature stratification in line-forming regions (Fabbian et al. 2012).
2.5.2 Effects on spectral synthesis
In 1D model atmospheres, Borrero (2008) showed that magnetic fields have non-negligible effects on spectral line synthesis, and Fabbian et al. (2010) expanded this to 3D atmospheres, finding an abundance correction for Fe of the order of ~ + 0.01 dex when using magneto-convection models. Fabbian et al. (2012) used 28 iron lines and found the average solar iron abundance to be ~0.03–0.11 dex higher when using a magneto-convection model with 〈Bvert〉 = 200 G and investigated models with average magnetic flux densities of (〈Bvert〉 = 0, 50, 100, 200 G. They also showed that Zeeman broadening gains importance in the infrared, and that the largest contribution to higher abundance is the indirect effect of line-weakening caused by a warmer stratification as seen on an optical depth scale.
Following this, Fabbian & Moreno-Insertis (2015) were able to reproduce the observations of 2 O i spectral lines with blends with the use of a 3D MHD photospheric model with a uniform vertical magnetic field of 200 G. They required an oxygen abundance several centidexes higher than those suggested by Asplund et al. (2009) to fit observations and again showed the need to consider magneto-convection processes when considering problems sensitive to the shape of spectral features, such as spectral synthesis and fitting.
As shown in Table 1, we use two magnetic model atmospheres to investigate the effects of the magnetic field strength on the fitted abundance and broadening values. Zeeman broadening is not taken into account in the spectral synthesis. Note that Shchukina et al. (2015, 2016) also show that such vertical fields as in Fabbian et al. (2012) overestimate the effects when compared with a 3D MHD model with a self-consistent small-scale dynamo and more realistic magnetic fields. With this in mind, and with the fact that the magnetic models used here are not of a high enough resolution to quantitatively investigate the effects of magnetic fields, we consider only differential effects. Section 4 shows these differences and concludes that the extra broadening present in the msc600 model syntheses could be partly attributed to the lack of magnetic fields.
3 Spectral fitting routine
The synthesised lines are fitted to the observations from the Hamburg spectrum via χ2 minimisation, where we define χ2 as
 (2)
(2)
where ∆x is the vector of residuals and C is the covariance matrix of the data. We use maximum likelihood estimation using χ2 rather than the conventional least-squares minimisation in order to incorporate the errors due to covariance in the spectrum.
In this analysis, we fit disk-centre intensities for abundance determination, but disk-integrated spectra are also used when choosing the line sample. To mask weak blends, a window is chosen around each line for the fitting procedure. An example is shown in Fig. 2.
The routine involves first loading the observations and determining the covariance between pixels for a given line (see Sect. 3.2 for details). Then, during the fitting, instrumental profile broadening and rotational broadening (for disk-integrated spectra) are applied to the syntheses. A monotonic cubic interpolation across abundance is used to find the closest synthesis matching the observations, now also fitting the wavelength shift, to create an array of syntheses. Finally, for the nine abundances in steps of 0.05 dex that were synthesised, the abundance is fit by interpolating through the array of syntheses and constructing a spectrum from the overall best fitting points. Sigma-clipping is employed to improve subsequent fits. The tight window is necessary with our particular combination of syntheses and observations to minimise the effects that weak line blends have on fitting.
Some infrared lines exhibited strong NLTE cores, and we do not include these lines in our final sample used to determine abundance. However, we did attempt to fit these lines by masking the core and fitting the line up to 70% residual intensity, inspired by the work of Shi et al. (2008). Their work revolves around accurately treating NLTE effects, and we noticed that infrared lines shown in this work could be fit in LTE up to this 70% intensity. In the end, clipping points at the 0.5% level was more versatile and useful than simply masking the line cores. This choice of 0.5% eliminates stronger offending blends while still retaining important characteristics in the line profile. We fitted some infrared lines with strong NLTE cores with this method, but ultimately chose to leave them out of the subsample used to derive an abundance since they require excess negative broadening (see Sect. 3.1) to fit, which could be indicative of smaller NLTE effects present in the fitted parts of the line profile.
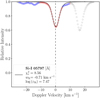 |
Fig. 2 Synthesised fitted line profile (black line) against the observations from the Hamburg atlas (points). Grey points were cut from the initial fit; blue points show areas where the deviation between initial fit and data is too high, and so the subsequent fits do not use the offending points; red points are used for computing all fitted quantities. Removing the points on right hand side removes the strong blend, and sigma-clipping handles weaker ones during fitting. wK is the width of the broadening kernel used. Note that this line is not used in the final determination of the silicon abundance because of the large line blends. |
3.1 Profile (de)broadening
In the present investigation, we found that in many cases the synthetic line profiles were already broader than the observations, even prior to the application of instrumental broadening. Such a problem is specific to spectral synthesis calculations based on 3D model atmospheres (Caffau et al. 2015), as broadening effects of the stellar velocity field in 1D hydrostatic models are added in an ad-hoc fashion via fitting micro- and macro-turbulent broadening to the observations. Hence, mismatches of the overall broadening between model and observations cannot occur.
In our case, we could either broaden the observations or de-broaden the syntheses. Unsurprisingly, broadening the observations a priori by 2.5 km s−1 (the value that allowed our syntheses to fit the observations well) resulted in better statistical fits, as the lines appeared more Gaussian-like. However, this removes information about the line, such as weak blends and the overall shape. Instead, we chose to implement the capability to de-broaden our syntheses, rendering them narrower to better fit the observations as opposed to broadening observations instead. This is stated as equivalent to a negative broadening, or broadening with a kernel that has a negative full width at halfmaximum (FWHM). We hoped to maintain the ability of 3D line profiles that allows one to identify weak blends that can degrade fits without being immediately recognised. This provides us a fully invertible method when it comes to fitting the broadening value of syntheses. Note that the broadening value we fit is still much smaller than the values of micro- and macro-turbulence fitted in 1D models, and our 3D model still reproduces line shapes and asymmetries.
We formally associate broadening with convolution, and de-broadening (negative broadening) as deconvolution and use a kernel inspired by Dorfi & Drury (1987). This kernel is composed of a double exponential decay centred on zero (see Appendix C for details of the implementation), and is referred to throughout this work as the Gn kernel, where n is an integer representing the ‘order’ of the kernel. We can convolve the G1 kernel (Eq. (3)) with itself to produce more Gaussian-like kernels, but note that this brings back the noise amplification that we aimed to mitigate with the use of the G1 kernel:
 (3)
(3)
Here, x is position (in velocity space) and α controls the width of the kernel.
Gaussian and sinc functions were both considered as instrumental profile broadening kernels, but these do not allow for efficient and optimal computation of a de-broadened profile, since as the Fourier transform of these kernel functions rapidly goes to zero precluding a deconvolution, small disturbances cause large spikes in the wings of debroadened spectra. Across all lines (and across the downsample), the choice between the G1 and G3 kernels does not affect the fitted abundance. The G1 kernel does result in slightly better statistical fits, and so we favour it in this study.
3.2 Photometric noise model
Often, the pixel-to-pixel correlation of the signal in the spectrum is ignored, despite being rather commonly present due to instrumental imperfections during detection as well as steps during data reduction. The Hamburg atlas was rebinned at steps of 3.8 mÅ. This rebinning introduced a correlation between pixels. We implement a photometric noise model that considers the relation between neighbouring pixels in the observations, whose correlated signal introduces correlation in the noise values in each pixel (given by the root mean-squared error (RMSE) of a window). In order to model this, we require a representation of the covariance matrix of the noise. This covariance matrix, or correlated noise matrix, can then be applied to the set of observations in the fitting routine to describe the pixel-to-pixel correlation of the noise in the spectrum. Due to the nature of the covariance matrix, it must be positive semi-definite. To accurately estimate the matrix of correlated noise, we fit the autocorrelation function of continuum regions of the spectrum with an exponential decay.
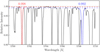 |
Fig. 3 Comparison of two silicon line profiles while locally fitting the continuum. Observations are shown in black and the fitted syntheses at 5701.11 and 5708.40 Å are shown in red and blue, respectively, along with the fitted continuum value. Across a wider wavelength range, the various fitted continua are not consistent with one another. |
4 Results
4.1 Line syntheses
The spectral line syntheses for the chosen 11 lines are shown in Fig. 4. The lines are synthesised with the non-magnetic msc600 model atmosphere and use the G1 broadening kernel during fitting. We also use a covariance matrix for pixel-correlated noise, which results in an increase in mean abundance of 0.001 dex compared to assuming uncorrelated noise. Our final derived photospheric solar silicon abundance is log εSi = 7.57 ± 0.04, including the −0.01 dex correction from NLTE effects (Amarsi & Asplund 2017).
We find that simultaneously fitting the continuum for the entire selection of spectral lines systematically lowers the abundance by 0.01 dex. A local fit of the continuum is therefore not representative of the spectrum on a larger scale, and we rely on the normalisation provided by the Hamburg atlas. This comparison is shown for two lines in Fig. 3. Broadening the observations a priori by 2.5 km s−1 (to counter the overly broadened syntheses) increases the abundance across all configurations by 0.02 dex as this convolves weak line blends into the primary line shape, rendering the observations more Gaussian-like and removing information (such as the observational line shape) in the process.
4.2 Magnetic field effects
Figure 5 shows the difference in abundance and broadening fitted when comparing different magnetic model atmospheres: one without a magnetic field and one with a magnetic field of 200 G (b200).
The fitted results of the magnetic models should not be used on an absolute scale, as the model atmosphere grids are too coarse to resolve the detailed structure of small magnetic flux concentrations. Additionally, as the effective temperatures of these models are further from the nominal Teff = 5772 K (Prša et al. 2016), we apply a correction to each line’s fitted abundance to account for this change in temperature. The correction was derived from the snapshot-to-snapshot variation of Teff and equivalent width. The highest correction, for the b000 model, was +0.015 dex for the Si ii lines, while the Si i lines averaged a −0.005 dex correction. Si i and Si ii lines show opposite trends in each model. The models are used for differential comparison, noting that increasing the magnetic field strength increases both the fitted abundance and broadening values. A possible implication is that the over-broadening of synthesised lines is caused by a lack of magnetic fields in the model atmosphere, as magnetic field lines constrain the flow of material in the solar atmosphere, reducing turbulence and thereby the line broadening. Figure 6 illustrates this point for all 4 models alongside 2 models with much higher and lower effective temperatures. Though the b200 model has a higher effective temperature than the other solar-type models, its still has a lower vertical RMS velocity. Comparing to the t63g45mm00 model at 6233 K, the increase in effective temperature in the b200 model to overcome the magnetic field effects would need to be much greater than the current model’s value.
Additionally, a magnetic field strength of 200 G still does not give the full amount of de-broadening required to fit the observations and is higher than the value of up to 75 G expected in the majority of the quiet photosphere (Ramírez Vélez et al. 2008). Again, as shown by Shchukina et al. (2015) & Shchukina et al. (2016), a vertical field of 200 G would overestimate the effects when compared with a self-consistent 3D MHD model with a small-scale dynamo. The syntheses do not include the 1 km s−1 instrumental broadening, meaning the nominal wK ≈ 1 km s−1 – hence even further de-broadening from magnetic fields would be required. Therefore, our results are suggestive but not definitive that the lack of magnetic fields contributes to the over-broadening of spectral lines, and the high magnetic field strengths required to produce the required broadening would not be consistent with 3D MHD models with small-scale dynamos.
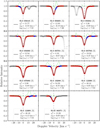 |
Fig. 4 Synthesised fitted line shapes (black solid line) against observations from the Hamburg spectrum (points) for 11 silicon lines for the msc600 model. Grey points were removed before fitting, blue points show areas where sigma-clipping was employed to remove poorly fitting points, and red points were used for determining final fitted quantities. Green lines show the residuals increased by a factor of 10 for readability. In each panel, the name of the line, the reduced χ2 value, the width of the broadening kernel wK, and the LTE abundance log εSi are shown. The final weighted mean abundance of 7.57 ± 0.04 includes the −0.01 dex NLTE correction, a fixed continuum, no pre-broadening, and de-broadening. |
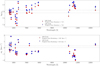 |
Fig. 5 Comparison of abundance and broadening between the b000 (red points), and b200 (blue points) models. The red and blue horizontal dashed lines follow the same colour scheme and show the weighted average values. Triangles indicate the lines used in the subsample. Increasing the magnetic field strength increases fitted abundance and decreases negative broadening. |
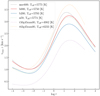 |
Fig. 6 Vertical RMS velocity profiles in and around line-forming regions for the b000, b200 models (solid lines) with the msc600, n59, and 2 other models at much lower and higher effective temperatures shown for comparison (dotted lines). The b200 model clearly has lower RMS velocity than the other solar-type models, even though its effective temperature is higher. |
4.3 Effects of model differences
The models presented in this work have different spatial resolutions and utilise different radiation transport (RT) schemes. As a comparison, Fig. 7 shows the difference between the fitted abundance and broadening values in the msc600, m595 and n59 models. We find that using the coarser models predicts a slightly higher abundance, and the lines are not synthesised as broad as when using the finer msc600 model, which is shown in Fig. 8. This is in line with the reduced level of turbulence in the n59 model due to its lower resolution. The n59 model also has a significantly higher extra viscosity relative to the msc600 model, and utilises a long characteristic RT scheme while the msc600 model uses a newer, multiple short characteristic scheme. The m595 model has the same parameters as msc600, except the spatial resolution, which is that of n59. Its fitted broadening lies between n59 and msc600, but is closer to the latter model. This suggests that, rather than the spatial resolution, it is the RT scheme and viscosity parameters that primarily affect the line broadening; though the spatial resolution does have a small effect. All models use the same opacity table and equation of state. With the chosen line sample, generally positive broadening is required for the n59 model; however, when considering all lines, the majority still require negative broadening to fit the observations.
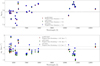 |
Fig. 7 Comparison of abundance and broadening between the msc600 (red points), m595 (green points) and n59 (blue points) models. Triangles indicate the lines used in the subsample. The red, green and blue horizontal dashed lines follow the same colour scheme and show the weighted average values. |
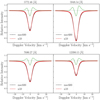 |
Fig. 8 Line profiles from msc600 (black) and n59 (red) models with the residuals magnified by a factor of 10 in green. The difference in the line profiles is greatest in the line core. |
4.4 Disk-centre and disk-integrated spectrum differences
Comparisons between disk-centre and disk-integrated spectra for the msc600 model are shown in Fig. 9. Disk-integrated spectra show a 0.01 dex higher abundance on average, and a broadening 0.03 km s−1 more negative than the disk-centre spectra across the full sample of 39 lines. The correspondence between disk-centre and disk-integrated fitted abundance and broadening is hence quite satisfactory. The infrared lines not chosen in the sub-sample show higher deviation than most optical lines, perhaps due to NLTE core effects that are more prominent in the disk-integrated spectrum. Additionally, the largest deviation is given by the Si ii 6347.10 Å line, which is not used in the subsample because of this large deviation. The other Si ii at 6371.36 Å line is used in the subsample and shows a large uncertainty in the fitted abundance.
The fitted abundance and broadening values for the disk-centre and disk-integrated syntheses, as well as the old and new oscillator strengths used in this study are given in Table 3. Only the disk-centre spectra and new gf-values are used for determining the final abundance.
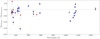 |
Fig. 9 Differences between disk-centre and disk-integrated fitted abundances for the msc600 model. Red triangles indicate the lines in the subsample used for the final abundance calculation. |
4.5 Comparisons with meteoritic abundances
Type-I carbonaceous chondrites (CI chondrites) constitute a special class of meteorites. Their chemical composition of refractory elements is believed to reflect the composition of the early solar system (e.g., Lodders et al. 2009). Conventionally, meteoritic abundances are given relative to silicon on the so-called cosmochemical scale, here for an element X written as
 (4)
(4)
where nX denotes the number density per volume of element X. In this paper, we gave abundances on the astronomical scale defined by
 (5)
(5)
With these definitions we have2 lgµSi = 6, and lgεH = 12. Conversion from the abundance of an element X from the astronomical to the cosmochemical scale reads
 (6)
(6)
which necessitates the knowledge of the silicon abundance on the astronomical scale. Equation (6) shows that an increase of the silicon abundance – as found in this work in comparison to earlier results – leads to a corresponding decrease of an abundance given on the cosmochemical scale. Since the abundance on the cosmochemical scale involves two abundances on the astronomical scale the conversion generally leads to an increase of the resulting uncertainty for an abundance – assuming that there are no significant correlations among the individual input uncertainties. Dealing with a ratio of two metal abundances here has the advantage that settling effects over the lifetime of the Sun should cancel out to first order (Lodders et al. 2009), and we can directly compare to the corresponding meteoritic ratios. In Fig. 10, we compare these abundance ratios on the cosmochemical scale in ascending order of the 50% condensation temperatures of the elements. All condensation temperatures are from Palme et al. (2014) and meteoritic abundances are taken from Lodders (2021, her Table 3, present solar system). We use the solar photospheric abundances of non-volatile elements based on CO5BOLD models presented in Caffau et al. (2011). The uncertainties indicated in Fig. 10 are dominated by the uncertainties of the spectroscopically determined photospheric abundances. The uncertainty of the silicon abundance noticeably contributes here. The error bars are perhaps over-estimated since some compensatory effects due to error correlations might be present. With the exception of hafnium (a well-known problem case) meteoritic and photospheric abundances are consistent with each other on the 1σ level. However, for being able to identify possible differences a reduction of the uncertainties appears desirable.
4.6 Mass fractions of hydrogen, helium, and metals
In this section, we calculate the mass fractions of hydrogen X, helium Y, and metals Z which are of particular interest for stellar structure. Our intention is not so much to provide the absolute numbers but rather to demonstrate the involved uncertainties. Serenelli et al. (2016) and Vinyoles et al. (2017) both advocate the use of meteoritic abundances for elements heavier than C, N, O in the Sun. We follow this idea, and augment the 12 photospheric abundances from Caffau et al. (2011) (Li, C, N, O, P, S, K, Fe, Eu, Os, Hf, Th) and the newly derived silicon abundance by the meteoritic abundances given by Lodders (2021). To this end, we need to bring photospheric and meteoritic abundances onto the same scale. For relating the abundances we use the abundance of silicon only. Using Eq. (5) we obtain
 (7)
(7)
where diamonds (◊) indicate meteoritic values, the Sun symbol (⊙) solar photospheric values. The basic assumption underlying Eq. (7) is that  , that is to say, silicon is not subject to differentiation effects, neither in the solar photosphere, nor in the meteorites.
Equation (7) shows that in the conversion of the meteoritic abundances we have to take into account the uncertainties of the individual species including the silicon abundance as measured in meteorites. The normalisation puts the meteoritic silicon abundance on a value of 106, however, with an uncertainty of 3.4 %. The uncertainty of the solar silicon abundance contributes to the meteoritic uncertainties in the conversion to the astronomical scale. An input neither directly obtained from meteorites nor from photospheric spectroscopy is the helium abundance. Here, we assume a ratio  as given by Lodders (2021) for the present Sun which is motivated from helioseismic measurements. With these ingredients and atomic weights assumed to be precisely known we ran Monte-Carlo error propagations and obtained X = 0.7382 ± 0.0084, Y = 0.2456 ± 0.0086, Z = 0.0162 ± 0.0015, and Z/X = 0.0220 ± 0.0020 (independent of the abundance of helium). The uncertainties of X and Y are dominated by the uncertainty of the helium abundance. In order to further quantify the uncertainties of Z we present the build-up of the overall uncertainty of Z by sequentially adding sources of uncertainty. We obtain the sequence σZ = (65, 77, 79, 148) × 10−5 when adding the uncertainties of the meteoritic abundances, of the photospheric abundance of silicon, of all photospheric abundances except CNO, and of all contributions including from CNO, respectively.
This perhaps odd-appearing procedure is motivated by the fact that the individual sources of uncertainty are not simply additive (rather additive in quadrature), and there is some coupling emergent from the presence of the photospheric silicon abundance in the conversion given by Eq. (7). Keeping this limitation in mind, we see that the contribution to the overall uncertainty by the meteorites is not insignificant, and noticeably increased by the uncertainty of the photospheric silicon abundance. We emphasise that the “meteoritic” abundances include the noble gases (particularly neon). Their assumed values are coming from measurements other than those in meteorites. The photospheric abundances other than of CNO contribute little to the overall uncertainty, the most important contribution stems – perhaps unsurprisingly – from CNO. We conclude that the procedure of using the average of several refractory elements (e.g., Lodders et al. 2009) is a good way to reduce the overall uncertainty on the mass fraction of metals. The precision to which the CNO elements are measured in the solar photosphere is most important. Beyond that, any reduction of the uncertainty of photospheric or meteoritic abundances is helpful.
Fitted 3D LTE abundance and broadening values for disk-centre (DC) and disk-integrated (DI) spectra with their formal statistical uncertainties.
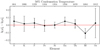 |
Fig. 10 Elemental abundance differences between CI chondrites ( |


5 Discussion
5.1 Comparisons between models and line samples
Both the choice of model atmosphere and the line sample affect the final abundance (and the level of broadening or debroadening required). Across all configurations, prior broadening of the observations increases the fitted abundance. Moreover, there is a spread of fitted abundances for even a single model based on the chosen line sample and fitting method. Overall, it is the combination of more or less judicious decisions taken during the fitting process that ultimately determines the final fitted abundance value.
5.2 Comparisons with previous works
Our derived abundance of 7.57 ± 0.04 is 0.06 dex higher than the abundance recently presented in Asplund et al. (2021). As a comparison to their work, we calculated a mean abundance using the line sample they presented (leaving out the 6741.61 Å line) alongside their weights, and find an abundance of 7.55 ± 0.02, which is 0.04 dex higher than that presented in their work. Part of the difference in fitted abundance stems from the new oscillator strength data used; when using the same oscillator strength data, we find an abundance of 7.54 ± 0.03. This is consistent with the average difference of the oscillator strength data used for these lines. The equivalent widths obtained by our line profile fitting for all models are higher than those given in Amarsi & Asplund (2017), and are shown in Table 4. The corresponding differences in abundance are shown in Fig. 11. Altogether, the dominant difference comes from the new oscillator strength data (0.04 dex) and equivalent widths (0.02 dex), while line selection, weighting and 3D model are of secondary importance (0.01 dex).
Equivalent widths for the four models presented in this study alongside those given in Amarsi & Asplund (2017) (AA17).
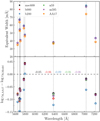 |
Fig. 11 Differences in equivalent width (top) and fitted abundance (bottom) in comparison to the values in Amarsi & Asplund (2017). The numbers in the bottom panel give the mean abundance difference using the weighting scheme of Amarsi & Asplund (2017). The difference in abundance includes all sources, not just the difference in equivalent width. |
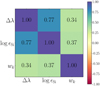 |
Fig. 12 Correlation coefficient between fitted parameters for the msc600 model. Δλ is the wavelength shift, log εSi is the abundance and wK is the width of the broadening kernel. |
5.3 Uncertainties
We use the root-mean-squared error (RMSE) of the selected sample to capture the final uncertainty on the fitted abundance. This uncertainty represents the uncertainties through the entire fitting procedure, including uncertainties in oscillator strengths as well as statistical uncertainties. The RMSE is given by
 (8)
(8)
where  is the weighted mean abundance, yi is the weighted abundance calculated for a single line, L is the number of lines used to determine the weighted mean and N is the sum of the weights. We chose this estimator since each line yields a different fitted abundance, and the RMSE naturally incorporates this scatter. Additionally, since we compute the RMSE on the final fitted abundances, the uncertainties in fitting and in the oscillator strengths are already represented in the scatter. On average, the oscillator strength uncertainty is 8.57%, which is compatible with our RMSE uncertainty in abundance. For other fitted quantities, we use the statistical uncertainties from the fitting procedure and other relevant sources of error, such as uncertainties in ABO theory parameters for broadening.
Despite careful line selection, new oscillator strength values and an improved broadening theory, there is still a substantial scatter in individual fitted abundance values. The scatter is included in the uncertainties by means of the RMSE. The (maximum – minimum) scatter in abundance values is 0.15 dex for our main configuration, with an RMSE of 0.04. Using the line list of Amarsi & Asplund (2017) decreases the scatter to 0.06 dex and the RMSE to 0.02. Again, this shows that the choice of lines to use has a non-negligible impact on the final derived abundance.
We make use of the ‘mpfitcovar” routine (Markwardt 2009) which takes in the spectrum and correlated noise model and fits the free parameters of our routine (normally abundance, broadening and wavelength shift). We use χ2 statistics to find the best fitting parameter as well as the errors on those parameters. There is some correlation between the quantities themselves, shown in Fig. 12 for the msc600 model.
6 Conclusions
We have presented a 3D LTE analysis of 39 silicon lines using CO5BOLD model atmospheres and the LINFOR3D spectral synthesis code. Of these, a total of 11 were selected for the abundance analysis, comprising of 7 optical Si i lines, 3 near-infrared Si i lines and 1 Si ii line. New oscillator strengths from Pehlivan Rhodin (2018) were used, enabling the use of infrared lines alongside optical ones and providing smaller uncertainties for oscillator strengths. Compared to the previous experimental strengths from Garz (1973), the new log(gf) values and weighting scheme decrease the formal statistical uncertainty across the relevant lines from 0.07 dex to 0.04 dex. An improved broadening theory also helped to constrain statistical uncertainties further.
Our main conclusions are as follows:
We find a photospheric solar silicon abundance of log εSi = 7.57 + 0.04, including the −0.01 dex correction from NLTE effects investigated in Amarsi & Asplund (2017). The 0.06 dex increase with respect to the recent studies by Asplund et al. (2021), Amarsi & Asplund (2017) suggests that the determination of the solar silicon abundance is not yet a firmly solved problem. Our advocated configuration uses the G1 broadening kernel, the higher resolution msc600 model and our chosen subsample of lines.
Several factors affect the fitted abundance and broadening, but the line selection plays the primary role. We focus on lines that are devoid of major blends, have updated oscillator strengths, and also where syntheses match well with observed line shapes. Notably, the near-infrared lines give higher abundances than optical lines on average.
The over-broadened line syntheses we see in this work are not specific to the CO5BOLD atmospheres. Comparisons were made with STAGGER + BALDER (see Appendix A for details), and we are able to refit their abundances and broadening values using both the msc600 and n59 models. Broadeningwise, their syntheses lie between the msc600 and n59 models described here. Additionally, the overly broadened line syntheses are caused by the combination of various effects, including velocity fields, atomic broadening and neglect of magnetic field effects – we did not find a single definite cause for over-broadening.
Using a magnetic model with a magnetic field strength of 200 G increases the fitted abundance and reduces the Doppler broadening when compared to the same model with a magnetic field strength of 0 G. These differential results could point towards over-broadened syntheses resulting from a lack of consideration of magnetic field effects, particularly that strong magnetic fields impede turbulent flow in the atmosphere (Cattaneo et al. 2003), resulting in narrower lines. However, the vertical magnetic fields that would be required to offset the negative broadening are much too large to be consistent with 3D MHD models with small-scale dynamos (Shchukina et al. 2015, 2016), meaning magnetic field effects likely do not play a major role in the overbroadening of the line syntheses.
The atomic broadening cross-sections for the silicon lines presented in this work are remarkably large, which subsequently increases the effect of collisional broadening. Alongside the effects of magnetic fields, the collisional broadening may then also contribute to the over-broadening in the line syntheses.
Meteoritic abundances when transformed onto the astronomical scale are increased with respect to the previous study by Palme et al. (2014) due to the increase in our photospheric silicon abundance. The differences of the non-volatile elements available from CO5BOLD-based analyses are – except for hafnium – consistent with zero, however, with significant uncertainties. Serenelli et al. (2016) and Vinyoles et al. (2017) both advocate the use of meteoritic abundances for elements heavier than C, N, O in the Sun, but using only the silicon abundance for the conversion between cosmochemi-cal and astronomical scale (e.g., Asplund et al. 2005) would give a 0.05 dex increase for non-volatile metals. The sizeable uncertainty of the silicon abundance found in this study lets the use of multiple elements for referencing meteoritic and photospheric abundances appear attractive, such as done in Lodders et al. (2009).
A local fit of the continuum level is clearly at odds when looking at the spectrum on a large scale. Performing such a fit results in an artificial lowering of the equivalent width, and systematically lowers the abundance by 0.01 dex.
We find no strong evidence of NLTE effects severely affecting abundance calculations in optical lines and the chosen infrared lines beyond the –0.01 dex correction included, though the negative broadening required could be indicative of minor NLTE effects being present. Appendix B explains the observed NLTE effects in 1D in more detail.
An NLTE solar silicon abundance of 7.57 ± 0.04 could improve the differences for solar neutrino fluxes, sound speed profiles and the surface helium fraction. Vinyoles et al. (2017) show that a solar model with the composition proposed in Grevesse & Sauval (1998) statistically performs better in regard to the solar sound speed profile than a model with a solar composition proposed in (Asplund et al. 2009). The former composition uses log εSi = 7.56 ± 0.01, while the latter uses log εSi = 7.51 ± 0.01. Serenelli et al. (2016) show that the silicon abundance of log εSi = 7.82 from von Steiger & Zurbuchen (2016) gives worse fits overall for solar neutrino fluxes, sound speed profiles, and the surface helium fraction, so a silicon abundance of 7.57 ± 0.04, closer to the abundance derived from the Grevesse & Sauval (1998) composition, clearly results in an improvement relative to (Asplund et al. 2009).
All in all, our analysis suggests that the photospheric solar Si abundance is not yet a definitively solved problem. The use of state-of-the-art 3D model atmospheres and an improved broadening theory is essentially a requirement to accurately reproduce line shapes. Even with these improvements, our synthetic line profiles were generally overbroadened with respect to the observations, and it is unlikely that this feature is unique to CO5BOLD model atmospheres or to Si lines.
Acknowledgements
S.A.D. and H.G.L. acknowledge financial support by the Deutsche Forschungsgemeinschaft (DFG, German Research Foundation) – Project-ID 138713538 – SFB 881 (“The Milky Way System”, subproject A04). A.K. acknowledges support of the “ChETEC” COST Action (CA16117) and from the European Union’s Horizon 2020 research and innovation programme under grant agreement no. 101008324 (ChETEC-INFRA). P.S.B. acknowledges support from the Swedish Research Council through individual project grants with contract nos. 2016-03765 and 2020-03404. This work has made use of the VALD database, operated at Uppsala University, the Institute of Astronomy RAS in Moscow, and the University of Vienna. The authors are grateful for the assistance of A.M. Amarsi in this work, especially for comparing differences in model atmospheres, to L. Mashonkina for a discussion on NLTE effects, and to H. Hartman for providing assistance related to the new oscillator strengths.
Appendix A Comparisons between linfor3d/cO5bold and balder/stagger
There was motivation to investigate whether the extra broadening present in the syntheses produced by LINF0R3D using the CO5BOLD model atmospheres was unique to these codes. To test this, we compared six LTE Si i line syntheses using our models against those produced by BALDER (Amarsi et al. 2018), a custom version of Multi3D (Leenaarts & Carlsson 2009) (data provided by A. Amarsi, priv. comm.). These data were calculated on a 3D hydrodynamic STAGGER model solar atmosphere (Collet et al. 2011). These lines were: 5690, 5780, 5793, 6244, 6976 and 7680 Å.
We use the same log gf values, ABO parameters and central wavelengths for the lines in both sets of syntheses. After fitting for the abundance (logεSi = 7.51 was assumed in the BALDER syntheses), the results are near-identical, and the fits shown in Figs. A.1 & A.3 using the n59 and 600 models are excellent. We are able to refit the abundance and broadening of the BALDER syntheses. The black points represent the BALDER synthesis, and the red lines are the LINF0R3D syntheses after fitting the lines synthesised with BALDER.
Fitted broadening values for six lines chosen as a comparison to STAGGER.
Two CO5BOLD model atmospheres were used for the analysis. The msc600 solar model is a newer model that has a higher spatial resolution and larger box size than the older n59 model (see Table 1 for details). The n59 model requires positive broadening to fit the BALDER syntheses, while the msc600 requires negative broadening. Broadening-wise, then, the BALDER syntheses lie somewhere between our two chosen models - they are broader than the n59 model, but not as broad as the msc600 model. Table A.l shows the broadening values required by our models to reproduce the STAGGER syntheses and the observations from the Hamburg atlas. While the n59 model is less broad than the Stagger model in all cases and the msc600 model is broader, both of these models still generally require negative broadening to fit a majority of the lines. Again, no instrumental broadening (typically ~1 km s−1 FWHM) was applied to the synthetic spectra, as should be possible without the presence of over-broadening. This shows the issue of the syntheses being over-broadened is not unique to CO5BOLD + LINFOR3D but is also present in the syntheses produced by BALDER + STAGGER.
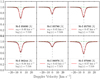 |
Fig. A.1 LINFOR3D + CO5BOLD n59 model syntheses (red lines) fit to BALDER + STAGGER (black points). Green lines show residuals increased by a factor of 10. The mean abundance as derived by the CO5BOLD fit is 7.52 ± 0.01. |
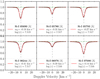 |
Fig. A.2 LINFOR3D + CO5BOLD m595 model model syntheses (red lines) fit to BALDER + STAGGER (black points). Green lines show residuals increased by a factor of 10. The mean abundance as derived by the CO5BOLD fit is 7.52 ± 0.01. |
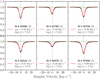 |
Fig. A.3 LINFOR3D + CO5BOLD msc600 model model syntheses (red lines) fit to BALDER + STAGGER (black points). Green lines show residuals increased by a factor of 10. The mean abundance as derived by the CO5BOLD fit is 7.51 ± 0.01. |
Appendix B 1D LTE versus NLTE comparisons in linfOr3d
Following the comparison between model atmospheres and spectral synthesis routines, four lines were synthesised in both 1D LTE and 1D NLTE as an additional investigation into the potential extra broadening seen in LINF0R3D. These lines were 5772.46, 5948.54, 7680.27 and 12288.15 Å. We fit the 1D NLTE line profiles with the 1D LTE syntheses for nine different abundance values to investigate whether the consequent fitted broadening is strongly affected. The abundance corrections generally remain within the prescribed −0.01 dex; the 12288.28 A requires slightly higher corrections at higher abundances. The employed model atom is the same as that in Wedemeyer (2001) with 115 energy levels for Si i and Si ii with 84 transitions. Moreover, the collisional cross-sections for neutral particles follow Drawin (1967) and Steenbock & Holweger (1984) using a correction factor of SH = 0.1. Fig. B.1 shows the fitted broadening at each abundance point for each line, and Fig. B.2 shows the LTE versus NLTE line profiles. In this small sample, NLTE effects become stronger with increasing abundance resulting in stronger negative broadening for the 5772.46 Å, 5948.54 Å and 12288.15 Å lines, and less positive broadening for the 7680.27 Å line. It should be noted that the trends are reversed if we fit NLTE to LTE profiles, i.e. lines that showed negative broadening would instead show positive broadening. The three lines with a negative NLTE correction also require negative broadening, suggesting that part of the overly broadened line profiles could be attributed to NLTE effects. We also found that removing the core of the line (within +3 km s−1) removes the necessity for negative broadening, illustrating that the NLTE effects are concentrated in the cores of these lines.
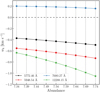 |
Fig. B.1 Fitted broadening values for four lines, fitting 1D LTE to 1D NLTE profiles. Larger NLTE effects are present in 5948.65 Å and 12228.15 Å lines than the 5772.46 Å and 7680.27 Å lines. |
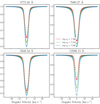 |
Fig. B.2 LTE (points) versus NLTE (solid lines) profiles for three representative abundance values. The 5948.54 Å and 12288.15 Å show visible NLTE effects in the core that become stronger with increasing abundance. |
Appendix C De-broadening of spectral lines
Mathematically, the effect of broadening is described as convolution and de-broadening as deconvolution. It is well-known that deconvolution is an ill-posed problem. A robust solution to a deconvolution problem can only be obtained by suitable regularisation. The problem becomes immediately apparent when considering a Gaussian (the “kernel”) with which a spectrum is to be de-convolved. In Fourier space, deconvolution corresponds to a division with the Fourier transform of the kernel, which is again a Gaussian in this case. The rapid decline of the wings of a Gaussian leads to a division by almost zero at distances of a few widths of the Gaussian away from its centre. Any numerical or physical imprecision leads to large disturbance under such circumstances. This means even noise-free synthetic line profiles cannot be de-convolved by a naive division of the raw spectrum by the Fourier transform of a Gaussian kernel.
The key question is now whether one can suitably regularise the problem or reduce the level of noise amplification. We followed the latter approach by seeking a different kernel with less steeply falling wings than a Gaussian. As starting point we chose the kernel function
 (C.1)
(C.1)
normalised to one according to
 (C.2)
(C.2)
The parameter a controls the width of the kernel. The kernel is symmetric, and has a peaked shape at the origin. Later, we shall discuss higher powers in terms of convolutions of the kernel with itself. We index the resulting kernels by the number of convolutions, which in the present case is one. Convolving a function f with kernel G1 results in a function g according to
 (C.3)
(C.3)
Our choice of the kernel function was inspired by work of Dorfi & Drury (1987). The authors pointed out that the above kernel is the Green’s function associated with the differential operator
 (C.4)
(C.4)
where 1 indicates the identity operator. This allows one to formulate the convolution expressed by Eq. C.3 as solution of a ordinary differential equation of second order. Discretising the differential operator, as well as the functions f and g (simplest on an equidistant x-grid), results in a set of linear equations of the form
 (C.5)
(C.5)
where A is a tri-diagonal matrix which can be inverted efficiently. Remarkably, in this formulation a deconvolution appears even simpler than convolution: if g is given, a simple matrix multiplication with matrix A yields the de-convolved function f. It was this feature that made us choose G1 as kernel for deconvolution, and for consistency, also for convolution. Using the same kernel when convolving a line profile has the advantage that during fitting there is a continuous transition from convolution to deconvolution and vice versa. This improves the stability of the fitting operation when having to deal with a situation where the broadening or de-broadening is around zero. It should be noted that the G kernels are in fact the Matérn functions with half-numbered indices (Genton 2002).
One may question the suitability of the function G1 for describing broadening or de-broadening effects, and might prefer a more Gaussian-shaped kernel. The Central Limit Theorem states that repeated convolution of a function with itself (subject to certain regularity conditions) approaches a Gaussian. We used this property to construct further kernel functions by convolving G1 with itself. We obtained the following sequence of functions
 (C.6)
(C.6)
![Mathematical equation: ${G_3} \equiv G_1^3\left( x \right) = {\alpha \over {16}}{e^{ - \alpha \left| x \right|}}\left[ {3\left( {1 + \alpha \left| x \right|} \right) + {\alpha ^2}{{\left| x \right|}^2}} \right],$](/articles/aa/full_html/2022/12/aa42072-21/aa42072-21-eq61.png) (C.7)
(C.7)
![Mathematical equation: ${G_4} \equiv G_1^4\left( x \right) = {\alpha \over {96}}{e^{ - \alpha \left| x \right|}}\left[ {15\left( {1 + \alpha \left| x \right|} \right) + {\alpha ^2}{{\left| x \right|}^2}\left( {6 + \alpha \left| x \right|} \right)} \right].$](/articles/aa/full_html/2022/12/aa42072-21/aa42072-21-eq62.png) (C.8)
(C.8)
All functions are normalised to one according to Eq. C.2. The possibility of formulating the convolution operation in Fourier space let it appear desirable to have the Fourier transforms of the Gn function at hand. Defining the Fourier transform via
 (C.9)
(C.9)
we obtained for the (purely real) transforms of the kernel functions
 (C.10)
Figure C.1 illustrates the shapes of kernels G1 and G3. G3 already resembles a Gaussian quite well, having a smooth maximum at the origin and wings that are moderately wider than in the case of a Gaussian. One should keep in mind that approaching a Gaussian brings back in the problems that we intended to mitigate, namely significant amplification of noise. Hence, one should limit the number of repeated convolutions. A last point concerns the choice of the broadening parameter α. While the formulae take a simple form by using α, physically one likes to specify the width of the kernel more directly. Fortunately, except for the pre-factor, all kernels are functions of the product α|x| alone, resulting in a simple (inverse) relation between the full width at half maximum (FWHM) of a kernel and a. For kernel G1, the relation reads  . The other kernels can be obtained from G1 by two-, three-, and four-fold application of G1 with a FWHM of 0.42243, 0.29746, and 0.24325 times the targeted FWHM, respectively. The numbers were obtained by solving numerically the transcendent equations for the widths of the three kernels in question, and the approach was applied when creating Figure C.1.
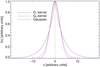 |
Fig. C.1 Shapes of the kernels G1 and G3 in comparison with a Gaussian. For display purposes all functions were normalised to Gi(0) = 1. All share the same FWHM. |
Figure C.2 illustrates the impact of convolving and deconvolving a Gaussian-shaped line profile with kernels G1 and G3. The FWHM of the line and the levels of broadening or de-broadening were roughly tailored after the silicon lines we observe in solar disk-centre spectra. G3 has a milder effect on the line shape than G1 at the same FWHM. While not clear from the plot, it turns out that one can largely mimic the effect of G1 by using G3 with a greater width. For the given parameters the “peaky” shape of G1 leaves no imprint in the line shape. So far, the kernels described above worked in practice, but deconvolution can be handled only for kernels significantly narrower than the spectral line to be de-broadened.
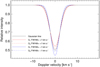 |
Fig. C.2 Broadening and de-broadening effects of kernels G1 and G3: a Gaussian-shaped line with FWHM of 5 km s−1 was convolved and de-convolved with kernels having an absolute width of 1 km s−1. Negative broadening values indicate a deconvolution. |
Appendix D Centre-to-limb variation of the continuum and line shapes predicted by the 3D models
On request by the referee here we report on the performance of our 3D models in combination with our spectral synthesis codes (Linfor3D for line syntheses, NLTE3D for spectral energy distributions) when representing the solar centre-to-limb variation (CLV) of its continuum radiation and the shape of lines. We start with the CLV, and later point to investigations in the literature which use features of line shapes that were calculated with the help of CO5BOLD models.
Figure D.3 shows a comparison between prediction of our 3D models with observations by Neckel & Labs (1994, hereafter NL). NL provide 30 wavelengths from the near-UV to the near-IR for which they measured relative intensities over narrow bandwidths (in equivalent Doppler velocity between 1.4 to 1.9 km s−1). The wavelength points were chosen to be largely free of absorption lines. We ran pure continuum syntheses for the NL wavelengths for our four 3D models, and for further comparison for three 1D model atmospheres. The lower panels (left panels in rotated view) depict the result. For the non-magnetic models msc600 and n59 the correspondence between observation and model prediction is very good for λ > 0.6 µm. We note that the results for models msc600 and n59 are almost identical so that they are difficult to distinguish on the scale of the plot. 1D models are added for setting the scale for a “very good” correspondence: a standard ATLAS9 (Kurucz 1979; Sbordone et al. 2004; Kurucz 2005) model shows a significantly steeper CLV than found in the observations. Similarly, an LHD model (LHD is a home-grown 1D stellar atmosphere code that uses the same microphysics as applied in our 3D models) shows a similar behaviour. Remarkably, our msc600 model performs even slightly better than the well-known Holweger-Müller solar model (Holweger 1967; Holweger & Mueller 1974) despite the fact that this semi-empirical model was constructed to match the CLV.
At λ < 0.6 µm the good correspondence deteriorates. However, as NL point out themselves the notion of observing pure continuum over the bandwidth used in the measurements becomes questionable. At wavelengths shorter than 0.6 µm the previously negligible contribution of line absorption to the observed intensity becomes non-zero but otherwise undefined. To address this issue we took an extreme stand and calculated the intensity over 20 Å wide intervals including all line absorption with the help of opacity distribution functions (ODFs). We combined line ODFs from Kurucz” ATLAS suite (Kurucz 2017) with continuous opacities from our own opacity package. In each ODF interval the distribution of the line opacity was represented by a step-function of 12 steps. For each step, the emergent intensity was calculated and finally integrated over the whole ODF interval so that we obtained the intensity emerging in the 20 Å wide ODF interval. From the construction is is clear that one obtains the average effect on the intensity of the absorbers present in the ODF interval. The upper panels (right panels in rotated view) of Fig. D.3 illustrate that the correspondence between model predictions and observations clearly improves for wavelengths λ < 0.6 µm, strongly suggesting that indeed missing line absorption is the reason for the mismatch at these shorter wavelength in the pure continuum calculations. In fact, the good correspondence in the near-UV is striking. One has to admit that this is certainly in part fortuitous since the true contribution of lines to the observations is unclear, and also whether the line lists going into the construction of the ODFs are sufficiently complete in the near-UV. To illuminate the influence of line absorption a bit further we write the intensity ratio between a location µ and and disk centre µ = 1 as
 (D.1)
(D.1)
where cµ is the continuum intensity at location µ and 1µ the intensity reduction by line absorption at this point. The approximate equality holds for weak line absorption. Equation (D.1) shows that there is a compensatory effect by considering intensity ratios. Moreover, since there is typically a reduction of the intensity ratio with respect to pure continuum calculations the contribution of line absorption must become larger towards the stellar limb. It is not straight forward to see why this is: the silicon lines synthesised for this investigation generally show a mild decrease in strength towards the limb -particularly the medium to strong lines. However, we conjecture that in fact molecular lines are a major player here which significantly increase in strength due to the lower temperatures at which line formation takes place towards the limb.
Since the contribution of lines is observationally not well-defined we have also plotted intensity ratios considering ODF sub-intervals only. We expected that especially the sub-interval with the smallest line contribution would result in a closer match to the observations which was, however, not immediately apparent (not shown). We finally remark that the findings discussed here coincide with results on the CLV based on a CO5BOLD model of an earlier generation (Ludwig et al. 2010).
For completeness we also investigated the CLV of the magnetic models b000 and b200. Figure D.3 illustrates that the field-free model provides a reasonable match to the observations while the 200 G model is clearly off. For the given (somewhat artificial) field configuration one may conclude that the observed CLV does not permit a mean field strength ≳ 50 G on the Sun. Pereira et al. (2013) already arrived at a similar conclusion by comparing a 100 G model with a field-free case.
All spectral synthesis calculations for the 3D models underlying Fig. D.3 approximate scattering in the continuum as well as lines as true absorption. We investigated the effect of this approximation on the CLV in the continuum by comparing the cases of isotropic coherent scattering and true absorption in a 1D stratification obtained when averaging (over optical depth surfaces and time) the msc600 model. As a first step, Fig. D.1 illustrates that scattering generally leads to an increase of the emergent intensity for wavelength ≲ 0.65 µm, and that effects becomes more pronounced towards the solar limb. However, quantitatively the changes of the intensity are modest (≲ 4.5 %). Figure D.2 shows that this translates into small differences (≲ 0.01) in the CLV, again, mostly at short wavelengths and close to the limb. The overall limb darkening reduces the effect apparent in the intensity ratios directly. To see this, we denote by S the intensity when scattering is treated exactly, by A the intensity when scattering is treated as true absorption. The difference in the CLV can then be written as
 (D.2)
(D.2)
The approximate equality comes from the observation that S(1) ≈ A(1). All this means that the very good correspondence between models and observations shown in Fig. D.3 gets only very slightly worse when scattering is treated correctly but remains very satisfactory.
We now briefly turn to line shapes, particularly line shifts, as predicted by model n59. As a first example we point to González Hernández et al. (2020, Fig. 6) where absolute core shifts of 144 Fe i lines are compared to observations. In their work a very accurate wavelength calibration of the observed spectra was achieved by utilising a laser frequency comb. Lines with an equivalent width less than 60 mÅ show a good correspondence with their observed shifts. One has to keep in mind here that a comparison on an absolute scale also relies on accurately known laboratory wavelengths. The reason for the mismatch of lines with equivalent widths greater than 60 mÅ is not clear but not necessarily related to shortcomings in the model structure. Moreover, it was also seen in LTE line syntheses based on STAGGER models (see González Hernández et al. 2020, for further discussion). As second example, in Löhner-Böttcher et al. (2019, Fig. 19) the observed shape of the Fe i 6173 Å line is compared to synthetic line profiles computed with a CO5BOLD model as a function of limb angle. While not all details are matched the overall correspondence is satisfactory.
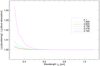 |
Fig. D.1 Ratio of the emergent intensities as function of wavelength and limb angle cosine µ between cases when continuum scattering is treated exactly or as true absorption. The average vertical profile of model msc600 was used as structure in the spectral synthesis calculations. |
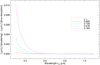 |
Fig. D.2 Difference of the centre-to-limb variation when continuum scattering is treated exactly or as true absorption. Note the reduction of the impact of scattering in comparison to Fig. D.1. |
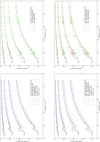 |
Fig. D.3 Centre-to-limb variation as predicted by our 3D models in comparison to observations and 1D results. Syntheses excluding (bottom) and including (top) line absorption are shown. Left panels: models msc600 and n59. Right panels: models b000 and b200. |
Appendix E The partition functions of silicon as implemented linfor3D
We compared the partition functions of the first three ionisation stages of silicon as implemented in our spectral synthesis code to data given in the recent compilation of Barklem & Collet (2016). We find a close to perfect agreement in the temperature range relevant for the formation of silicon lines in the solar photosphere, as seen in Fig. E.1.
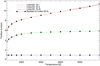 |
Fig. E.1 Partition functions implemented in LINFOR3D compared to data of Barklem & Collet (2016). |
References
- Abramowitz, M., & Stegun, I. A. 1965, Handbook of Mathematical Functions: With Formulas, Graphs, and Mathematical Tables (New York: Dover Publications) [Google Scholar]
- Allard, F., & Hauschildt, P. H. 1995, ApJ, 445, 433 [NASA ADS] [CrossRef] [Google Scholar]
- Allard, F., Hauschildt, P. H., Alexander, D. R., Tamanai, A., & Schweitzer, A. 2001, ApJ, 556, 357 [Google Scholar]
- Amarsi, A. M., & Asplund, M. 2017, MNRAS, 464, 264 [Google Scholar]
- Amarsi, A. M., Nordlander, T., Barklem, P. S., et al. 2018, A&A, 615, A139 [NASA ADS] [CrossRef] [EDP Sciences] [Google Scholar]
- Amarsi, A. M., Barklem, P. S., Collet, R., Grevesse, N., & Asplund, M. 2019, A&A, 624, A111 [NASA ADS] [CrossRef] [EDP Sciences] [Google Scholar]
- Anders, E., & Grevesse, N. 1989, Geochim. Cosmochim. Acta, 53, 197 [Google Scholar]
- Anstee, S. D., & O’Mara, B. J. 1991, MNRAS, 253, 549 [NASA ADS] [CrossRef] [Google Scholar]
- Anstee, S. D., & O’Mara, B. J. 1995, MNRAS, 276, 859 [Google Scholar]
- Asplund, M. 2000, A&A, 359, 755 [NASA ADS] [Google Scholar]
- Asplund, M., Grevesse, N., & Sauval, A. J. 2005, ASP Conf. Ser., 336, 2005 [NASA ADS] [Google Scholar]
- Asplund, M., Grevesse, N., Sauval, A. J., & Scott, P. 2009, ARA&A, 47, 481 [NASA ADS] [CrossRef] [Google Scholar]
- Asplund, M., Amarsi, A. M., & Grevesse, N. 2021, A&A, 653, A141 [NASA ADS] [CrossRef] [EDP Sciences] [Google Scholar]
- Barklem, P. S., & Aspelund-Johansson, J. 2005, A&A, 435, 373 [NASA ADS] [CrossRef] [EDP Sciences] [Google Scholar]
- Barklem, P. S., & Collet, R. 2016, A&A, 588, A96 [NASA ADS] [CrossRef] [EDP Sciences] [Google Scholar]
- Barklem, P. S., & O’Mara, B. J. 1998a, MNRAS, 300, 863 [NASA ADS] [CrossRef] [Google Scholar]
- Barklem, P. S., Anstee, S. D., & O’Mara, B. J. 1998b, Publ. Astron. Soc. Aust., 15, 336 [NASA ADS] [CrossRef] [Google Scholar]
- Bartels, J. 1934, Terr. Magn. Atmos. Electr., 39, 201 [CrossRef] [Google Scholar]
- Becker, U., Zimmermann, P., & Holweger, H. 1980, Geochim. Cosmochim. Acta, 44, 2145 [NASA ADS] [CrossRef] [Google Scholar]
- Bergemann, M., Kudritzki, R.-P., Würl, M., et al. 2013, ApJ, 764, 115 [NASA ADS] [CrossRef] [Google Scholar]
- Bergemann, M., Gallagher, A. J., Eitner, P., et al. 2019, A&A, 631, A80 [NASA ADS] [CrossRef] [EDP Sciences] [Google Scholar]
- Böhm-Vitense, E. 1958, Zeitsch. Astrophys., 46, 108 [Google Scholar]
- Borrero, J. M. 2008, ApJ, 673, 470 [Google Scholar]
- Borrero, J. M., Bellot Rubio, L. R., Barklem, P. S., & del Toro Iniesta, J. C. 2003, A&A, 404, 749 [NASA ADS] [CrossRef] [EDP Sciences] [Google Scholar]
- Bueno, J. T., Shchukina, N., & Ramos, A. A. 2004, Nature, 430, 326 [CrossRef] [Google Scholar]
- Caffau, E., Ludwig, H. G., Steffen, M., Freytag, B., & Bonifacio, P. 2011, Sol. Phys., 268, 255 [Google Scholar]
- Caffau, E., Ludwig, H.-G., Steffen, M., et al. 2015, A&A, 579, A88 [NASA ADS] [CrossRef] [EDP Sciences] [Google Scholar]
- Cattaneo, F., Emonet, T., & Weiss, N. 2003, ApJ, 588, 1183 [NASA ADS] [CrossRef] [Google Scholar]
- Cheung, M. C. M., Schuessler, M., Tarbell, T. D., & Title, A. M. 2008, ApJ, 687, 1373 [NASA ADS] [CrossRef] [Google Scholar]
- Collet, R., Magic, Z., & Asplund, M. 2011, J. Phys. Conf. Ser., 328, 012003 [NASA ADS] [CrossRef] [Google Scholar]
- Delbouille, L., Roland, G., & Neven, L. 1973, Atlas Photométrique du Spectre Solaire de λ 3000 à λ 10000 (Liège: Université de Liège, Institut d’Astrophysique, 1973) [Google Scholar]
- Doerr, H.-P., Vitas, N., & Fabbian, D. 2016, A&A, 590, A118 [NASA ADS] [CrossRef] [EDP Sciences] [Google Scholar]
- Dorfi, E. A., & Drury, L. O. 1987, J. Comput. Phys., 69, 175 [NASA ADS] [CrossRef] [Google Scholar]
- Drawin, H. W. 1967, Collision and transport cross-sections, Tech. Rep. EUR- CEA-FC-383 (Rev.), Commissariat à l’Energie Atomique, Fontenay-aux-Roses, France [Google Scholar]
- Fabbian, D., & Moreno-Insertis, F. 2015, ApJ, 802, 96 [NASA ADS] [CrossRef] [Google Scholar]
- Fabbian, D., Khomenko, E., Moreno-Insertis, F., & Nordlund, Å. 2010, ApJ, 724, 1536 [NASA ADS] [CrossRef] [Google Scholar]
- Fabbian, D., Moreno-Insertis, F., Khomenko, E., & Nordlund, Å. 2012, A&A, 548, A35 [NASA ADS] [CrossRef] [EDP Sciences] [Google Scholar]
- Freytag, B., Steffen, M., Ludwig, H. G., et al. 2012, J. Comput. Phys., 231, 919 [Google Scholar]
- Garz, T. 1973, A&A, 26, 471 [NASA ADS] [Google Scholar]
- Genton, M. G. 2002, J. Mach. Learn. Res., 2, 299 [Google Scholar]
- González Hernández, J. I., Rebolo, R., Pasquini, L., et al. 2020, A&A, 643, A146 [EDP Sciences] [Google Scholar]
- Gray, D. F. 2008, The Observation and Analysis of Stellar Photospheres (Cambridge: Cambridge University Press) [Google Scholar]
- Grevesse, N., & Sauval, A. J. 1998, Space Sci. Rev., 85, 161 [Google Scholar]
- Gudiksen, B. V., Carlsson, M., Hansteen, V. H., et al. 2011, A&A, 531, A154 [NASA ADS] [CrossRef] [EDP Sciences] [Google Scholar]
- Gustafsson, B. 1975, A&A, 42, 407 [NASA ADS] [Google Scholar]
- Gustafsson, B., Edvardsson, B., Eriksson, K., et al. 2008, A&A, 486, 951 [NASA ADS] [CrossRef] [EDP Sciences] [Google Scholar]
- Heiter, U., Lind, K., Bergemann, M., et al. 2021, A&A, 645, A106 [EDP Sciences] [Google Scholar]
- Henyey, L., Vardya, M. S., & Bodenheimer, P. 1965, ApJ, 142, 841 [Google Scholar]
- Holweger, H. 1967, Z. Astrophys., 65, 365 [NASA ADS] [Google Scholar]
- Holweger, H. 1973, A&A, 26, 275 [NASA ADS] [Google Scholar]
- Holweger, H. 2001, AIP Conf. Proc. 598, 23 [NASA ADS] [CrossRef] [Google Scholar]
- Holweger, H., & Mueller, E. A. 1974, Sol. Phys., 39, 19 [NASA ADS] [CrossRef] [Google Scholar]
- Kupka, F., Piskunov, N., Ryabchikova, T. A., Stempels, H. C., & Weiss, W. W. 1999, Astron. Astrophys. Suppl. Ser., 138, 119 [NASA ADS] [CrossRef] [EDP Sciences] [Google Scholar]
- Kupka, F. G., Ryabchikova, T. A., Piskunov, N. E., Stempels, H. C., & Weiss, W. W. 2000, Balt. Astron., 9, 590 [Google Scholar]
- Kurucz, R. L. 1979, ApJS, 40, 1 [NASA ADS] [CrossRef] [Google Scholar]
- Kurucz, R. L. 2005, Mem. Soc. Astron. Ital. Suppl., 8, 14 [Google Scholar]
- Kurucz, R. L. 2007, Robert L. Kurucz on-Line Database of Observed and Predicted Atomic Transitions [Google Scholar]
- Kurucz, R. L. 2014, Robert L. Kurucz on-Line Database of Observed and Predicted Atomic Transitions [Google Scholar]
- Kurucz, R. L. 2017, Astrophys. Source Code Libr. [record ascl:1710.017] [Google Scholar]
- Leenaarts, J., & Carlsson, M. 2009, ASP Conf. Ser., 415, 4 [Google Scholar]
- Leitner, P., Lemmerer, B., Hanslmeier, A., et al. 2017, Astrophys. Space Sci., 362, 181 [NASA ADS] [CrossRef] [Google Scholar]
- Lodders, K. 2003, ApJ, 591, 1220 [Google Scholar]
- Lodders, K. 2021, Space Sci. Rev., 217, 44 [NASA ADS] [CrossRef] [Google Scholar]
- Lodders, K., Palme, H., & Gail, H.-P. 2009, in Landolt-Bornstein, New Series, Astronomy and Astrophysics (Berlin: Springer Verlag), VI/4B, 560 [Google Scholar]
- Löhner-Böttcher, J., Schmidt, W., Schlichenmaier, R., Steinmetz, T., & Holzwarth, R. 2019, A&A, 624, A57 [Google Scholar]
- Ludwig, Caffau, E., Steffen, M., et al. 2010, IAU Symp., 265, 201 [NASA ADS] [Google Scholar]
- Magic, Z., Collet, R., Asplund, M., et al. 2013, A&A, 557, A26 [NASA ADS] [CrossRef] [EDP Sciences] [Google Scholar]
- Markwardt, C. B. 2009, ASP Conf. Ser., 411, 251 [Google Scholar]
- Moore, C. E. 1970, Vistas Astron., 12, 307 [CrossRef] [Google Scholar]
- Neckel, H., & Labs, D. 1984, Sol. Phys., 90, 205 [Google Scholar]
- Neckel, H. & Labs, D. 1994, Sol. Phys., 153, 91 [CrossRef] [Google Scholar]
- Nordlund, Å., Stein, R. F., & Asplund, M. 2009, Living Rev. Sol. Phys., 6, 2 [Google Scholar]
- O’Brian, T. R., & Lawler, J. E. 1991a, Phys. Rev. A, 44, 7134 [CrossRef] [Google Scholar]
- O’Brian, T. R., & Lawler, J. E. 1991b, Phys. Lett. A, 152, 407 [Google Scholar]
- Palme, H., Lodders, K., & Jones, A. 2014, Planets, Asteriods, Comets and the Solar System, 2, 15 [NASA ADS] [Google Scholar]
- Payne, C. H. 1925, Ph.D. thesis, American Doctoral Dissertations, Radcliffe College, Cambridge, USA [Google Scholar]
- Pehlivan Rhodin, A. 2018, Ph.D. thesis, Department of Astronomy and Theoretical Physics, Lund University, Sweden https://lup.lub.lu.se/search/search/person/astr-ape [Google Scholar]
- Pereira, T. M. D., Asplund, M., Collet, R., et al. 2013, A&A, 554, A118 [NASA ADS] [CrossRef] [EDP Sciences] [Google Scholar]
- Prša, A., Harmanec, P., Torres, G., et al. 2016, AJ, 152, 41 [Google Scholar]
- Ramírez Vélez, J. C., López Ariste, A., & Semel, M. 2008, A&A, 487, 731 [NASA ADS] [CrossRef] [EDP Sciences] [Google Scholar]
- Roederer, I. U., & Barklem, P. S. 2018, ApJ, 857, 2 [Google Scholar]
- Russell, H. N. 1929, ApJ, 70, 11 [NASA ADS] [CrossRef] [Google Scholar]
- Ryabchikova, T., Piskunov, N., Kurucz, R. L., et al. 2015, Phys. Scr., 90, 054005 [Google Scholar]
- Sbordone, L., Bonifacio, P., Castelli, F., & Kurucz, R. L. 2004, Mem. Della Soc. Astron. Ital. Suppl., 5, 93 [Google Scholar]
- Scott, P., Grevesse, N., Asplund, M., et al. 2015, A&A, 573, A25 [NASA ADS] [CrossRef] [EDP Sciences] [Google Scholar]
- Serenelli, A., Scott, P., Villante, F. L., et al. 2016, MNRAS, 463, 2 [NASA ADS] [CrossRef] [Google Scholar]
- Shaltout, A. M. K., Beheary, M. M., Bakry, A., & Ichimoto, K. 2013, MNRAS, 430, 2979 [CrossRef] [Google Scholar]
- Shchukina, N., Sukhorukov, A., & Trujillo Bueno, J. 2012, ApJ, 755, 176 [NASA ADS] [CrossRef] [Google Scholar]
- Shchukina, N. G., Sukhorukov, A. V., & Trujillo Bueno, J. 2015, IAU Symp., 305, 368 [Google Scholar]
- Shchukina, N., Sukhorukov, A., & Trujillo Bueno, J. 2016, A&A, 586, A145 [NASA ADS] [CrossRef] [EDP Sciences] [Google Scholar]
- Shi, J. R., Gehren, T., Butler, K., Mashonkina, L. I., & Zhao, G. 2008, A&A, 486, 303 [NASA ADS] [CrossRef] [EDP Sciences] [Google Scholar]
- Shi, J. R., Takada-Hidai, M., Takeda, Y., et al. 2012, ApJ, 755, 36 [NASA ADS] [CrossRef] [Google Scholar]
- Spruit, H. C. 1976, Sol. Phys., 50, 269 [NASA ADS] [CrossRef] [Google Scholar]
- Steenbock, W., & Holweger, H. 1984, A&A, 130, 319 [NASA ADS] [Google Scholar]
- Steffen, M. 2017, Mem. Della Soc. Astron. Ital., 88, 22 [NASA ADS] [Google Scholar]
- Steffen, M., Prakapavicius, D., Caffau, E., et al. 2015, A&A, 583, A57 [NASA ADS] [CrossRef] [EDP Sciences] [Google Scholar]
- Stein, R. F., & Nordlund, Å. 2000, Sol. Phys., 192, 91 [NASA ADS] [CrossRef] [Google Scholar]
- Unsold, A. 1928, Z. Phys., 46, 765 [NASA ADS] [CrossRef] [Google Scholar]
- Unsold, A. 1955, Physik Der Sternatmosphären Mit Besonderer Berücksichtigung Der Sonne (Berlin: Springer-Verlag) [Google Scholar]
- Vinyoles, N., Serenelli, A. M., Villante, F. L., et al. 2017, ApJ, 835, 202 [NASA ADS] [CrossRef] [Google Scholar]
- Vögler, A., Shelyag, S., Schüssler, M., et al. 2005, A&A, 429, 335 [Google Scholar]
- von Steiger, R., & Zurbuchen, T. H. 2016, ApJ, 816, 13 [Google Scholar]
- Wedemeyer, S. 2001, A&A, 373, 998 [NASA ADS] [CrossRef] [EDP Sciences] [Google Scholar]
lg ≡ log10.
All Tables
Fitted 3D LTE abundance and broadening values for disk-centre (DC) and disk-integrated (DI) spectra with their formal statistical uncertainties.
Equivalent widths for the four models presented in this study alongside those given in Amarsi & Asplund (2017) (AA17).
All Figures
|
Fig. 1 Individual fitted Si abundances for a set of eight Si i lines and one Si ii line as a function of equivalent width (left) and excitation potential (right) for eight Si i lines and one Si ii line. Only the Si i lines are used to determine the mean and RMSE (see definition in Eq. (8)), given in the legend in the left panel. G73+OBL91 indicates oscillator strengths from Garz (1973) normalised according to the results of O’Brian & Lawler (1991a); the oscillator strength for the Si ii line for comparison was taken from Kurucz (2014); PR18 indicates oscillator strengths from Pehlivan Rhodin (2018). |
| In the text | |
|
Fig. 2 Synthesised fitted line profile (black line) against the observations from the Hamburg atlas (points). Grey points were cut from the initial fit; blue points show areas where the deviation between initial fit and data is too high, and so the subsequent fits do not use the offending points; red points are used for computing all fitted quantities. Removing the points on right hand side removes the strong blend, and sigma-clipping handles weaker ones during fitting. wK is the width of the broadening kernel used. Note that this line is not used in the final determination of the silicon abundance because of the large line blends. |
| In the text | |
|
Fig. 3 Comparison of two silicon line profiles while locally fitting the continuum. Observations are shown in black and the fitted syntheses at 5701.11 and 5708.40 Å are shown in red and blue, respectively, along with the fitted continuum value. Across a wider wavelength range, the various fitted continua are not consistent with one another. |
| In the text | |
|
Fig. 4 Synthesised fitted line shapes (black solid line) against observations from the Hamburg spectrum (points) for 11 silicon lines for the msc600 model. Grey points were removed before fitting, blue points show areas where sigma-clipping was employed to remove poorly fitting points, and red points were used for determining final fitted quantities. Green lines show the residuals increased by a factor of 10 for readability. In each panel, the name of the line, the reduced χ2 value, the width of the broadening kernel wK, and the LTE abundance log εSi are shown. The final weighted mean abundance of 7.57 ± 0.04 includes the −0.01 dex NLTE correction, a fixed continuum, no pre-broadening, and de-broadening. |
| In the text | |
|
Fig. 5 Comparison of abundance and broadening between the b000 (red points), and b200 (blue points) models. The red and blue horizontal dashed lines follow the same colour scheme and show the weighted average values. Triangles indicate the lines used in the subsample. Increasing the magnetic field strength increases fitted abundance and decreases negative broadening. |
| In the text | |
|
Fig. 6 Vertical RMS velocity profiles in and around line-forming regions for the b000, b200 models (solid lines) with the msc600, n59, and 2 other models at much lower and higher effective temperatures shown for comparison (dotted lines). The b200 model clearly has lower RMS velocity than the other solar-type models, even though its effective temperature is higher. |
| In the text | |
|
Fig. 7 Comparison of abundance and broadening between the msc600 (red points), m595 (green points) and n59 (blue points) models. Triangles indicate the lines used in the subsample. The red, green and blue horizontal dashed lines follow the same colour scheme and show the weighted average values. |
| In the text | |
|
Fig. 8 Line profiles from msc600 (black) and n59 (red) models with the residuals magnified by a factor of 10 in green. The difference in the line profiles is greatest in the line core. |
| In the text | |
|
Fig. 9 Differences between disk-centre and disk-integrated fitted abundances for the msc600 model. Red triangles indicate the lines in the subsample used for the final abundance calculation. |
| In the text | |
|
Fig. 10 Elemental abundance differences between CI chondrites ( |
| In the text | |
|
Fig. 11 Differences in equivalent width (top) and fitted abundance (bottom) in comparison to the values in Amarsi & Asplund (2017). The numbers in the bottom panel give the mean abundance difference using the weighting scheme of Amarsi & Asplund (2017). The difference in abundance includes all sources, not just the difference in equivalent width. |
| In the text | |
|
Fig. 12 Correlation coefficient between fitted parameters for the msc600 model. Δλ is the wavelength shift, log εSi is the abundance and wK is the width of the broadening kernel. |
| In the text | |
|
Fig. A.1 LINFOR3D + CO5BOLD n59 model syntheses (red lines) fit to BALDER + STAGGER (black points). Green lines show residuals increased by a factor of 10. The mean abundance as derived by the CO5BOLD fit is 7.52 ± 0.01. |
| In the text | |
|
Fig. A.2 LINFOR3D + CO5BOLD m595 model model syntheses (red lines) fit to BALDER + STAGGER (black points). Green lines show residuals increased by a factor of 10. The mean abundance as derived by the CO5BOLD fit is 7.52 ± 0.01. |
| In the text | |
|
Fig. A.3 LINFOR3D + CO5BOLD msc600 model model syntheses (red lines) fit to BALDER + STAGGER (black points). Green lines show residuals increased by a factor of 10. The mean abundance as derived by the CO5BOLD fit is 7.51 ± 0.01. |
| In the text | |
|
Fig. B.1 Fitted broadening values for four lines, fitting 1D LTE to 1D NLTE profiles. Larger NLTE effects are present in 5948.65 Å and 12228.15 Å lines than the 5772.46 Å and 7680.27 Å lines. |
| In the text | |
|
Fig. B.2 LTE (points) versus NLTE (solid lines) profiles for three representative abundance values. The 5948.54 Å and 12288.15 Å show visible NLTE effects in the core that become stronger with increasing abundance. |
| In the text | |
|
Fig. C.1 Shapes of the kernels G1 and G3 in comparison with a Gaussian. For display purposes all functions were normalised to Gi(0) = 1. All share the same FWHM. |
| In the text | |
|
Fig. C.2 Broadening and de-broadening effects of kernels G1 and G3: a Gaussian-shaped line with FWHM of 5 km s−1 was convolved and de-convolved with kernels having an absolute width of 1 km s−1. Negative broadening values indicate a deconvolution. |
| In the text | |
|
Fig. D.1 Ratio of the emergent intensities as function of wavelength and limb angle cosine µ between cases when continuum scattering is treated exactly or as true absorption. The average vertical profile of model msc600 was used as structure in the spectral synthesis calculations. |
| In the text | |
|
Fig. D.2 Difference of the centre-to-limb variation when continuum scattering is treated exactly or as true absorption. Note the reduction of the impact of scattering in comparison to Fig. D.1. |
| In the text | |
|
Fig. D.3 Centre-to-limb variation as predicted by our 3D models in comparison to observations and 1D results. Syntheses excluding (bottom) and including (top) line absorption are shown. Left panels: models msc600 and n59. Right panels: models b000 and b200. |
| In the text | |
|
Fig. E.1 Partition functions implemented in LINFOR3D compared to data of Barklem & Collet (2016). |
| In the text | |
Current usage metrics show cumulative count of Article Views (full-text article views including HTML views, PDF and ePub downloads, according to the available data) and Abstracts Views on Vision4Press platform.
Data correspond to usage on the plateform after 2015. The current usage metrics is available 48-96 hours after online publication and is updated daily on week days.
Initial download of the metrics may take a while.